A Variationally Computed IR Line List for the Methyl Radical CH3
Abstract
We present the first variational calculation of a hot temperature ab initio line list for the CH3 radical. It is based on a high level ab initio potential energy surface and dipole moment surface of CH3 in the ground electronic state. The ro-vibrational energy levels and Einstein coefficients were calculated using the general-molecule variational approach implemented in the computer program TROVE. Vibrational energies and vibrational intensities are found to be in very good agreement with the available experimental data. The line list comprises 9,127,123 ro-vibrational states () and 2,058,655,166 transitions covering the wavenumber range up to 10000 cm-1 and should be suitable for temperatures up to K.
Bergische Universität]Fakultät für Mathematik und Naturwissenschaften, Physikalische und Theoretische Chemie, Bergische Universität Wuppertal, D–42097 Wuppertal, Germany DESY and Universität Hamburg]Center for Free-Electron Laser Science, Deutsches Elektronen-Synchrotron DESY, Notkestraße 85, D-22607 Hamburg, Germany, The Hamburg Center for Ultrafast Imaging, Universität Hamburg, Luruper Chaussee 149, D-22761 Hamburg, Germany University College London]Department of Physics and Astronomy, University College London, Gower Street, London WC1E 6BT, United Kingdom Bergische Universität]Fakultät für Mathematik und Naturwissenschaften, Physikalische und Theoretische Chemie, Bergische Universität Wuppertal, D–42097 Wuppertal, Germany
1 Introduction
The methyl radical CH3 is a free radical of major importance in many areas of science such as hydrocarbon combustion processes,1 atmospheric chemistry,2 the chemistry of semiconductor production3, the chemical vapor deposition of diamond4, and many chemical processes of current industrial and environmental interest. It is also expected to be present in exo-planetary atmospheres 5, in the atmospheres of Saturn6 and Neptune7, and in the interstellar medium,8 where it is thought to be one of the most abundant free radicals.5 Because of its central role in this variety of situations, its structural and spectroscopic parameters have been extensively studied. Diverse spectroscopic techniques have been employed to determine absolute concentrations of CH3 in the gas phase, including UV/visible9, infrared10, and Raman spectroscopies 11, 12, 13, 14, 15, 16, 17. In addition, CH3 is an example of a molecule with large vibrational contribution to the hyperfine coupling constant, accounting for up to about 41% of the total value (see Ref. 18 and references therein).
Owing to the importance of CH3 in various contexts, in particular in astrophysics and -chemistry, its concentrations or column densities in remote environments such as interstellar space, the terrestrial atmosphere, exo-planetary atmospheres, and the outer layers of cool stars are of interest and it is desirable to determine these by remote-sensing spectroscopic methods. A prerequisite for such determinations is the knowledge of the transition moments for the observed transitions, and these must often be obtained in theoretical calculations as done, for example, in the ExoMol project19, 20 by Yurchenko and co-workers.21, 22, 23, 24, 25, 26, 27, 28, 29, 30, 31, 32, 33 This project aims at providing theoretically computed transition moments and simulated spectra for (small to medium-sized) general polyatomic molecules of astrophysical and/or -chemical interest. In general, molecular transition moments known to within 10-20% (the typical accuracy of the transition moment data of the HITRAN database34) are sufficiently accurate to be useful for most applications involving determination of concentrations and column densities, at least for fundamental and overtone bands. The level of ab initio theory used in the present study [RCCSD(T)-F12b /cc-pVQZ-F12; see below] is expected to be sufficient to satisfy this requirement for the transition moments computed in the present work. Also, we expect the inaccuracy of our calculations to be predominantly caused by the inaccuracy of the ab initio potential energy surface, and not by the truncation of the kinetic energy operator expansion.
At equilibrium, the three protons of electronic-ground-state CH3 form an equilateral triangle with the C nucleus at the centre-of-mass of the planar structure with D3h point group symmetry (see Table A-10 of Ref.35). There is no permanent dipole moment, and so the pure rotational transitions are dipole forbidden and very weak. Also, the planar ground-state equilibrium structure precludes most one-photon transitions to excited electronic states.36 Owing to the extremely weak rotational spectrum, determinations of concentrations and column densities for CH3 must be made with rovibrational transitions in the infrared region. The most suitable transitions are those in the intense fundamental band at 606 cm-1 (where is the out-of-plane bending mode). This band provides convenient transitions for concentration measurements and has been used extensively for this purpose37, 38, 39, 40. As mentioned above, the corresponding transition moments must be known in order that concentrations can be determined, and the present work can be viewed as a first step towards providing extensive catalogues of theoretical transition moments for CH3, so-called line lists, of use in astrophysical studies. In the present work we apply a high level ab initio potential energy surface, refined by means of experimental spectroscopic data, and ab initio dipole moment surfaces to compute, with the TROVE program, 41, 42, 43, 44 sufficient energies and transition moments for generating a hot ( K) IR line list for CH3.
2 Theory
2.1 Potential energy surface
The potential energy surface (PES) employed for the electronic ground state of CH3 in the present work is based on the ab initio surface reported in Ref.18, which we denote as PES-1. The PES-1 electronic energies were computed for 24 000 symmetry-unique molecular geometries at the open-shell RCCSD(T)-F12b 45, 46 level of theory (explicitly correlated F12 restricted coupled cluster included single and double excitations with a noniterative correction for triples) and the F12-optimized correlation consistent polarized valence basis set cc-pVQZ-F12.47 The carbon inner-shell electron pair was treated as frozen core in the correlated calculations. By using the frozen-core approximation we benefit from error cancellation. It is well known that, e.g. for second-row atoms, the core-valence correlation is almost exactly cancelled by the more costly high-order correlation effects.48 Keeping only one of them would make the accuracy deteriorate.
The analytical representation for the PES was obtained in a least-squares fitting procedure using the parameterized function from Lin et al. 49:
| (1) | |||||
this function depends on the stretching variables
| (2) |
where is the instantaneous value of the distance between the C nucleus and the proton Hk labeled 1, 2, or 3; is the common equilibrium value of the three bond lengths, and is a Morse parameter. Furthermore, the symmetrized bending variables are defined as
| (3) |
with as the bond angle (HjXHk) where is a permutation of the numbers (1,2,3). Finally, the variable
| (4) |
describes the out-of-plane bending. At the planar equilibrium configuration, we have 360∘ and so 1. The functions and in Eq. (1) are defined as
| (5) | |||||
| (6) |
where the quantities and in Eqs. (5) and (6) are expansion coefficients. The optimized values of the parameters , , , and are given in the supplementary material to Ref. 18 together with Fortran 90 routine for calculating PES values.
The analytical form of PES-118 is given in terms of the ab initio cc-pVQZ-F12 values of the equilibrium structural parameters, Å and ,18 for the electronic ground state of CH3. In the present work, we optimized the value of in a least-squares fitting to experimentally derived to rotational energy spacings within the vibrational states of CH3. The fitting produced Å; 120∘ by symmetry. We use these optimized values of the equilibrium structural parameters. All results presented below are based on the analytical potential energy function called PES-2, obtained from PES-118 by replacing the ab initio cc-pVQZ-F12 value of by the adjusted value given here. The remaining PES-2 parameter values are identical to those of PES-1 and can be obtained from the supplementary material to Ref. 18.
2.2 Dipole moment surface
The dipole moment surface (DMS) for the electronic ground state of CH3 was computed using the MOLPRO50 program package. Frozen-core calculations were carried out for 19 361 symmetry-unique geometries (15 600 below 30 000 cm-1) using the spin-restricted open-shell coupled cluster theory RCCSD(T) 51 and the augmented correlation consistent valence basis set aug-cc-pVTZ 52, 53, employing the two-point stencil central finite differences with the electric field strength of 0.002 a.u.
We employ the so-called symmetrized molecular-bond (SMB) representation22 [which is an extension of the molecular-bond (MB) representation 54] to formulate analytical functions describing the molecular dipole moment components. The SMB representation makes use of the projections of the dipole moment on the molecular bonds, where is the unit vector along the C–Hk bond,
| (7) |
with , 1, 2, 3, as the position vector of proton and as the position vector of the C nucleus.
We form symmetry-adapted linear combinations of the MB projections :
| (8) | |||||
| (9) | |||||
| (10) |
where, in addition to the vectors , we have introduced with as the ‘trisector’
| (11) |
The subscripts , , and of the quantities in Eqs. (8)–(10) refer to the irreducible representations (Table A-10 of Ref. 35) of the CH3 molecular symmetry group D3h(M); the electronically averaged dipole moment generates the representation . The quantity is antisymmetric under the inversion operation35 and vanishes at planarity, so that has only two non-vanishing, linearly independent components at planarity. These two components vanish at planar configurations with D3h point group symmetry.
The three components of the SMB dipole moment in Eqs. (8)–(10) are represented by 4th order polynomial expansions
| (12) | ||||
in terms of the variables
| (13) |
with and
| (14) |
where are defined in Eq. (3). The expansion coefficients are defined as
| (15) |
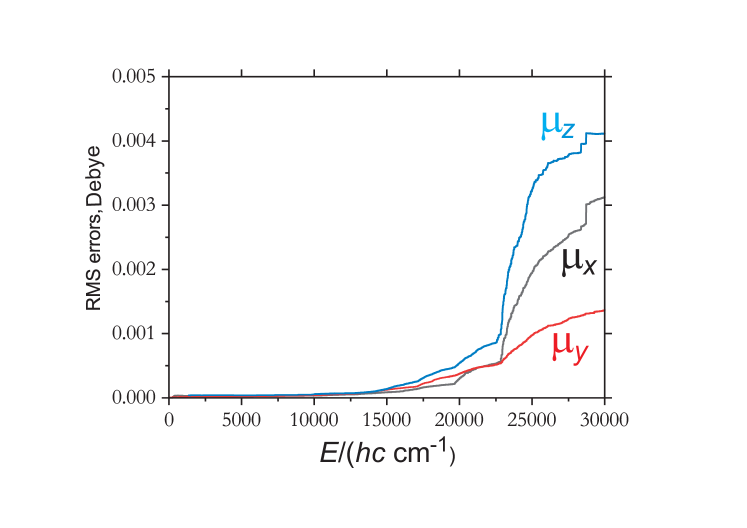
where is given by Eq. (4) and the maximal order of the polynomial is . For more details the reader is referred to Ref.22. The final fit of the 15 600 geometries required a total number of 218 parameters (131 for and 87 for and ) and reproduced the ab initio data with a root-mean-square (RMS) differences of 0.003 D, 0.001 D and 0.004 D for the and components respectively and energies up to 30 000 cm-1, see Figure 1. A series of fittings to the , and ab initio dipole-moment components have been carried out, including in the data set for each fitting the ab initio points with electronic energy (relative to the potential energy minimum) , and increasing . Figure 1 shows the RMS deviation for each dipole-moment component as a function of . The DMS expansion parameter set and the Fortran 90 functions are included in the supplementary material.
2.3 Intensity simulations with TROVE
The ‘readiness’ of the molecule to make an absorption or emission transition from an initial ro-vibrational state to a final ro-vibrational state is expressed by the line strength55, 35, 56 , a quantity with units of [dipole moment]2 (typically Debye2). For 0, the transition does not take place and need not be considered. As discussed in Ref.35 transitions with 0 are said to satisfy selection rules which we can derive from symmetry considerations before we do quantitative, numerical calculations of . Thus, these calculations need only be done for transitions satisfying the selection rules, and after obtaining values of for these transitions, we can compute the corresponding Einstein coefficients and absorption intensities.
The initial(final) state () has the rotation-vibration wavefunction (). The line strength55, 35, 56 of the ro-vibrational transition is
| (16) |
where the nuclear spin statistical weight factor35 is denoted and the electronically averaged component of the molecular dipole moment along the space-fixed axis35 is denoted , , , or . The quantity () is the quantum number defining the projection of the total angular momentum on the axis for the initial(final) state.
Assuming that the molecules considered are in thermal equilibrium at the absolute temperature , the intensity of a spectral line is determined as
| (17) |
Here, the absorption wavenumber is denoted , and Eq. (17) yields the intensity of a transition from the initial state with energy to the final state with energy , where = . The partition function is defined as , where is the total degeneracy of the state with energy and the sum runs over all energy levels of the molecule, and other symbols have their usual meanings. The total degeneracy is given by times the spin degeneracy ( 2) and times the nuclear spin degeneracy which is 4, 0, 2, 4, 0, 2 for and symmetries respectively. The ground electronic state of CH3 is a doublet ( ) with a small splitting57, 58 in the rovibrational energy levels due to spin-rotation interactions, around 0.01 cm-1, which we therefore chose to ignore in the present work.
Yurchenko et al. 55 have given, in their Eq. (21), a detailed expression for the line strength of an individual ro-vibrational transition within an isolated electronic state of an XY3 pyramidal molecule. Assuming that the populations of the lower (initial) states are Boltzmann-distributed, we limit the intentity calculations to transitions starting from levels below 9 000 cm-1. With this limitation, Boltzmann factors of enter into Eq. (17) for K. It is common to use the partition function for estimating the completeness of the line list for a given temperature 24. Towards this end, we consider the ratio , where is the converged partition function value calculated by explicit summation over all computed energy levels and is the partition function value calculated by summation over levels with energies lower than 9000 cm-1. This ratio gives 95 % completeness at temperatures below 1500 K. Consequently, we estimate 1500 K to be the maximal temperature for which our line list is realistic. Since it is safe to limit the lower-state energies to be below 9000 cm-1, it is sufficient to consider rotational states with 40. We compute a line list in the wavenumber range 0–10 000 cm-1; the upper energy limit (i.e., the maximum value of the final-state energy) corresponds to a term value of 19,000 cm-1.
3 Computational details
The variational nuclear-motion calculations are done with a symmetry-adapted basis set. With such a basis set, the Hamiltonian matrix becomes block diagonal according to the irreducible representations of the D3h(M) molecular symmetry group:35 , , , , , and . The and matrices are of no interest for CH3 as the corresponding states have zero nuclear spin statistical weights and do not exist in nature.35 The and matrices each split into two sub-blocks, of which only one must be diagonalized.35
The calculation of the matrix elements in Eq. (16) is the bottle-neck in the spectrum simulations. Here, the wavefunctions are given as superpositions of symmetry-adapted basis functions (see Eq. (65) of Yurchenko et al. 44):
| (18) |
with the as expansion coefficients. In Eq. (18), the symmetrized rotational basis functions are denoted with ( 0 or 1) defining the rotational parity, and is a vibrational basis function. In order to accelerate this part of the calculation, we pre-screened the expansion coefficients . All terms with coefficients less than the threshold value of were discarded in the intensity calculation.
The evaluation of the dipole moment matrix elements has been made more efficient in a two-step procedure. In the first step, an effective line strength is evaluated for a given lower state :
| (19) |
Here, is a short-hand notation for the primitive basis function . From the -values obtained, we compute, in the second step, the line strength as
| (20) |
We had to compute a very large number of transitions satisfying the selection rule 1, where and are the values of the angular momentum quantum number for the initial and final state, respectively. Consequently, we saved memory by organizing the calculation of the ro-vibrational eigenstates and the -values such that at a given time, only eigenvectors for states with two consecutive -values, and , are available for the computation of -values. This algorithm is implemented in the GPU GAIN-MPI program.59
The vibrational basis set is obtained in TROVE using a multi-step contraction and symmetrization procedure, starting from local primitive basis set functions, each depending on one variable only (see Refs. 42, 43, 44 and references therein). Thus, a compact representation of the vibrational basis set is obtained in a form optimized for the molecule of interest. The final vibrational basis set is represented by the eigenfunctions of the purely vibrational part of the Hamiltonian; we call these eigenfunctions the ‘ basis’.
4 Results
4.1 Basis set convergence and empirical adjustment of the vibrational band centers
The dimensions of the Hamiltonian matrix blocks to be diagonalized are important in determining the accuracy of the computed energies and wavefunctions for highly excited ro-vibrational states. Consequently it is imperative to determine empirically the smallest basis set with which the required eigenvalue accuracy (i.e., the optimum basis-set size for ‘convergence’) can be attained.
In TROVE, the size of the vibrational basis set is controlled by polyad number truncation.41, 42, 43 For CH3, the polyad number is defined as:
| (21) |
where are the principal quantum numbers associated with the primitive functions . The primitive vibrational basis functions are products of one-dimensional basis functions , and only products with are included in the primitive vibrational basis.
An even tighter level of convergence could be achieved for the vibrational term values if these were calculated with different -values and the resulting progression of term values were extrapolated to the complete vibrational basis set limit 60. However, for the purpose of generating line lists this is not considered necessary. The corrections from the extrapolation will be small compared with the term-value errors caused by the imperfection of the underlying potential energy surface. Instead, we pragmatically aim for a higher accuracy by resorting to an empirical approach: The theoretical vibrational term values are replaced by the available accurate, experimentally derived vibrational band-centre values. In this manner, we are adjusting the vibrational band centers ‘manually’; this empirical adjustment also shifts the rotational energy-level structure towards better agreement with experiment. We call this procedure the EBSC scheme as it can be regarded as an Empirical Basis Set Correction.
We adopt the EBSC scheme for the vibrational bands , , , , and , for which accurate experimental data are available, in combination with PES-2, where we have adjusted the equilibrium structure of the molecule to fit the experimentally derived pure rotational term values. The vibrational basis set was truncated at the polyad number . We incorporate experimental information in the EBSC scheme, and so we obviously depart from a purely ab initio approach. This is considered justified by the accuracy improvement that can be achieved in the computation of an extensive ro-vibrational line list.
To improve the accuracy of the predicted vibrational band-centers, a more thorough refinement of the PES would be required. However, the available accurate experimental data for the vibrationally excited states of CH3 is severely limited, and so we opted for the EBSC approach in conjunction with the -refinement. For all bands that are not EBSC-corrected, the predicted vibrational term values are determined to a significant extent by the ab initio data, and so their accuracy is limited. However, we have improved the prediction of the rotational structures, and that will facilitate the assignments of future experimental spectra for CH3.
In Table 1, the vibrational term values below 5000 cm-1 of the methyl radical, calculated variationally in the present work from PES-2, are compared with the available experimental data. The EBSC substitution was made in the TROVE calculations of the present work, in that the theoretical vibrational term values (obtained for ) were replaced by the experimental values in Table 1. This table also shows the effect of the polyad number on the vibrational energy.
| State | Ref. | Obs.a | b | c | ||||
|---|---|---|---|---|---|---|---|---|
| 61 | 1288.1 | 1279.77 | 1281.24 | |||||
| 2737.63 | 2739.64 | |||||||
| 2773.65 | 2776.86 | |||||||
| 13 | 3004.42 | 3002.71 | 3002.76 | |||||
| 4118.59 | 4120.58 | |||||||
| 4258.97 | 4260.53 | |||||||
| 4391.99 | 4397.00 | |||||||
| 4537.94 | 4538.93 | |||||||
| 5371.39 | 5364.56 | |||||||
| 5475.84 | 5480.07 | |||||||
| 5601.91 | 5607.20 | |||||||
| 62 | 1397.0 | 1385.99 | 1387.26 | |||||
| 2688.80 | 2691.61 | |||||||
| 2759.77 | 2762.05 | |||||||
| 58 | 3160.8 | 3158.88 | 3158.83 | |||||
| 4074.69 | 4075.46 | |||||||
| 4087.92 | 4091.72 | |||||||
| 13 | 606.453 | 602.43 | 602.43 | |||||
| 2010.09 | 2010.09 | |||||||
| 3372.27 | 3371.59 | |||||||
| 3569.96 | 3569.95 | |||||||
| 3596.35 | 3596.30 | |||||||
| 4768.70 | 4767.06 | |||||||
| 4823.32 | 4822.79 | |||||||
| 4981.58 | 4981.52 | |||||||
| 2000.24 | 2002.22 | |||||||
| 3388.24 | 3391.11 | |||||||
| 3426.45 | 3430.06 | |||||||
| 3736.40 | 3736.97 | |||||||
| 4726.62 | 4728.62 | |||||||
| 4835.22 | 4839.85 | |||||||
| 4980.92 | 4983.16 | |||||||
Table 2 shows a comparison of the pure rotational energies () of CH3 before and after refinement of illustrating the importance of this step.
| States | Term values | ||||
|---|---|---|---|---|---|
| Obs. | Obs.-Calc.a | Obs.-Calc.b | |||
| 1 | 1 | 0 | 14.3189 | 0.032377 | 0.004027 |
| 2 | 0 | 1 | 57.4396 | 0.112005 | -0.002023 |
| 2 | 2 | 0 | 38.1186 | 0.092340 | 0.017004 |
| 2 | 1 | 0 | 52.6112 | 0.106875 | 0.002511 |
| 3 | 3 | 0 | 71.3965 | 0.179934 | 0.038989 |
| 3 | 2 | 0 | 95.5353 | 0.203902 | 0.014649 |
| 3 | 1 | 0 | 110.0032 | 0.219365 | 0.001200 |
| 4 | 0 | 0 | 191.2473 | 0.375024 | -0.004034 |
| 4 | 4 | 0 | 114.1491 | 0.295456 | 0.070301 |
| 4 | 2 | 0 | 172.0038 | 0.353500 | 0.012772 |
| 4 | 3 | 0 | 147.9203 | 0.327970 | 0.035289 |
a Calculated using Å and (PES-1, see text).
b Calculated using Å and (PES-2, see text).
The vibrational transition moments are defined as
| (22) |
where and denote vibrational wavefunctions and is the electronically-averaged dipole moment in the molecular frame (see the section entitled ‘Dipole moment surface’ above). For calculation of vibrational transition moments we used our ab initio PES-1 and truncated the vibrational basis set at polyad number . A number of computed transition moments for the strongest lower lying bands are listed in Table 3 where they are compared with the available experimental data. The complete list of theoretical transition moments is given as Supporting Information and can be also found at \urlwww.exomol.com.
| States | /cm-1 | Calc. /D | Obs. /D | Ref. | ||
|---|---|---|---|---|---|---|
| 678.81 | 0.25684 | 0.31(6) | [40 ] | |||
| 0 | 602.43 | 0.20403 | 0.215(25) | [39, 37, 38 ] | ||
| 0 | 3158.83 | 0.03999 | 0.03(27) | [63, 64 ] | ||
| 0 | 1387.26 | 0.02931 | ||||
| 0 | 4529.74 | 0.02049 | ||||
| 0 | 4383.56 | 0.00866 | ||||
| 0 | 4396.18 | 0.00486 | ||||
| 0 | 6294.76 | 0.00462 | ||||
| 0 | 6076.68 | 0.00321 | ||||
| 0 | 2762.05 | 0.00313 | ||||
| 0 | 5864.94 | 0.00242 | ||||
| 0 | 4075.46 | 0.00186 | ||||
| 0 | 5789.16 | 0.00130 | ||||
| 0 | 5856.39 | 0.00116 | ||||
a The transitions originate in the vibrational ground state () with the exception of the hot band .
4.2 Intensity simulations
The simulation of absorption spectra at a given temperature and within a particular wavenumber interval requires knowledge of the upper and lower-state energies and the Einstein coefficients [or the line strengths ; the relationship between and is described in Ref. 55] for all transitions in the chosen wavenumber range. In practice, however, the transitions with intensities below a chosen limit are discarded. The most straightforward presentation of the spectral data is a ‘stick’ diagram with the stick heights representing the integrated absorption coefficients from Eq. (17). We report here such simulations for the CH3 absorption bands in the wavenumber interval 600–1200 cm-1 for the out-of-plane bending mode . The line strengths in Eq. (17) are computed from Eq. (16) with the spin statistical weights from Ref. 18. The simulations are based on PES-2 and the computed DMS described above. The partition-function value used was 732.734, obtained at 300 K as a summation over all variational term values () below 36871.73 cm-1. We have computed 2,058,655,166 transitions using the GPU GAIN-MPI program59 within the various limits defined above.
Figure 2 gives an overview (log-scale) of the absorption spectrum of CH3 at different temperatures produced using the line list (log-scale) by means of the ExoCross program65. Figure 3 shows four regions with the strongest, dipole-allowed bands , , and .
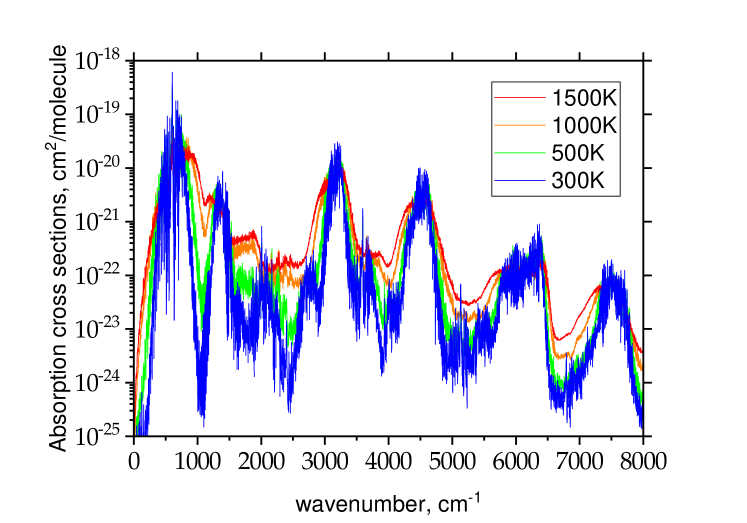

Figure 4 shows the emission spectrum of CH3 in the wavenumber interval 600-1200 cm-1, simulated with TROVE at two different levels of theory, rovibrational and purely vibrational. The simulated spectra are compared to an experimental spectrum recorded by Hermann and Leone66, 67 (see Fig. 4 of Ref. 66).

Figure 4(a) shows a simulation of the CH3 emission spectrum, computed with TROVE at a temperature of 300 K, taking into account all vibrational transitions in the 600-1200 cm-1 interval that are calculated with the basis set. The simulation involves the convolution of the calculated intensities with a Gaussian line shape function with a full width at half maximum (FWHM) of 17 cm-1.
The simulation is compared with the experimental spectrum obtained by Hermann and Leone66, 67, shown in Figure 4(b).***Reproduced from Hermann, H. W.; Leone, S. R. The Journal of Chemical Physics 1982, 76, 4759–4765, with the permission of AIP Publishing. In the experiment, the CH3 radicals were produced in a photo-fragmentation process of methyl iodide CH3I. Hermann and Leone66, 67 suggested that after the breaking of the C–I bond, the CH3 radicals are predominantly produced in excited states of the out-of-plane bending mode . The CH3 fragment of a dissociated CH3I molecule will typically have a pyramidal structure close to that of the methyl group in CH3I. For a CH3 radical, however, which is planar at equilibrium, such structures are associated with high excitations of the vibrational mode. Excitations with 10 have been observed in the emission experiment of Refs. 66, 67.
In order to simulate vibrationally very hot transitions (hotter than 1500 K) corresponding to the experimental spectrum of Refs. 66 which involves out-of-plane bending states with 10, we have carried out simulations employing a so-called one-band model (with the one band being the fundamental band here). In the one-band model, we use the -band data from the ‘parent’, 300 K ro-vibrational line list also for the hot bands accompanying the band. The procedure employed is detailed in Ref. 33 and we outline it briefly here: We initially produce the 300 K, -band cross sections by means of the ExoCross program65 and convolve them with a Gaussian profile of FWHM 17 cm-1 between 0 and 1200 cm-1, generating 1201 data points. Then the wavenumbers of the computed cross sections are shifted by 606.4531 cm-1, positioning the band center at zero, and the cross sections are normalized. A local version of ExoCross now obtains, from the vibrational transition moments computed with TROVE, the vibrational band intensities for the hot bands , 9. Finally, the simulated spectrum is generated by placing, for each hot band, the -band profile at the band center of the hot band in question, scaled by its vibrational band intensity. Such simulations have been carried out for temperatures of 1000, 2000, and 3000 K, respectively, and the results are shown in Figure 4(c), where they can be compared to the experimental results66, 67 in Figure 4(b).
Figure 4 shows that the ‘standard’ 300 K rovibrational simulation of the CH3 emission spectrum [Figure 4(a)] has little resemblance to the experimental spectrum from Ref. 66 [Figure 4(b)]. Obviously in the experiment, the CH3 molecules populate states of much higher energies than those accessed in thermal equilibrium at 300 K. However, among the ‘vibrational simulations’ in Figure 4(c), the curve obtained for 2000 K has a very substantial similarity to the experimental curve. This confirms the suggestion by Hermann and Leone66, 67 that dissociation of CH3I produces CH3 radicals in highly excited states of the out-of-plane bending mode . The successful simulation of the emission spectrum of Refs. 66, 67 lends credibility to the ab initio DMS of the present work; the intensities based on this DMS are in very good qualitative agreement with experiment.
Our complete K CH3 line list is accessed via the repository \urlwww.zenodo.org, see Ref. 68. It provides transition energies, line strengths, Einstein coefficients and the temperature dependent partition function . We expect the line list to be applicable for temperatures below 1500 K. However, the simulated spectra will become increasingly inaccurate with increasing temperature. The line list is given in the ExoMol format20 which can be used together with the ExoCross program65 to generate spectra of CH3.
5 Conclusion
We report here simulations of spectra for the methyl radical, extending over a significant portion of the infrared spectral region. The positions and intensities calculated for the transitions are in excellent agreement with experiment, as demonstrated by detailed comparisons with observed room-temperature spectra.
The CH3 line list of the present work will facilitate detections of the methyl radical in space. In the present work we have generated, refined, and validated the potential energy and dipole moment surfaces required for the spectral simulations, and we have established the level of accuracy attainable in variational nuclear-motion calculations with our computational resources. We have produced a methyl radical line list consisting of 2 billion transitions between 9,127,123 energy levels for ro-vibrational states up to = 40 and energies up to 19 000 cm-1.
A.Y. acknowledges support from DESY (HGF IVF) and from the Cluster of Excellence ’The Hamburg Centre for Ultrafast Imaging’ of the Deutsche Forschungsgemeinschaft (DFG) - EXC 1074 - project ID 194651731. S.Y. is grateful for support from the UK Science and Technology Research Council (STFC) ST/R000476/1. This work made extensive use of UCL’s Legion high performance (HPC) computing facilities as well as of HPC provided by DiRAC supported by STFC and BIS. It was further supported in part by grant JE 144/25-1 from the DFG.
The Supporting Information for this work includes: (i) dipole moment parameters , (ii) potential energy parameters ; (iii) Fortran routines for calculating the dipole moment and potential energy values for a given geometry. Our complete K CH3 line list together with the partition function can be accessed via the Zenodo repository, \urlwww.zenodo.org 68 as well as at \urlwww.exomol.com.
FIGURE CAPTIONS
-
Figure 1
Root-mean-square (RMS) errors of the fittings to the ab initio dipole moment values. The results of a series of fittings are shown. In each fitting, the data set includes the ab initio points with electronic energy (relative to the potential energy minimum) (see text).
-
Figure 2
An overview of the absorption spectrum (cross sections) of CH3 at different temperatures 300, 500, 1000 and 1500 K generated using our line list and the Gaussian line profile with the full-width-at-half-maximum of 1 cm-1.
-
Figure 3
A selection of the strongest absorption bands of CH3 at K generated using the line list. A Gaussian line profile with the half-width-half-maximum of 0.08 cm-1 was used in production of the cross sections shown.
-
Figure 4
Emission spectra of CH3. (a) Rovibrational simulation assuming the CH3 radicals to be in thermal equilibrium at 300 K. (b) CH3 () out-of-plane bending mode emission spectrum (dots) obtained66 after dissociation of CH3I CH3() + I∗. The continuous curve is the best fit66 involving the hot bands with 9. The spectrum is convolved with a spectrometer slit function with a FWHM of 33 cm-1 and a 19 cm-1 bandwidth ascribed to the breadth of the 0 manifold of transitions with varying values. Reproduced from Fig. 4 of Ref. 66 with the permission of AIP Publishing. (c) Vibrational simulations at temperatures 1000, 2000, and 3000 K, respectively, taking into account the vibrational transitions with 9 (see text).
References
- Miller et al. 1990 Miller, J. A.; Kee, R. J.; Westbrook, C. K. Chemical Kinetics and Combustion Modeling. Annu. Rev. Phys. Chem. 1990, 41, 345–387
- Ravishankara 1988 Ravishankara, R. Kinetics of Radical Reactions in the Atmospheric Oxidation of CH4. Annu. Rev. Phys. Chem. 1988, 39, 367–394
- Jasinski et al. 1987 Jasinski, J. M.; Meyerson, B. S.; Scott, B. A. Mechanistic Studies of Chemical Vapor Deposition. Annu. Rev. Phys. Chem. 1987, 38, 109–140
- Celii and Butler 1991 Celii, F. G.; Butler, J. E. Diamond Chemical Vapor Deposition. Annu. Rev. Phys. Chem. 1991, 42, 643–684
- Dmitriev and Dmitriev 2002 Dmitriev, R. A. Z.; Dmitriev, Y. A. Detection of Free Radicals in Low-Temperature Gas-Grain Reactions of Astrophysical Interest. Astron. Astrophys. 2002, 386, 1129–1138
- Feuchtgruber et al. 1998 Feuchtgruber, H.; Moses, J. I.; Encrenaz, T. Detection of Methyl Radicals CH3 on Saturn. Astron. Astrophys. 1998, 44, L41–L44
- Bézard et al. 1999 Bézard, B.; Romani, P. N.; Feuchtgruber, H.; Encrenaz, T. Detection of the Methyl Radical on Neptune. Astrophys. J. 1999, 515, 868–872
- Feuchtgruber et al. 2000 Feuchtgruber, H.; Helmich, F.; van Dishoeck, E. F.; Wright, C. M. Detection of Interstellar CH3. Astrophys. J. 2000, 535, L111–L114
- Settersten et al. 2003 Settersten, T. B.; Farrow, R. L.; Gray, J. A. Coherent Infrared-Ultraviolet Double-Resonance Spectroscopy of CH3. Chem. Phys. Lett. 2003, 370, 204–210
- Lefohn and Pimentel 1972 Lefohn, A. S.; Pimentel, G. C. Infrared Spectrum of Gaseous Methyl Radical by Rapid Scan Spectroscopy. J. Chem. Phys. 1972, 57, 4028–4037
- Holt et al. 1984 Holt, P. L.; McCurdy, K. E.; Weisman, R. B.; Adams, J. S.; Engel, P. S. Transient CARS Spectroscopy of the Band of Methyl Radical. J. Chem. Phys. 1984, 81, 3349–3350
- Kelly and Westre 1988 Kelly, P. B.; Westre, S. G. Resonance Raman Spectroscopy of the Methyl Radical. Chem. Phys. Lett. 1988, 151, 253–257
- Triggs et al. 1992 Triggs, N. E.; Zahedi, M.; Nibler, J. W.; DeBarber, P.; Valentini, J. J. High Resolution Study of the Vibration of CH3 by Coherent Raman Photofragment Spectroscopy. J. Chem. Phys. 1992, 96, 1822–1831
- Zahedi et al. 1994 Zahedi, M.; Harrison, J. A.; Nibler, J. W. 266 nm CH3I Photodissociation: CH3 Spectra and Population Distributions by Coherent Raman Spectroscopy. J. Chem. Phys. 1994, 100, 4043–4055
- Hädrich et al. 1996 Hädrich, S.; Hefter, S.; Pfelzer, B.; Doerk, T.; Jauernik, P.; Uhlenbusch, J. Determination of the Absolute Raman Cross Section of Methyl. Chem. Phys. Lett. 1996, 256, 83–86
- Westre and Kelly 1989 Westre, S. G.; Kelly, P. B. Examination of CD3 Vibrational Structure by Resonance Raman Spectroscopy. J. Chem. Phys. 1989, 90, 6977–6979
- Miller et al. 1989 Miller, J. T.; Burton, K. A.; Weisman, R. B.; Wu, W. X.; Engel, P. S. CARS Spectroscopy of Gas Phase CD3. Chem. Phys. Lett. 1989, 158, 179–183
- Adam et al. 2015 Adam, A. Y.; Yachmenev, A.; Yurchenko, S. N.; Jensen, P. Ro-Vibrational Averaging of the Isotropic Hyperfine Coupling Constant for the Methyl Radical. J. Chem. Phys. 2015, 143, 244306/1–7
- Tennyson and Yurchenko 2012 Tennyson, J.; Yurchenko, S. N. ExoMol: Molecular Line Lists for Exoplanet and Other Atmospheres. Mon. Not. R. Astron. Soc. 2012, 425, 21–33
- Tennyson et al. 2016 Tennyson, J.; Yurchenko, S. N.; Al-Refaie, A. F.; Barton, E. J.; Chubb, K. L.; Coles, P. A.; Diamantopoulou, S.; Gorman, M. N.; Hill, C.; Lam, A. Z. et al. The ExoMol Database: Molecular Line Lists for Exoplanet and Other Hot Atmospheres. J. Mol. Spectrosc. 2016, 327, 73–94
- Yurchenko and Tennyson 2014 Yurchenko, S. N.; Tennyson, J. ExoMol Line Lists IV: The Rotation-Vibration Spectrum of Methane Up to 1500 K. Mon. Not. R. Astron. Soc. 2014, 440, 1649–1661
- Yurchenko et al. 2009 Yurchenko, S. N.; Barber, R. J.; Yachmenev, A.; Thiel, W.; Jensen, P.; Tennyson, J. A Variationally Computed =300 K Line List for NH3. J. Phys. Chem. A 2009, 113, 11845–11855
- Sousa-Silva et al. 2014 Sousa-Silva, C.; Hesketh, N.; Yurchenko, S. N.; Hill, C.; Tennyson, J. High Temperature Partition Functions and Thermodynamic Data for Ammonia and Phosphine. Journal of Quantitative Spectroscopy & Radiative Transfer 2014, 142, 66–74
- Sousa-Silva et al. 2015 Sousa-Silva, C.; Al-Refaie, A. F.; Tennyson, J.; Yurchenko, S. N. ExoMol Line Lists - VII. The Rotation-Vibration Spectrum of Phosphine Up to 1500 K. Mon. Not. R. Astron. Soc. 2015, 446, 2337–2347
- Underwood et al. 2014 Underwood, D. S.; Yurchenko, S. N.; Tennyson, J.; Jensen, P. Rotational Spectrum of SO3 and Theoretical Evidence for the Formation of Rotational Energy Level Clusters in its Vibrational Ground State. J. Chem. Phys. 2014, 140, 244316/1–10
- Underwood et al. 2016 Underwood, D. S.; Tennyson, J.; Yurchenko, S. N.; Clausen, S.; Fateev, A. ExoMol Line Lists XVII: A Line List for Hot SO3. Mon. Not. R. Astron. Soc. 2016, 462, 4300–4313
- Al-Refaie et al. 2015 Al-Refaie, A. F.; Yurchenko, S. N.; Yachmenev, A.; Tennyson, J. ExoMol Line Lists - VIII: A Variationally Computed Line List for Hot Formaldehyde. Mon. Not. R. Astron. Soc. 2015, 448, 1704–1714
- Owens et al. 2015 Owens, A.; Yurchenko, S. N.; Yachmenev, A.; Tennyson, J.; Thiel, W. Accurate ab initio Vibrational Energies of Methyl Chloride. J. Chem. Phys. 2015, 142, 244306/1–10
- Owens et al. 2017 Owens, A.; Yurchenko, S. N.; Yachmenev, A.; Thiel, W.; Tennyson, J. ExoMol Molecular Line Lists XXII. The Rotation-Vibration Spectrum of Silane Up to 1200 K. Mon. Not. R. Astron. Soc. 2017, 471, 5025–5032
- Al-Refaie et al. 2015 Al-Refaie, A. F.; Ovsyannikov, R. I.; Polyansky, O. L.; Yurchenko, S. N.; Tennyson, J. A Variationally Calculated Room Temperature Line-List for H2O2. J. Mol. Spectrosc. 2015, 318, 84–90
- Al-Refaie et al. 2016 Al-Refaie, A. F.; Polyansky, O. L.; Ovsyannikov, R. I.; Tennyson, J.; Yurchenko, S. N. ExoMol Line Lists XV: A Hot Line List for Hydrogen Peroxide. Mon. Not. R. Astron. Soc. 2016, 461, 1012–1022
- Chubb et al. 2018 Chubb, K. L.; Yachmenev, A.; Tennyson, J.; Yurchenko, S. N. Treating Linear Molecule HCCH in Calculations of Rotation-Vibration Spectra. J. Chem. Phys. 2018, 149, 014101/1–17
- Mant et al. 2018 Mant, B. P.; Yachmenev, A.; Tennyson, J.; Yurchenko, S. N. ExoMol Molecular Line Lists - XXVII: Spectra of C2H4. Mon. Not. R. Astron. Soc. 2018, 478, 3220–3232
- Gordon et al. 2017 Gordon, I.; Rothman, L.; Hill, C.; Kochanov, R.; Tan, Y.; Bernath, P.; Birk, M.; Boudon, V.; Campargue, A.; Chance, K. et al. The HITRAN2016 Molecular Spectroscopic Database. Journal of Quantitative Spectroscopy & Radiative Transfer 2017, 203, 3 – 69, HITRAN2016 Special Issue
- Bunker and Jensen 1998 Bunker, P. R.; Jensen, P. Molecular Symmetry and Spectroscopy, 2nd ed.; NRC Research Press: Ottawa, 1998; p 748
- Hudgens et al. 1983 Hudgens, J. W.; DiGiuseppe, T. G.; Lin, M. C. Two Photon Resonance Enhanced Multiphoton Ionization Spectroscopy and State Assignments of the Methyl Radical. J. Chem. Phys. 1983, 79, 571–582
- Yamada and Hirota 1983 Yamada, C.; Hirota, E. The Transition Dipole Moment of the Band of the Methyl Radical. J. Chem. Phys. 1983, 78, 669–671
- Wormhoudt and McCurdy 1989 Wormhoudt, J.; McCurdy, K. E. A Measurement of the Strength of the Band of CH3. Chem. Phys. Lett. 1989, 156, 47–50
- Stancu et al. 2005 Stancu, G. D.; Röpcke, J.; Davies, P. B. Line Strengths and Transition Dipole Moment of the Fundamental Band of the Methyl Radical. J. Chem. Phys. 2005, 122, 014306/1–11
- Stancu et al. 2008 Stancu, G. D.; Röpcke, J.; Davies, P. B. Measurement of the Transition Dipole Moment of the First Hot Band of the Mode of the Methyl Radical by Diode Laser Spectroscopy. J. Phys. Chem. A 2008, 112, 6285–6288
- Yurchenko et al. 2005 Yurchenko, S. N.; Carvajal, M.; Jensen, P.; Lin, H.; Zheng, J.; Thiel, W. Rotation-Vibration Motion of Pyramidal XY3 Molecules Described in the Eckart Frame: Theory and Application to NH3. Mol. Phys. 2005, 103, 359–378
- Yurchenko et al. 2007 Yurchenko, S. N.; Thiel, W.; Jensen, P. Theoretical ROVibrational Energies (TROVE): A Robust Numerical Approach to the Calculation of Rovibrational Energies for Polyatomic Molecules. J. Mol. Spectrosc. 2007, 245, 126–140
- Yachmenev and Yurchenko 2015 Yachmenev, A.; Yurchenko, S. N. Automatic Differentiation Method for Numerical Construction of the Rotational-Vibrational Hamiltonian as a Power Series in the Curvilinear Internal Coordinates Using the Eckart Frame. J. Chem. Phys. 2015, 143, 014105/1–16
- Yurchenko et al. 2017 Yurchenko, S. N.; Yachmenev, A.; Ovsyannikov, R. I. Symmetry-Adapted Ro-vibrational Basis Functions for Variational Nuclear Motion Calculations: TROVE Approach. J. Chem. Theory Comput. 2017, 13, 4368–4381
- Adler et al. 2007 Adler, T. B.; Knizia, G.; Werner, H.-J. A Simple and Efficient CCSD(T)-F12 Approximation. J. Chem. Phys. 2007, 127, 221106/1–4
- Adler and Werner 2009 Adler, T. B.; Werner, H.-J. Local Explicitly Correlated Coupled-Cluster Methods: Efficient Removal of the Basis Set Incompleteness and Domain Errors. J. Chem. Phys. 2009, 130, 241101/1–5
- Peterson et al. 2008 Peterson, K. A.; Adler, T. B.; Werner, H.-J. Systematically Convergent Basis Sets for Explicitly Correlated Wavefunctions: The Atoms H, He, B-Ne, and Al-Ar. J. Chem. Phys. 2008, 128, 084102/1–12
- Yachmenev et al. 2011 Yachmenev, A.; Yurchenko, S. N.; Ribeyre, T.; Thiel, W. High-Level ab initio Potential Energy Surfaces and Vibrational Energies of H2CS. J. Chem. Phys. 2011, 135, 074302
- Lin et al. 2002 Lin, H.; Thiel, W.; Yurchenko, S. N.; Carvajal, M.; Jensen, P. Vibrational Energies for NH3 Based on High Level ab initio Potential Energy Surfaces. J. Chem. Phys. 2002, 117, 11265–11276
- Werner et al. 2012 Werner, H. J.; Knowles, P. J.; Knizia, G.; Manby, F. R.; Schütz, M. Molpro: A General-Purpose Quantum Chemistry Program Package. Wiley Interdisciplinary Reviews: Computational Molecular Science 2012, 2, 242–253
- Watts et al. 1993 Watts, J. D.; Gauss, J.; Bartlett, R. J. Coupled-Cluster Methods with Noniterative Triple Excitations for Restricted Open-Shell Hartree–Fock and Other General Single Determinant Reference Functions. Energies and Analytical radients. J. Chem. Phys. 1993, 98, 8718–8733
- Dunning 1989 Dunning, T. H. Gaussian Basis Sets for Use in Correlated Molecular Calculations. I. The Atoms Boron through Neon and Hydrogen. J. Chem. Phys. 1989, 90, 1007–1023
- Kendall et al. 1992 Kendall, R. A.; Dunning, Jr., T. H.; Harrison, R. J. Electron Affinities of the First-Row Atoms Revisited. Systematic Basis Sets and Wave Functions. J. Chem. Phys. 1992, 96, 6796–6806
- 54 Yurchenko, S. N.; Carvajal, M.; Lin, H.; Zheng, J.; Thiel, W.; Jensen, P. Dipole Moment and Rovibrational Intensities in the Electronic Ground state of NH3: Bridging the Gap Between ab initio Theory and Spectroscopic Experiment. J. Chem. Phys. 122, 104317/1–14
- Yurchenko et al. 2005 Yurchenko, S. N.; Thiel, W.; Carvajal, M.; Lin, H.; Jensen, P. Rotation-Vibration Motion of Pyramidal XY3 Molecules Described in the Eckart Frame: The Calculation of Intensities with Application to NH3. Adv. Quantum Chem. 2005, 48, 209–238
- Bunker and Jensen 2004 Bunker, P. R.; Jensen, P. The Fundamentals of Molecular Symmetry, 1st ed.; CRC Press: Boca Raton, 2004; p 358
- Špirko and Bunker 1982 Špirko, V.; Bunker, P. R. The Potential Function and Rotation-Vibration Energy Levels of the Methyl Radical CH3. J. Mol. Spectrosc. 1982, 95, 381–390
- Davis et al. 1997 Davis, S.; Anderson, D. T.; Duxbury, G.; Nesbitt, D. J. Jet-Cooled Molecular Radicals in Slit Supersonic Discharges: Sub-Doppler Infrared Studies of Methyl Radical. J. Chem. Phys. 1997, 107, 5661–5675
- Al-Refaie et al. 2017 Al-Refaie, A. F.; Yurchenko, S. N.; Tennyson, J. GPU Accelerated Intensities MPI GAIN-MPI: A New Method of Computing Einstein- Coefficients. Comput. Phys. Commun. 2017, 214, 216–224
- Ovsyannikov et al. 2008 Ovsyannikov, R. I.; Thiel, W.; Yurchenko, S. N.; Carvajal, M.; Jensen, P. Vibrational Energies of PH3 Calculated Variationally at the Complete Basis Set Limit. J. Chem. Phys. 2008, 129, 044309/1–8
- Yamada et al. 1981 Yamada, C.; Hirota, E.; Kawaguchi, K. Diode Laser Study of the Band of the Methyl Radical. J. Chem. Phys. 1981, 75, 5256–5264
- Jacox 2005 Jacox, M. E. Vibrational and Electronic Energy Levels of Polyatomic Transient Molecules. Supplement B; American Chemical Society: New York, 2005; Vol. 1
- Bethardy and Macdonald 1995 Bethardy, G. A.; Macdonald, R. G. Direct Measurement of the Transition Dipole Moment of the Asymmetric C-H Stretching Vibration of the CH3 Radical. J. Chem. Phys. 1995, 103, 2863–2872
- Tanarro et al. 1994 Tanarro, I.; Sanz, M. M.; Domingo, C.; Bermejo, D.; Santos, J.; Domenech, J. L. Transition Dipole Moment of the Band of CH3. J. Phys. Chem. 1994, 98, 5862–5866
- Yurchenko et al. 2018 Yurchenko, S. N.; Al-Refaie, A. F.; Tennyson, J. ExoCross: A General Program for Generating Spectra from Molecular Line Lists. Astron. Astrophys. 2018, 614, A131/1–12
- Hermann and Leone 1982 Hermann, H. W.; Leone, S. R. Photofragment Infrared Emission Spectroscopy: Vibrational Progression and Potential Parameters of the CH3() Umbrella” Mode. J. Chem. Phys. 1982, 76, 4759–4765
- Hermann and Leone 1982 Hermann, H. W.; Leone, S. R. Photofragmentation Dynamics of CH3I at 248 and 266 nm: Vibrational Distributions in the CH3() Umbrella” Mode. J. Chem. Phys. 1982, 76, 4766–4774
- Adam et al. 2019 Adam, A. Y.; Yachmenev, A.; Yurchenko, S. N.; Jensen, P. Supplementary Material: A Variationally Computed IR Line List for the Methyl Radical CH3. 2019; Zenodo. https://doi.org/10.5281/zenodo.2607732
TOC graphics
![[Uncaptioned image]](/html/1905.05504/assets/x5.png)