Superconductivity in Li-intercalated 1T-SnSe2 driven by electric-field gating
Abstract
Creating carrier reservoirs in layered compounds can effectively tune the carrier density, which often induces a variety of emergent properties. Based on solid-ion-conductor gating technique, we successfully induce superconductivity of 4.8 K in ultrathin Li-intercalated SnSe2 samples. The Li+ ions are driven in between interspacing of SnSe2 layers and form a single reservoir layer to provide electrons. In addition, a dome-like Tc is found through substituting of S for Se, where the optimal Tc is 6.2 K for SnSe1.8S0.2. Density functional theory calculations confirm that the intercalated LiSnSe2 is thermodynamically favorable, where the intercalation of Li expands the interlayer spacing by 10% and increases the carrier density by two orders of magnitude. Meanwhile the calculated results reveal that the enhanced electron-phonon interaction due to softened phonon determines the occurrence of superconductivity. Our results demonstrate that this strategy is very effective to explore superconductors in layered materials with narrow bandgap.
pacs:
Valid PACS appear hereI I. Introduction
Carrier tuning is essential for inducing many emergent properties such as superconductivity (SC)Imada et al. (1998), stripe phaseTranquada et al. (1995), pseudogapDing et al. (1996), charge density waveMcMillan (1976) and nematic phaseYu and Saupe (1980) in cuprate and iron-based superconductors. The ways of hole doping (Ba2+ for La3+) and electron doping (F- for O2-) in La2O2 layer successfully induce SC at 38 K and 26 K in La2CuO4 and LaFeAsO, respectivelyANDERSON (1987); Kamihara et al. (2008). Other route like exertion of chemical or physical pressure plays a similar role as chemical doping does, as manifested by induced SC in AeFe2As2 (Ae=Ca, Sr, Ba)Colombier et al. (2009); Lv et al. (2011); Gooch et al. (2008); Katase et al. (2012). The emergence of SC upon such tuning routes is related to change the curvature of energy band and geometry of Fermi surface.
For those compounds without carrier-supplying layer, creating a spacer layer in a Van der Waals gap is an effective strategy for inducing SC. For example, inserting a spacer layer of K+ and Tl+/Rb+/Cs+ in between FeSe layers can form AxFe2-ySe2 phase (A=K, Tl, Rb, Cs) and enhance the superconducting critical temperature (Tc) in bulky FeSe from 8 K to 31 KGuo et al. (2010); Fang et al. (2011); Wang et al. (2011); Krzton-Maziopa et al. (2011). It is worthy to note that the intercalation of Nax(NH3)y or [Li0.8Fe0.2OH]+σ layer into FeSe layer further increases Tc to 41-45 K, although it is not stable at elevated temperaturesYing et al. (2012); Sun et al. (2012). Hence, low-temperature synthesis routes like hydrothermal and solvothermal methods are conducive to obtain those superconductorsJin et al. (2017); Sun et al. (2018). Recently, a novel intercalated method through electric-field gating has been used to induce the highest Tc (48 K) in FeSe-based superconductors at ambient pressure Lei et al. (2016, 2017); Ying et al. (2018). The back-gate applied on solid-ion-conductor of Li2Al2SiP2TiO13 can drive the cation (Li+) into FeSe precursor, and thus enhance carrier concentration and Tc. It provides a relatively clean process of carrier tuning without drastically altering the crystal structure of parent compound. One thing should be noted is that this method differs from that of ionic-liquid gating, where no ions migrate into the precursor and thus the SC is confined within surface layers (thickness of 1 nm)Ueno et al. (2008); Ye et al. (2009).
SnSe2 is an intrinsic semiconductor with a bandgap of 1.0 eV at room temperatureBhatt et al. (1989). Intercalation of Co(-C5H5)2 molecule between SnSe2 layers can induce SC at Tc=5 KO’Hare et al. (1992); Li et al. (2017). Besides, two-dimensional SC has been found in the interface of SnSe2/ionic-liquid and SnSe2/grapheneZeng et al. (2018); Zhang et al. (2018). Here, we choose ultrathin 1T-phase SnSe2 with thickness 13 nm as a host to testify the carrier-tuning effect on transport properties through electric-field gating. We find that a transition from semiconductor to superconductor for SnSe2 due to Li-intercalation driven by electric-field. The highest Tc, 6.2 K, occurs as combining Li-intercalation and partial chemical substitution of S for Se. Theoretical calculations support that the Li ions might occupy interlayer position to form a carrier reservoir. Within the framework of Bardeen-Cooper-Schrieffer (BCS) theory, our calculations show that electron-phonon coupling (EPC) constant () is 0.97 and the phonon-mediated mechanism is responsible for SC.
II II. EXPERIMENTAL
II.1 A. Experimental details
Single crystal of SnSe2 was grown by chemical vapor transport method in a two-zone furnace (T1=1000 K and T2=800 K) with iodine as transport agent. Selected area electron diffraction (SAED) was carried out on a transmission electron microscopy (JEM-2100 Plus). Standard mechanical-exfoliation methods with Scotch tapes are used to obtain thin flakes of SnSe2. A step-by-step process is illustrated in Fig. 1. We exfoliated thin flakes of SnSe2 from bulk crystal by Scotch tapes. The thickness of flake was characterized by atomic force microscope (AFM) (Bruker Multimode 8). Typical samples of 10 30 nm were transferred on solid-ion conductor by a piece of polydimethylsiloxane (PDMS). Au film of 50 nm was pre-deposited on the opposite surface of solid-ion conductor through electron beam evaporation. The conductor was placed on a Au-coated SiO2/Si substrate. We then deposited Ti/Au or Cr/Ag (5/50 nm) metal electrodes with standard four-terminal and Hall-terminal patterns on SnSe2 surface. The whole device was then quickly loaded into a refrigerator to avoid absorption of water or oxygen from the air. It is known that Li-ion conductivity of solid-ion-conductor Li2Al2SiP2TiO13 (HF-Kejing) is 10-4 S cm-1 as T160 K. Thus, we slowly increased T to 160 K in case of overcharging. A lock-in amplifier (Stanford Research 830) was used to measure the transport properties. The gate voltage, VG=4.5 V, was supplied by a Keithley-2400 source meter. The resistance of SnSe2 started to drop upon applying electric-field, meaning that Li ions of Li2Al2SiP2TiO13 are driven into SnSe2, see Fig. S1. Meanwhile, the intercalation of Li ions is also confirmed by the IDS-VG curve as shown in Fig. S2, where the positive voltage can effectively reduce resistance and increase IDS.
II.2 B. Computational details
Our calculations were based on density functional theory (DFT) by using plane-wave pseudopotential method as implemented in the Vienna Ab initio Simulation PackageKresse and Furthmüller (1996). The electron–ion interactions were described by the projector-augmented wave potentials with 5s25p2, 4s24p4 and 2s1 configurations treated as valence electrons for Sn, Se and Li, respectively. The exchange-correlation function was described using Perdew-Burke-ErnzerhofKresse and Joubert (1999) of generalized gradient approximation. A kinetic cutoff energy of 600 eV and corresponding Monkhorst-Pack (MP)Monkhorst and Pack (1976) k-point meshes for different structures were adopted to ensure that the enthalpy converges to 1 meV/atom. The of LiSnSe2 was calculated within the framework of linear response theory through the Quantum-ESPRESSO codeGiannozzi et al. (2009) , where ultrasoft pseudopotentials for Sn, Se and Li with a kinetic energy cutoff of 70 Ry were employed. We adopted a 995 q-point mesh and 363620 MP k-point mesh in the first Brillouin zone (BZ) for the EPC calculations.

III III. RESULTS AND DISCUSSION
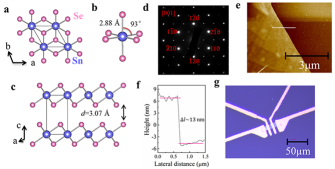
SnSe2 only has a 1T-type crystal structure with a=3.807 Å and c= 6.128 Å (space group: Pm1), differing from the polymorphism of most transition metal dichalcogenides. Figure 2 (a-c) show crystal structures of SnSe2 and slightly-distorted SnSe6 octahedron. Each Sn is surrounded by six Se with a Sn-Se bondlength of 2.88 Å and a Se-Sn-Se angle of . The interlayer spacing is as large as 3.07 Å, implying that the interaction is weak Van de Waals force. In Fig. 2(d), the SAED along [001] zone axis confirms that the as-grown single crystal has high crystallinity. From the AFM image, we can find that the exfoliated SnSe2 is 13 nm thick, i. e. 20 unit cell, as shown in Fig. 2(e) and (f). The optical image of sample and four electrodes are shown in Fig. 2(g), and the transverse size of sample is 50 m.
The temperature-dependent sheet electrical resistance (Rs) of SnSe2 is plotted in Fig. 3(a). The curve shows overall semiconducting character. The data in intermediate temperature range can be fitted by equation, R(T)=R(0)exp[Eg/kBT], where Eg is thermal-active gap, kB the Boltzmann constant. Fitting the curve yields an Eg = 5 meV, which is much smaller than the bandgap of bulk SnSe2 ( 1.0 eV). The Hall coefficient (RH) and carrier concentration (n) of SnSe2 were calculated from magnetic-field-dependent Hall resistance (Rxy). Based on the linear relationship between Rxy and magnetic field (B) up to 7 T, see Fig. 3(b), we can fit the slop and obtain the RH=Rxy/B. The RH is negative in the measured temperature range. Temperature-dependent RH and n are plotted in Fig. 3(c). The RH gradually decreases from -3 m2/C to -10 m2/C with decreasing temperature. Thus, the n, calculated from single-band model n=1/eRH, decreases from 2.21014 cm-2 to 61013 cm-2 from 300 K to 80 K. This value is consistent with relatively high carrier concentration in few-layer SnSe2Ito et al. (2016), while it is higher than 1012 -1013 cm-2 of few-layer MoS2 and MoSe2Ye et al. (2012); Shi et al. (2015).
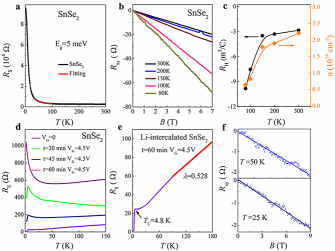
To verify the effect of electric-field gating on SC, we measure the transport properties of SnSe2 down to 2 K under a positive VG = 4.5 eV. Fig. 3(d) and (e) are the variation of the Rs against temperature. We found that the SnSe2 changes into metal as increasing gating-time (t), meaning that Li+ driven by electric-field enters into SnSe2 so that Li-intercalation increases the carrier concentration. Meanwhile, a slight drop of resistance shows up at 4.8 K, and this transition gradually enhance as increasing t. From Fig. 3(e), one can find that a superconducting transition occurs at T = 4.8 K and T = 3.5 K, which are comparable to those Tc in SnSe2-based superconductors. Here, we use the electron-phonon scattering model to analyze the of Li-intercalated SnSe2. In the high-temperature limit (T/ 1, where is the Debye temperature), the resistivity can be expressed asGrimvall (1981); Xi et al. (2016)
| (1) |
where is temperature-independent resistivity due to electron-impurity scattering, EPC constant, m effective mass, kB the Boltzmann constant and n0 volume carrier density. For SnSe2 sample with thickness l, the Rs and n are Rs =/l and n = n0l, respectively. Therefore,
| (2) |
where the bulk plasma frequency () for SnSe2 is 1.01105 cm-1Sengupta , the vacuum permittivity. Fitting temperature dependent Rs from 90 K to 180 K yields is 0.53. In addition, the Hall resistance Rxy of Li-intercalated SnSe2 is measured to estimate the carrier concentration. The magnetic-filed dependent Rxy at 25 K and 50 K are plotted in Fig. 3(f). We extract RH from the linear fitting of magnetic-filed-dependent Rxy and calculate the n=1/eRH. It turns out that application of gate voltage, VG = 4.5 V, increases the n as high as 2.581015 cm-2 at T = 25 K.
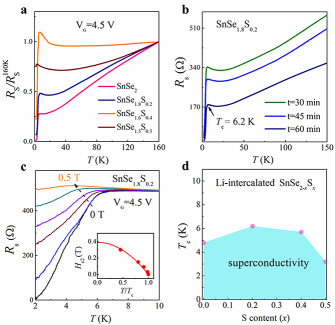
Next, we investigate the superconductivity of electric-field gated SnSe2-xSx (x=0.2, 0.4, 0.5) samples and present the data in Fig. 4. Similar superconducting transitions were also observed in SnSe2-xSx (x= 0.2, 0.4, 0.5) under the same VG = 4.5 eV, as shown in Fig. 4(a). Fig. 4(b) shows that the resistivity gradually decrease with increasing gating time, and the optimal transition can be reached as t= 60 min. The temperature-dependent Rs of SnSe1.8S0.2 under varying perpendicular magnetic fields is shown in Fig. 4(c). It can be seen that the superconducting transition gradually broadens and the Tc shifts to lower temperatures as the magnetic field increases. Meanwhile, as a criteria of 90% of the normal state resistance, we plotted the temperature dependence of the field Hc2 for Li-intercalated SnSe1.8S0.2 in the inset of Fig. 4(c). These data can be fitted by the Ginzburg-Landau equation = [1-(] and the obtained = 0.39 T. Using the equation of = , where is the magnetic flux quantum (2.07 × 10⁻¹⁵ Wb), we obtained the = 29 nm. A superconducting phase diagram of Tc versus S content is plotted in Fig. 4 (d). In the SnSe2-xSx sample (x0.5), an interesting point is that the T firstly increases to 6.2 K at x=0.2, and then it begins to decrease as x0.2. It is known that the S-substitution can induce contraction of lattice constants and Sn-Se/S bondlength, which generates the effect of chemical pressure without introducing extra electronsPan et al. (2013). As for the S-substitution effect on superconductivity, we think that it is similar with the observations in FeSe1-xSx, in which the T firstly increases and then decreases as increasing S, and the maximal T emerges at 20% S-substitution. This enhancement T should be related to the optimized Fe-Se bondlength and geometry of FeSe4 tetrahedraMatsuura et al. (2017). Another possibility is that the substitution of S for Se results in a greater orbital overlap, increasing the bandwidth and driving the system more itinerantWatson et al. (2015). In the S-rich SnSe2-xSx sample (x0.5), the Rs is too large to be measuredBurton et al. (2013). The electric-field gating is hard to metallize this sample and induce superconductivity. We notice that, in all samples, the T does not increase as increasing t. It implies that there is only one superconducting phase, which is different from multiple phases in intercalated FeSe-based superconductorsYing et al. (2018); Guo et al. (2014); Kajita et al. (2015).
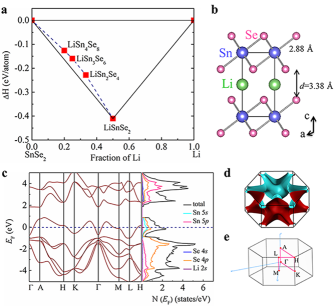
To better understand the effect of Li-intercalation on the structure and SC of SnSe2, the DFT calculations were performed. Here, four stoichiometries of Li-intercalated phases, LiSnSe2, LiSn2Se4, LiSn3Se6 and LiSn4Se8, were adopted to simulate different Li concentrations. Their crystal structures were constructed based on the Pm1 space group, where one Li atom occupies one octahedral interstice surrounding by six Se atoms (Wyckoff position of Pm1:1b) in 111, 112, 113 and 221 supercells of LiSnSe2, respectively. We first investigate the phase stability of Li-intercalated SnSe2 by calculating their formation enthalpies relative to Li and binary SnSe2, where the most stable structures for Li and SnSe2 at ambient pressure were adoptedGao et al. (2013). As shown in Fig. 5(a), all the stoichiometries have negative formation enthalpies relative to Li and SnSe2, suggesting that the intercalation of Li is thermodynamically favored. With increasing Li content, the formation enthalpies monotonously decreases and LiSnSe2 achieves the lowest one, -0.42 eV/atom, indicating that it is the most stable compound. LiSn2Se4, LiSn3Se6 and LiSn4Se8 were calculated to be less stable with respect to LiSnSe2. The obtained crystal structure of LiSnSe2 is shown in Fig. 5(b), where the a= 3.955 Å and c= 6.751 Å. The Li ions intercalate into interlayer of SnSe2 and form a carrier-supply reservoir. The interlayer spacing is expanded to 3.38 Å after Li interaction, but the Sn-Se bondlength is still 2.88 Å. The calculated electronic band structure and projected density of states (DOS) for LiSnSe2 are shown in Fig. 5(c). Comparing with the band structure of semiconducting SnSe2 in Fig. S3 and Ref.Gonzalez and Oleynik (2016), doping of one Li+ seems to upshift the Fermi level (EF) by 1 eV. One can see that a single band crosses the EF from -1 eV to 1 eV, indicative of metallic behavior, which is consistent with the experimental result. The electronic DOS at EF is 2.1 states/eV, which is dominated by Sn 5s and Se 4p orbitals with strong hybridization. The contribution of Se 4p is a little larger than that of Sn 5s. From the calculated Fermi surface of LiSnSe2, shown in Fig. 5(d) and (e), we can see that a three-dimensional-like characteristic in electronic structure appears. There is a small electron pocket at point of the first Brillouin zone.
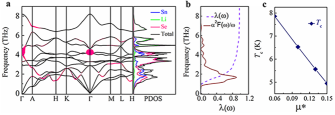
The calculated phonon spectrum for LiSnSe2 is plotted in the left panel of Fig. 6(a). There is no imaginary frequency in the full spectrum, indicating that it is dynamically stable. The corresponding projected phonon DOS (PDOS) is shown in the right panel of Fig. 6(a). It can be seen that the low frequency bands below 4 THz are dominated by Sn and Se states, while the high frequency modes above 5 THz mainly comes from Li vibrations. In comparison with the phonon spectrum and PDOS for SnSe2, see Fig. S3(b and d), the intercalation of Li drives the partial phonon modes below 4 THz move to low-frequency range and enhances the peak at 2 THz. It can induce phonon softening, which enhance the electron-phonon coupling and facilitate superconductivity. To explore the SC of LiSnSe2, the Eliashberg spectral function F() and the are calculated as shown in Fig. 6(b). The spectra function F() is calculated in terms of the phonon linewidth due to electron-phonon interaction
| (3) |
where N(EF) is the electronic DOS per atom and spin at the EF. The linewidth of a phonon mode, , can be expressed as
| (4) |
where the sum is over the first Brillouin zone, and are the energies of bands measured with respect to the EF at point k. The g is electron-phonon matrix element. The is thus defined as integration of the spectra function in the first Brillouin zone as the formula =2. Besides the modes at about 4 THz at point, the modes between 1-2 THz at H point and along K- direction soften, which would enhance the . Accordingly, it is clearly seen that a pronounced peak shows up at 1.5 THz in the F()/ curve. The calculated for LiSnSe2 is 0.97, which mainly comes from the vibrations of Sn and Se atoms below 2 THz. Therefore, the main effect of Li-intercalation is believed to not only provide carriers for SnSe2 layers but also enhance the electron-phonon coupling.
We use the Allen-Dynes formulaAllen and Dynes (1975)
| (5) | |||
| (6) |
to accurately evaluate the Tc, where is the logarithmic average frequency, is the Coulomb repulsion constant. The is calculated to be 98.2 K, which is significantly softened by 40% compared with the Debye temperature of bulk SnSe2 (1402 K)Lagnier et al. (1983). The dependence of Tc is plotted in Fig. 6(c). The calculated Tc linearly decreases from 7.8 K to 4.8 K as increasing . Taking the common value of the as 0.13, the theoretical Tc of LiSnSe2 is 5.5 K. Notably, the theoretical Tc is consistent with the experimental one, indicating that the SC of LiSnSe2 can be well described by the phonon-mediated mechanism.
Like enhancing SC of binary FeSe through external pressure, squeezing SnSe2 can optimize the structure and carrier concentration, and then induce SC. In pressurized SnSe2, the possibility of phase decomposition due to structural instability could soften the partial phonon modes, which enhances the electron-phonon couplingZhou et al. (2018). In Li-intercalated SnSe2, the newly-formed carrier layers can induce two kinds of effects. One is leading to phonon softening of SnSe2, which could enhance the electron-phonon coupling and induce the SC according to the BCS theory. The other is that creating carrier layer of Li+, which transfers electrons into SnSe2 layer and realizes intrinsically heavily-doped SnSe2O’Hare et al. (1992); Li et al. (2017). Our electric-field gating can increase carrier concentration by one or two orders of magnitude. The SnSe2 with high carrier density has been demonstrated to be superconductors with Tc= 3.9 KZeng et al. (2018) and 4.8 KZhang et al. (2018). However, we noticed that this gating method may not change the compound with large bandgap ( >2 eV) into metal, and the tuning ability is limited under the circumstances. Designing new devices, such as electric-double-layer transistor with liquid and solid ions, could further induce more superconductors from metal chalcogenides with large band gap.
IV IV. CONCLUSION
In summary, we report a semiconductor-superconductor transition of 4.8 K in Li-intercalated SnSe2 through electric-field gating. A maximal Tc of 6.2 K is obtained by optimizing the gating time and chemical substitution of S for Se. More importantly, theoretical calculations reasonably predict the intercalated crystal structure and the metallic behaviors of LiSnSe2. Besides, the partial phonon softening due to Li-intercalation strengthens the electron-phonon coupling, leading to the occurrence of SC. The combinations of experimental and theoretical results demonstrate that this method is highly effective for increasing carrier concentration and metallizing layered materials. Meanwhile, it is useful to study the intrinsic properties of superconducting layer because Li-intercalation of this method can keep the crystal structure intact to a larger extent.
V ACKNOWLEDGMENTS
This work is financially supported by the National Natural Science Foundation of China (No. 51772322, 51532010, 11604290 and 51732010), by the National Key Research and Development Program of China (No. 2016YFA0300600, 2017YFA0304700), by the Chinese Academy of Sciences under Grant QYZDJ-SSW-SLH013.
References
- Imada et al. (1998) M. Imada, A. Fujimori, and Y. Tokura, Rev. Mod. Phys. 70, 1039 (1998).
- Tranquada et al. (1995) J. M. Tranquada, B. J. Sternlieb, J. D. Axe, Y. Nakamura, and S. Uchida, Nature (London) 375, 561 (1995).
- Ding et al. (1996) H. Ding, T. Yokoya, J. C. Campuzano, T. Takahashi, M. Randeria, M. R. Norman, T. Mochiku, K. Kadowaki, and J. Giapintzakis, Nature (London) 382, 51 (1996).
- McMillan (1976) W. L. McMillan, Phys. Rev. B 14, 1496 (1976).
- Yu and Saupe (1980) L. J. Yu and A. Saupe, Phys. Rev. Lett. 45, 1000 (1980).
- ANDERSON (1987) P. W. ANDERSON, Science 235, 1196 (1987).
- Kamihara et al. (2008) Y. Kamihara, T. Watanabe, M. Hirano, and H. Hosono, J. Am. Chem. Soc. 130, 3296 (2008).
- Colombier et al. (2009) E. Colombier, S. L. Bud’ko, N. Ni, and P. C. Canfield, Phys. Rev. B 79, 224518 (2009).
- Lv et al. (2011) B. Lv, L. Deng, M. Gooch, F. Wei, Y. Sun, J. K. Meen, Y. Y. Xue, B. Lorenz, and C. W. Chu, Proc Natl Acad Sci U S A 108, 15705 (2011).
- Gooch et al. (2008) M. Gooch, B. Lv, B. Lorenz, A. M. Guloy, and C.-W. Chu, Phys. Rev. B 78, 180508 (2008).
- Katase et al. (2012) T. Katase, S. Iimura, H. Hiramatsu, T. Kamiya, and H. Hosono, Phys. Rev. B 85, 140516 (2012).
- Guo et al. (2010) J. Guo, S. Jin, G. Wang, S. Wang, K. Zhu, T. Zhou, M. He, and X. Chen, Phys. Rev. B 82, 180520 (2010).
- Fang et al. (2011) M.-H. Fang, H.-D. Wang, C.-H. Dong, Z.-J. Li, C.-M. Feng, J. Chen, and H. Q. Yuan, Europhys. Lett. 94, 27009 (2011).
- Wang et al. (2011) A. F. Wang, J. J. Ying, Y. J. Yan, R. H. Liu, X. G. Luo, Z. Y. Li, X. F. Wang, M. Zhang, G. J. Ye, P. Cheng, Z. J. Xiang, and X. H. Chen, Phys. Rev. B 83, 060512 (2011).
- Krzton-Maziopa et al. (2011) A. Krzton-Maziopa, Z. Shermadini, E. Pomjakushina, V. Pomjakushin, M. Bendele, A. Amato, R. Khasanov, H. Luetkens, and K. Conder, J. Phys. Condens. Matter 23, 052203 (2011).
- Ying et al. (2012) T. P. Ying, X. L. Chen, G. Wang, S. F. Jin, T. T. Zhou, X. F. Lai, H. Zhang, and W. Y. Wang, Sci. Rep. 2, 426 (2012).
- Sun et al. (2012) L. Sun, X.-J. Chen, J. Guo, P. Gao, Q.-Z. Huang, H. Wang, M. Fang, X. Chen, G. Chen, Q. Wu, C. Zhang, D. Gu, X. Dong, L. Wang, K. Yang, A. Li, X. Dai, H.-k. Mao, and Z. Zhao, Nature (London) 483, 67 (2012).
- Jin et al. (2017) S. Jin, X. Fan, X. Wu, R. Sun, H. Wu, Q. Huang, C. Shi, X. Xi, Z. Li, and X. Chen, Chem. Commun. 53, 9729 (2017).
- Sun et al. (2018) R. J. Sun, Y. Quan, S. F. Jin, Q. Z. Huang, H. Wu, L. Zhao, L. Gu, Z. P. Yin, and X. L. Chen, Phys. Rev. B 98, 214508 (2018).
- Lei et al. (2016) B. Lei, J. H. Cui, Z. J. Xiang, C. Shang, N. Z. Wang, G. J. Ye, X. G. Luo, T. Wu, Z. Sun, and X. H. Chen, Phys. Rev. Lett. 116, 077002 (2016).
- Lei et al. (2017) B. Lei, N. Z. Wang, C. Shang, F. B. Meng, L. K. Ma, X. G. Luo, T. Wu, Z. Sun, Y. Wang, Z. Jiang, B. H. Mao, Z. Liu, Y. J. Yu, Y. B. Zhang, and X. H. Chen, Phys. Rev. B 95, 020503 (2017).
- Ying et al. (2018) T. P. Ying, M. X. Wang, X. X. Wu, Z. Y. Zhao, Z. Z. Zhang, B. Q. Song, Y. C. Li, B. Lei, Q. Li, Y. Yu, E. J. Cheng, Z. H. An, Y. Zhang, X. Y. Jia, W. Yang, X. H. Chen, and S. Y. Li, Phys. Rev. Lett. 121, 207003 (2018).
- Ueno et al. (2008) K. Ueno, S. Nakamura, H. Shimotani, A. Ohtomo, N. Kimura, T. Nojima, H. Aoki, Y. Iwasa, and M. Kawasaki, Nat. Mater. 7, 855 (2008).
- Ye et al. (2009) J. T. Ye, S. Inoue, K. Kobayashi, Y. Kasahara, H. T. Yuan, H. Shimotani, and Y. Iwasa, Nat. Mater. 9, 125 (2009).
- Bhatt et al. (1989) V. Bhatt, K. Gireesan, and G. Pandya, J. Cryst. Growth 96, 649 (1989).
- O’Hare et al. (1992) D. O’Hare, H.-V. Wong, S. Hazell, and J. W. Hodby, Adv. Mater. 4, 658 (1992).
- Li et al. (2017) Z. Li, Y. Zhao, K. Mu, H. Shan, Y. Guo, J. Wu, Y. Su, Q. Wu, Z. Sun, A. Zhao, X. Cui, C. Wu, and Y. Xie, J. Am. Chem. Soc. 139, 16398 (2017).
- Zeng et al. (2018) J. Zeng, E. Liu, Y. Fu, Z. Chen, C. Pan, C. Wang, M. Wang, Y. Wang, K. Xu, S. Cai, X. Yan, Y. Wang, X. Liu, P. Wang, S.-J. Liang, Y. Cui, H. Y. Hwang, H. Yuan, and F. Miao, Nano Lett. 18, 1410 (2018).
- Zhang et al. (2018) Y.-M. Zhang, J.-Q. Fan, W.-L. Wang, D. Zhang, L. Wang, W. Li, K. He, C.-L. Song, X.-C. Ma, and Q.-K. Xue, Phys. Rev. B 98, 220508 (2018).
- Kresse and Furthmüller (1996) G. Kresse and J. Furthmüller, Phys. Rev. B 54, 11169 (1996).
- Kresse and Joubert (1999) G. Kresse and D. Joubert, Phys. Rev. B 59, 1758 (1999).
- Monkhorst and Pack (1976) H. J. Monkhorst and J. D. Pack, Phys. Rev. B 13, 5188 (1976).
- Giannozzi et al. (2009) P. Giannozzi, S. Baroni, N. Bonini, M. Calandra, R. Car, C. Cavazzoni, D. Ceresoli, G. L. Chiarotti, M. Cococcioni, I. Dabo, A. D. Corso, S. de Gironcoli, S. Fabris, G. Fratesi, R. Gebauer, U. Gerstmann, C. Gougoussis, A. Kokalj, M. Lazzeri, L. Martin-Samos, N. Marzari, F. Mauri, R. Mazzarello, S. Paolini, A. Pasquarello, L. Paulatto, C. Sbraccia, S. Scandolo, G. Sclauzero, A. P. Seitsonen, A. Smogunov, P. Umari, and R. M. Wentzcovitch, J. Phys. Condens. Matter 21, 395502 (2009).
- Ito et al. (2016) K. Ito, K. Nishikawa, and H. Iizuka, Appl. Phys. Lett. 108, 053507 (2016).
- Ye et al. (2012) J. T. Ye, Y. J. Zhang, R. Akashi, M. S. Bahramy, R. Arita, and Y. Iwasa, Science 338, 1193 (2012).
- Shi et al. (2015) W. Shi, J. Ye, Y. Zhang, R. Suzuki, M. Yoshida, J. Miyazaki, N. Inoue, Y. Saito, and Y. Iwasa, Sci. Rep. 5, 12534 (2015).
- Grimvall (1981) G. Grimvall, The Electron-Phonon Interaction in Metals, North-Holland Publishing Co. (1981).
- Xi et al. (2016) X. Xi, H. Berger, L. Forró, J. Shan, and K. F. Mak, Phys. Rev. Lett. 117, 106801 (2016).
- (39) A. Sengupta, arXiv:1811.09031.
- Pan et al. (2013) T. S. Pan, D. De, J. Manongdo, A. M. Guloy, V. G. Hadjiev, Y. Lin, and H. B. Peng, Appl. Phys. Lett. 103, 093108 (2013).
- Matsuura et al. (2017) K. Matsuura, Y. Mizukami, Y. Arai, Y. Sugimura, N. Maejima, A. Machida, T. Watanuki, T. Fukuda, T. Yajima, Z. Hiroi, K. Y. Yip, Y. C. Chan, Q. Niu, S. Hosoi, K. Ishida, K. Mukasa, S. Kasahara, J. G. Cheng, S. K. Goh, Y. Matsuda, Y. Uwatoko, and T. Shibauchi, Nat. Commun. 8, 1143 (2017).
- Watson et al. (2015) M. D. Watson, T. K. Kim, A. A. Haghighirad, S. F. Blake, N. R. Davies, M. Hoesch, T. Wolf, and A. I. Coldea, Phys. Rev. B 92, 121108 (2015).
- Burton et al. (2013) L. A. Burton, D. Colombara, R. D. Abellon, F. C. Grozema, L. M. Peter, T. J. Savenije, G. Dennler, and A. Walsh, Chem. Mater. 25, 4908 (2013).
- Guo et al. (2014) J. Guo, H. Lei, F. Hayashi, and H. Hosono, Nat. Commun. 5, 4756 (2014).
- Kajita et al. (2015) T. Kajita, T. Kawamata, T. Noji, T. Hatakeda, M. Kato, Y. Koike, and T. Itoh, Physica C 519, 104 (2015).
- Gao et al. (2013) G. Gao, R. Hoffmann, N. W. Ashcroft, H. Liu, A. Bergara, and Y. Ma, Phys. Rev. B 88, 184104 (2013).
- Gonzalez and Oleynik (2016) J. M. Gonzalez and I. I. Oleynik, Phys. Rev. B 94, 125443 (2016).
- Allen and Dynes (1975) P. B. Allen and R. C. Dynes, Phys. Rev. B 12, 905 (1975).
- Lagnier et al. (1983) R. Lagnier, C. Ayache, J.-Y. Harbec, S. Jandl, and J.-P. Jay-Gerin, Solid State Commun. 48, 65 (1983).
- Zhou et al. (2018) Y. Zhou, B. Zhang, X. Chen, C. Gu, C. An, Y. Zhou, K. Cai, Y. Yuan, C. Chen, H. Wu, R. Zhang, C. Park, Y. Xiong, X. Zhang, K. Wang, and Z. Yang, Adv. Electron. Mater. 4, 1800155 (2018).