AugerPrime: the Pierre Auger Observatory Upgrade
Abstract
The world largest exposure to ultra-high energy cosmic rays accumulated by the Pierre Auger Observatory led to major advances in our understanding of their properties, but the many unknowns about the nature and distribution of the sources, the primary composition and the underlying hadronic interactions prevent the emergence of a uniquely consistent picture. The new perspectives opened by the current results call for an upgrade of the Observatory, whose main aim is the collection of new information about the primary mass of the highest energy cosmic rays on a shower-by-shower basis. The evaluation of the fraction of light primaries in the region of suppression of the flux will open the window to charged particle astronomy, allowing for composition-selected anisotropy searches. In addition, the properties of multiparticle production will be studied at energies not covered by man-made accelerators and new or unexpected changes of hadronic interactions will be searched for. After a discussion of the motivations for upgrading the Pierre Auger Observatory, a description of the detector upgrade is provided. We then discuss the expected performances and the improved physics sensitivity of the upgraded detectors and present the first data collected with the already running Engineering Array.
1 Introduction
Although we still lack a comprehensive theory capable of explaining where the ultra-high energy cosmic rays (UHECRs) are produced, what is the acceleration mechanism driving nuclei to such extreme energies and their chemical composition, a large amount of information was gained in the recent years by exploiting the data taken with the Pierre Auger Observatory PAO1 .
The suppression of the cosmic ray flux for eV has been unambiguously established;
the current limits on the photon and neutrino fluxes at ultra-high energy strongly limit the possibility that
the observed flux is produced in non standard “top-down” processes unger .
A dipolar large scale anisotropy has been observed in cosmic rays with EeV,
proving that they are indeed of extragalactic origin and opening a window on the study of the properties of
extragalactic magnetic fields dipole .
Strong hints of correlation with the direction of bright, nearby starburst galaxies
have been obtained in intermediate-scale anisotropy searches, while an excess of events have been seen for eV
in the direction of the Centaurus A radio galaxy SBG .
In the standard astrophysical Scenario, the UHECRs are mainly extra-galactic protons and the observed suppression of the flux is ascribed to the energy losses suffered by the particles during propagation, after having been accelerated with a power-law injection spectrum in sources distributed as the matter in the Universe (“photo-disintegration Scenario”). However, the energy at which the integral flux measured at Auger drops by a factor of two below what would be expected without suppression, = (231(stat.)4(syst.)) EeV, is quite different from the EeV predicted for this scenario. Furthermore, this model is challenged by the results obtained on the primary composition comp1 ; comp2 ; comp3 . Indeed, the studies of the evolution with energy of the shower development in the atmosphere point to a mass composition becoming progressively heavier with increasing energy. The heaviest (iron) component appears almost unnecessary, while the protons add up to not more than 10% at the highest energies.
The best fit to the spectrum and composition as measured at the Pierre Auger Observatory is obtained for a model in which the sources accelerate particles to maximum energies proportional to their charge, with a hard injection index . The observed suppression in the flux would then be ascribed to a cutoff in the energy spectra of the sources (“maximum rigidity scenario”) scenarios .
The interpretation of the results in terms of composition is made even more difficult by the large uncertainties in predicting hadronic multiparticle production at energies beyond those accessible in the laboratory. Different studies aiming at the evaluation of the muon content in air showers muon1 ; muon2 ; muon3 , exploiting the study of hybrid events muon4 , or analysing the azimuthal asymmetry in the risetime of signals in SD muon5 , found inconsistencies in the modeling of hadronic interactions and muon production as implemented in the simulations .
An upgrade of the Pierre Auger Observatory, dubbed “AugerPrime” PrimeArch ; PrimeGen , has been planned to address the following open questions :
understand the origin of the flux suppression, by differentiating between a cut-off due to propagation effects and the maximum energy reached in the sources. This will allow us to provide fundamental constraints on the sources of the ultra high energy cosmic rays and their properties.
evaluate the possible existence of a fraction of protons at the highest energies. The answer to this fundamental question will set the stage for future experiments and assess the feasibility of charged particle astronomy.
add information about hadronic interactions in a range of energy and in a kinematic region which is not accessible in man-made accelerators. Non-standard mechanisms, such as Lorentz invariance violation or extra dimensions will also be searched for.
To reach these goals, it is essential to obtain additional measurements of composition-sensitive observables on a high statistics sample of ultra-high energy events, thus exploiting the Surface Detector of the Pierre Auger Observatory.
2 Elements of AugerPrime
The key elements of the upgrade consist of new plastic scintillator detectors on top of
the water-Cherenkov stations (WCD) of the surface array (SD), an additional small
photomultiplier (PMT) installed in the WCD for the extension of the dynamic range, and new SD electronics.
Additionally an underground muon detector is going to be deployed aside each WCD in the infill region of the
Observatory, to provide direct muon measurements.
The upgrade will also be complemented by extending the measurements of the existing Fluorescence
Detectors (FD) into periods of higher night-sky background, to increase their duty cycle.
Finally, based on the Radio Engineering Array (AERA) experience and results, a new project for adding
a radio detector to AugerPrime is now on-going.
2.1 The Scintillator Detectors
Complementing the water-Cherenkov detectors of the surface array with scintillator detectors will provide a way to
sample shower particles with detectors having very different responses to the muonic and electromagnetic
components.
Indeed, the ratio of the electromagnetic to muonic components of the showers is more than a factor of two higher in
a thin scintillator with respect to the WCD over a very wide range of distances to the core.
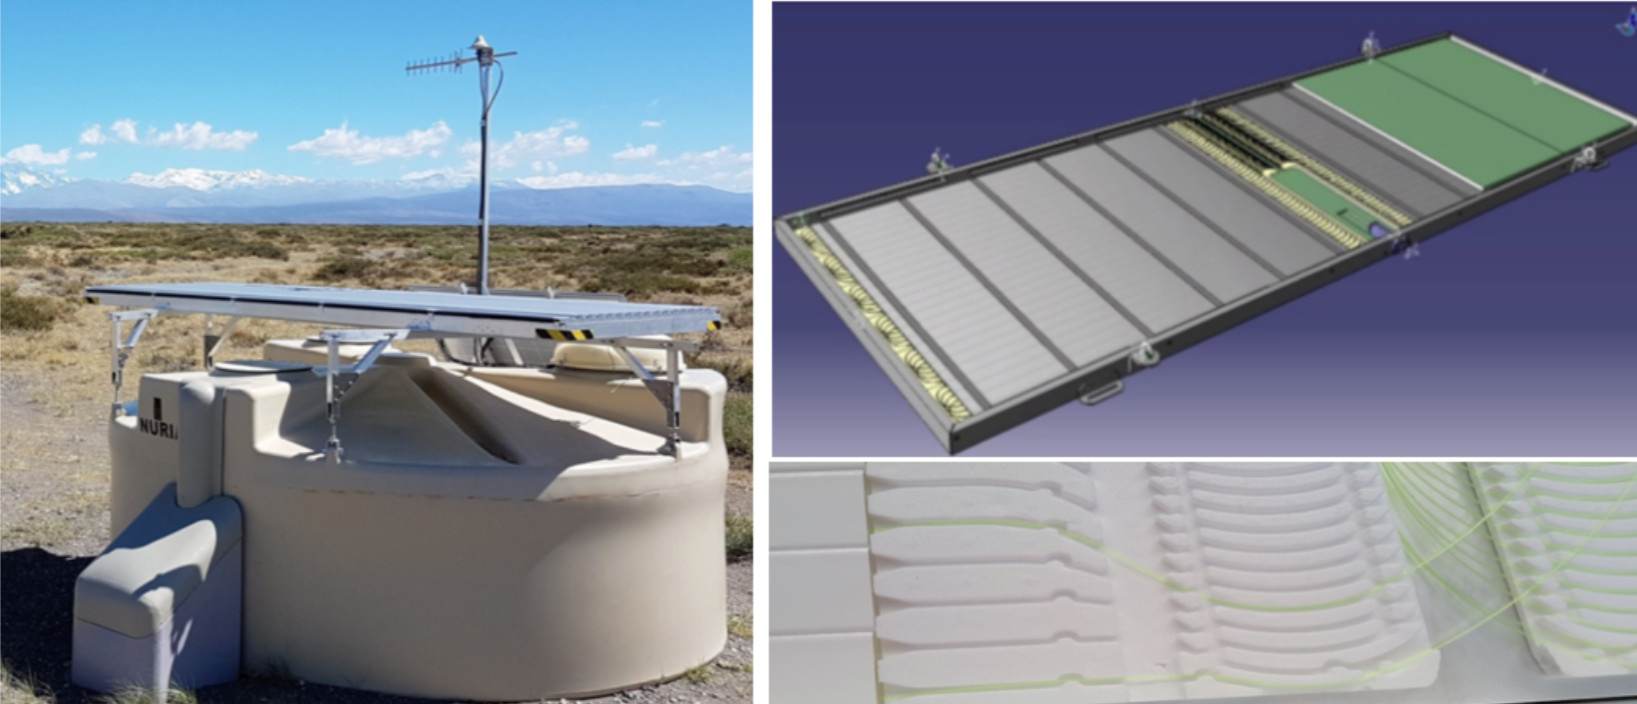
A Surface Scintillator Detector (SSD) unit PrimeSSD is composed of a box of (3.8 1.3) m2, housing
two scintillator sub-modules, each covering an area of 1.9 m2. The scintillator planes are protected
by light-tight, waterproof enclosures and are mounted on top of the existing WCD with a strong support frame,
as shown in the left panel of Fig.1.
A double roof, with the upper layer being corrugated aluminum, is used to reduce the temperature variations.
The scintillation light is collected with wavelength-shifting fibers
inserted into straight extruded holes in the scintillator planes (right panels of Fig.1).
The fibers, Kuraray Y11(300)M S-type, are positioned following
the grooves of the routers at both ends, in a “U” configuration that maximises the light yield. They are
bundled in a cookie, acting also as a diffuser, whose PMMA front window is connected to a single photomultiplier
(PMT) tube. The PMT is a bi-alkali Hamamatsu R9420, 1.5" diameter,
with 18% quantum efficiency at a wavelength of 500 nm; the power supply is based on a custom made design
manufactured by ISEG company.
After production, the SSD modules are tested using muon tower facilities, exploiting atmospheric muon tomography
to measure the minimum ionizing particle (MIP) as well as the uniformity
for each SSD unit. From these measurements,
the number of photoelectrons per vertical MIP is found to be (302). Due to the U-turn of the fibers and their
length outside the scintillator bars, the uniformity of the measured signals is 5% along the bars and 10%
between bars. The attenuation length of the light in the fibers is cm.
Each SSD module is equipped with two sensors to measure temperature and humidity; by measurements in the field,
it has been shown that the temperature inside the SSD closely follows the air temperature evolution measured in
the shade, almost never exceeding 40∘C.
2.2 The dynamic range of the Surface Detector
The SD data quality will be improved by extending the acquisition dynamic range in both detectors, thus allowing us to measure non-saturated signals at distances as close as 250 m from the shower core PrimeSPMT . In order to benefit the most from the combined information of SSD and WCD, the dynamic range of both detectors should be similar. Significant signals are expected both close to the shower core and at intermediate distances, where simultaneous measurements will be most important for the separation of the different components of the shower, furthermore allowing a direct cross-check of the two detectors.
To increase the dynamic range, a fourth small PMT (Hamamatsu R8619, 1" diameter) is
inserted in the WCD, exploiting an hitherto unused and easily accessible 30 mm window on the Tyvek bag containing
the ultra-pure water. With an active area of about 1/80 with respect to the large WCD PMTs, it potentially allows
for an equivalent dynamic range
extension. The required range up to about 20000 VEM can be obtained by adjusting the gain in such a way that the
ratio of the large to the small PMT signals be limited to a value of 32.
The linearity of the small PMT is guaranteed in the required range for a large set of voltages, down to 800 V.
The power supply is provided by an external custom made HVPS manufactured by CAEN company.
For consistency with the associated WCD, the dynamic range in the SSD must span from the signal of a single particle, as needed for calibration, to large signals, up to MIP. Indeed, the SSD PMT has been chosen also based on its excellent linear response when operated at low gain, being linear within 5% for peak currents up to 160 mA (for a gain of ). To reach the required dynamic range, the anode signal is filtered and split in two in the electronics front-end; then one of the two signals is attenuated by a factor of 4, while the other is amplified by a factor of 32.
2.3 The Electronics of the Surface Detector
Implemented in a single board, called the upgraded unified board (UUB), the electronics of the SD is used to record
the PMT signals, make local triggering decisions, send time-stamps to the central data acquisition system
and store event data for retrieval upon a global trigger condition PrimeSDEU .
The upgraded electronics will allow us to read the four photomultipliers of the WCD and the SSD one, processing the
signals at 120 MHz, corresponding to an increase of the current rate of a factor of 3.
The anode channel of the three large XP1805 PMTs of the WCD is split and amplified to reach a gain ratio of 32.
The signals are filtered and digitized by commercial 12 bit 120 MHz flash ADC (FADC); as the XP1805 pulse
response in terms of bandwidth is 70 MHz, this is well matched to a 120 MHz FADC and associated 60 MHz Nyquist filter.
The small PMT signal is also digitized with 12 bits at 120 MHz in a separate channel.
The anode of the SSD PMT is split in two different channels, the first one amplified to have a gain ratio of 32 and
the other attenuated by a factor of 4. This yields a total gain ratio of 128. The signals are filtered and digitized
similarly to the WCD PMT signals.
The local trigger and processing capabilities are increased by using a more powerful local-station processor and
FPGA (field-programmable gate array), thus allowing the implementation of new triggers, e.g. combined SSD and WCD
triggers, in addition to the current ones.
The recorded traces can be digitally filtered and downsampled to
40 MHz to emulate the current triggers in addition to any new ones, thus providing backwards-compatibility
with the current dataset. Furthermore, this will allow us to deploy the new electronics without stopping or
disturbing the current data taking.
The timing accuracy is improved to 2 nanoseconds thanks to the implementation of a new GPS receiver, the
I-Lotus M12M, providing the same pulse per second timing output with serial control and data as the currently
used Motorola Oncore UT+ one, as such providing compatibility with the running electronics.
The UUB is equipped with a micro-controller (MSP430) for the control and monitoring of the PMT high voltage,
the supervision of the various supply voltages and reset functionality. More than 90 monitoring variables
will be managed by the slow-control software.
The VEM (vertical equivalent muon) is the reference calibration unit of the WCD high gain channels. It is derived
using a test station with an external hodoscope triggering on atmospheric muons and corresponds on average
to 95 photoelectrons at the PMT cathode; in the UUB, this is equivalent to about 1800 integrated ADC counts above pedestal.
Due to its dimensions, no direct calibration of the small PMT with muons is feasible. By selecting small shower events,
the small PMT can be cross-calibrated with the large PMTs in such a way that the signal spectrum is correctly reconstructed
up to about 20,000 VEM.
The SSD calibration is based on the signal of a minimum-ionising particle going through the detector.
A cross-trigger with the WCD can be used to remove all of the low-energy background. About 40% of the
calibration triggers of the WCD produce a MIP in the SSD.
For both the WCD and the SSD, the cross-calibration between high gain and low gain channels is defined in the electronics,
by a simple ratio between the amplified and non amplified anode signals.
2.4 Performances of the upgraded detectors
Started in 2016, an Engineering Array of twelve AugerPrime stations has been taking data in the field, with the aim of testing and monitoring the performances of the upgraded detectors.
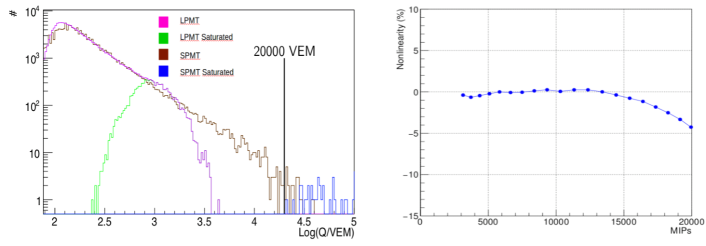
The logarithm of the charge spectrum in one of the upgraded AugerPrime WCD stations is shown in Fig. 2(left).
The dynamic range is extended to more than 20000 VEM by means of the small PMT, as one can see by
comparing the unsaturated spectrum measured by the large PMTs (magenta histogram) to the one obtained with
the small PMT (brown curve). The reconstruction resolution obtained with the small PMT is better than 5%
above 3000 VEM, which correspond to the signal produced at 250 m from the core in showers of 10 EeV.
The very good linearity behaviour of the photomultipliers of the SSD guarantees the possibility to measure
signals up to about 20000 MIP. As shown in the right panel of the same figure for one SSD-PMT, the non-linearity
stays below 5% up to the highest densities.
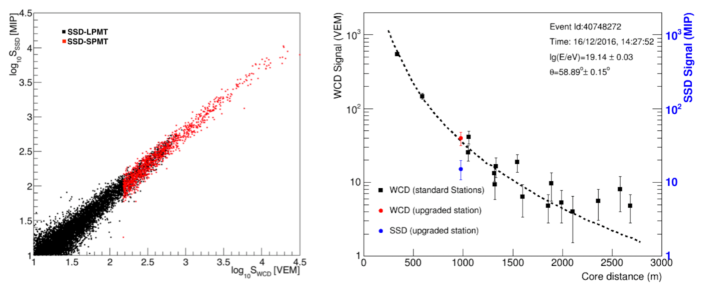
The correlation between the signals in one of the WCD and in the corresponding
scintillator is shown in the left panel of Fig. 3, where both scales are expressed in the corresponding physical units
(VEM for the WCD PMTs and MIP for the SSD PMT). The signals in the WCD are measured up to saturation
( 650 VEM) by the large PMTs (black dots). In the superposition region and above the large PMT saturation,
they are derived from the small PMT (red dots). The correlation obtained demonstrates the validity of the
independent calibration procedures and shows that the required dynamic range in the upgraded Surface Detector is
nicely covered up to the highest particle densities.
The reconstructed lateral distribution function for one of the events collected in the region of the Engineering Array
is shown in the right panel of Fig. 3.
The signal recorded in the upgraded WCD (red dot) is in very good agreement with expectations, following
the lateral distribution reconstructed by means of the standard stations. The SSD signal, in blue, is relatively
lower than the WCD ones, as expected due to the different sensitivity of the two detectors to the electromagnetic
component of the showers at different core distances and to the relatively smaller area of the SSD with respect to the WCD.
2.5 The Underground Detector
As part of the AMIGA enhancement (Auger Muons and Infill for the Ground Array), an array of
underground detectors is being deployed beside the 61 WCD of the Infill area of the Observatory, on a 750 m triangular grid.
In each position, 3 scintillator modules of 10 m2 area are buried 2.3 m underground,
to minimise the contamination from electromagnetic shower particles. The scintillation light is collected
using wavelength shifting fibers read by silicon photo sensors AMIGA . Two modules in the
assembly hall are shown in the top panel of Fig.4.
The segmented structure of the counters allows direct counting of muons; a channel for signal integration will be used
to extract the muon information close to the shower core, in the saturation region.
These detectors will provide a direct measure of the muon content of the extensive air showers, with the aim of
studying the primary composition and hadronic interactions in a region of energy corresponding to the
transition of cosmic rays from a Galactic to an extra-galactic origin.
Furthermore, the underground modules will allow us to cross-check and fine-tune the methods used
to derive the muon information from the upgraded SD.
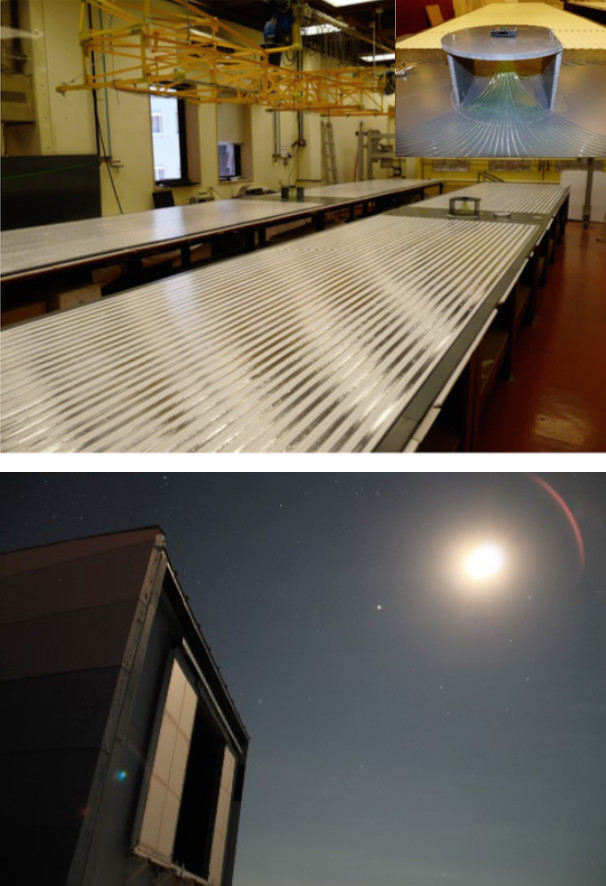
2.6 The extended duty cycle of the Fluorescence Detector
The Auger Fluorescence Detector (FD) is composed of 27 telescopes overlooking the SD area (Fig.4,
bottom panel). They are used to
observe the longitudinal development of air showers in the atmosphere, thus providing mass sensitive observables and
a model independent energy reconstruction.
The FD duty cycle is currently limited to about 15 %, being operations
limited to dark and moonless nights.
The current criteria for FD measurements require the Sun to be more than 18∘ below the horizon, the
Moon to be below the horizon for more than 3 hours and the illuminated fraction of the Moon to be below 70%.
A significant increase of about 50% in the duty cycle can be obtained by extending the FD operations to times
with larger night sky background, relaxing the second and third requirements.
By reducing the supplied high voltage, the PMT gains can indeed be reduced by a factor of 10.
Preliminary tests
show that the PMTs operated at reduced gain satisfy the criteria required for the FD performance (such as linearity,
stability and lifetime), avoiding too high anode currents that could result in a deterioration of the tubes.
2.7 The Radio Upgrade
An engineering array of radio detectors (AERA) has been running in the Pierre Auger Observatory for a few years.
With the collected data, it was possible to demonstrate the feasibility of radio detection with a grid
of antennas at 1500 m mutual distances, and measure horizontal showers (), which illuminate an area of
several km2 on the ground radioHor .
Based on these results, a full radio upgrade of the Pierre Auger Observatory has been proposed radio ,
where each WCD of the SD will be equipped with a radio antenna mounted on its top surface, as shown in Fig.5.
The new detectors will operate together with the upgraded SD, forming a unique
setup to measure the properties of cosmic rays above eV. For horizontal showers, they
will nicely complement the information on the particle type we will get from the WCD+SSD, thereby
increasing the exposure for mass-sensitive investigations.

3 Expected physics performances
As discussed above, the main aim of AugerPrime is that of providing event-by-event composition-sensitive measurements by increasing the ability to recognize and separate the different components of air showers. The goodness of the separation between two different primaries i and j can be quantified by defining a merit factor
| (1) |
The most direct technique to evaluate the muon component exploits the different responses of the WCD and SSD at station level, relating the total signals (VEM) and (MIP) to the electromagnetic and muonic fluxes at ground. Employing a matrix inversion method ALS , the muonic signal in the WCD can be derived as
| (2) |
where the coefficients a and b, although derived from simulations, show only a very weak dependence on
the mass and arrival direction of the primary particles and on the hadronic interaction models used in the Monte Carlo.
The muon signals so obtained are subject to large fluctuations, being restricted to individual stations.
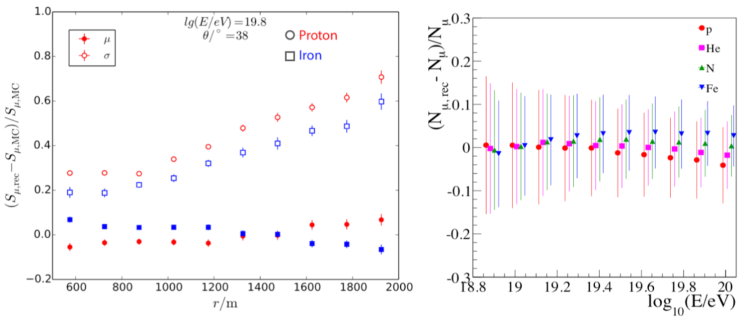
In Fig.6, left, the reconstruction bias (solid symbols) and the resolution (open symbols) of the muonic signal
contribution for individual detector stations are shown for two different primary compositions: at 1000 m from the core, a
resolution of 20 to 30% can be achieved.
The performances of the method can be improved when the reconstructed signals at station level are used to evaluate
the lateral distribution function. The matrix inversion method is then applied to evaluate the muon signal at
800 m from the core. Using as estimator of the composition, a merit factor can be
obtained in separating proton and iron primaries at small zenith angles for energies larger than eV.
A more general approach based on the properties of universality of air showers univ or multivariate analyses would allow us to take advantage of all the information provided by AugerPrime, not only by correlating the detector signals at different distances to the core but also considering their temporal structure (arrival times of the particles at the stations). In this case, an event-by-event reconstruction allows us to derive not only the energy, but also the depth of maximum shower development in atmosphere () and the number of muons () using the information from the scintillators combined with the WCD data. The bias and resolution in the evaluation of are shown in the right panel of Fig.6, as a function of composition and energy. As an example, a merit factor of about 1.7 (2.1) can be obtained for the separation of proton from iron primaries at 60 EeV, for zenith angles of 38∘ (56∘) respectively. The reconstruction bias for is less than 15 g/cm2 with the resolution improving from 40 g/cm2 at eV to 25 g/cm2 at eV.
3.1 The interpretation of the suppression in the flux
To explore the power of AugerPrime with respect to meeting the scientific goals, we simulated two
sets of mock data corresponding to seven years of data taking in AugerPrime and to an exposure of
50000 km2 sr yr, assuming the two different simplified models described
in Sect.1: a maximum rigidity (“Scenario 1”) and a photo-disintegration
one (“Scenario 2”). These two benchmark models approximately reproduce the energy spectrum and
distributions as measured in Auger above eV, as resulting from a numerical fit
following the method described in scenarios .
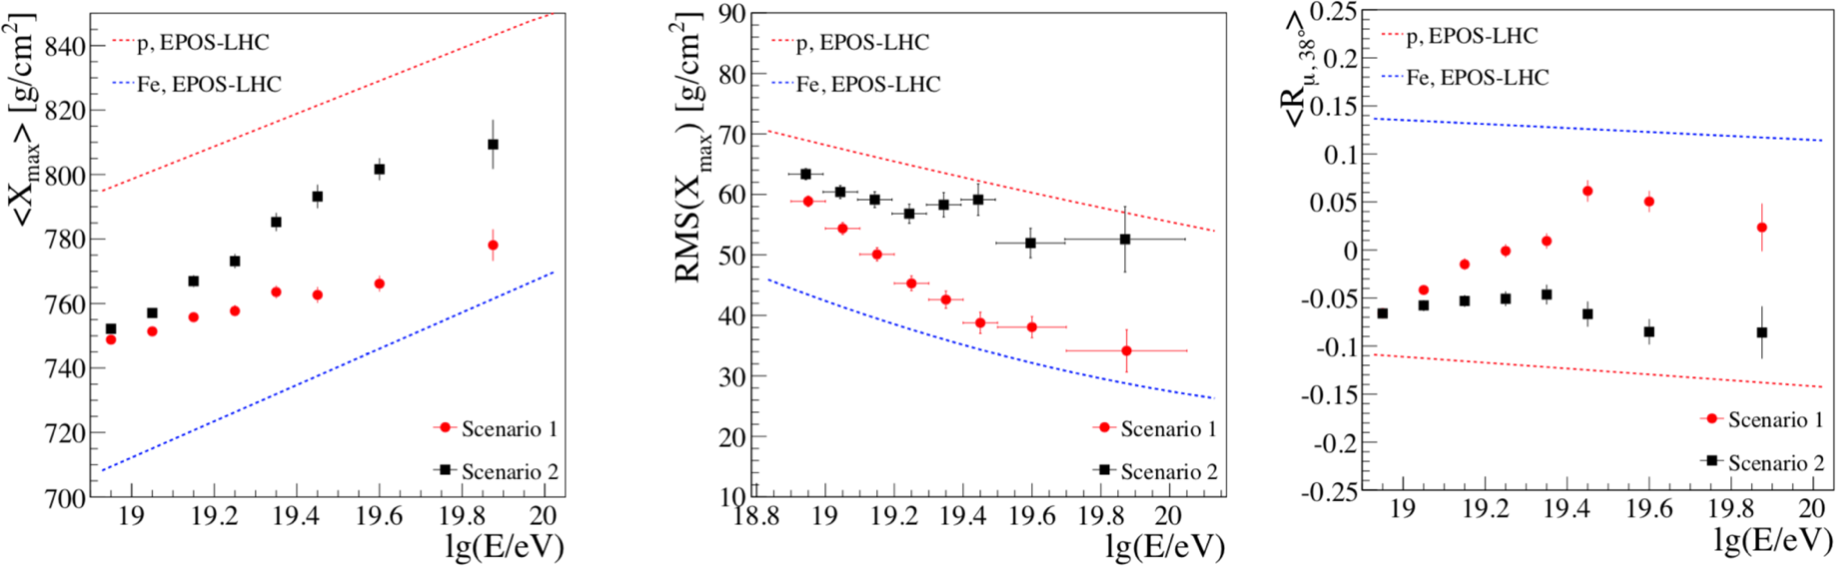
The first two moments of the distributions and the mean muon number as predicted based on the two
scenarios are shown in Fig.7 as a function of energy for two extreme nuclear masses. Note that the RMS()
includes both the shower-to-shower fluctuations and the detector resolution.
To get rid of the dependencies of the total muon number on energy and zenith angle (due to the shower intrinsic fluctuations
and to the fact that the muon path-length varies with ), the total muon number is shown relative to that
expected from a mix of equal fractions of primaries.
Although the expected values are quite similar below eV,
a range already covered by the FD, the models predict quite different results in the highest energy region, showing
that the two scenarios can be distinguished with high statistics and significance in 7 years of measurements.
3.2 Is there a proton fraction at UHE?
In the first scenario, no protons can reach us from above 50 EeV, while on the contrary we would see a large fraction
of them in the second one.
To explore the feasibility of detection of a small fraction of protons with AugerPrime in the
framework of Scenario 1, we artificially added a contribution of 10% protons to it (“Scenario 1p”).
The proton-rich sample was produced by assigning to these events a proton-like , i.e. an g/cm2
at 10 EeV, adjusted to the event energy with an elongation rate of 55 g/cm2 per decade.
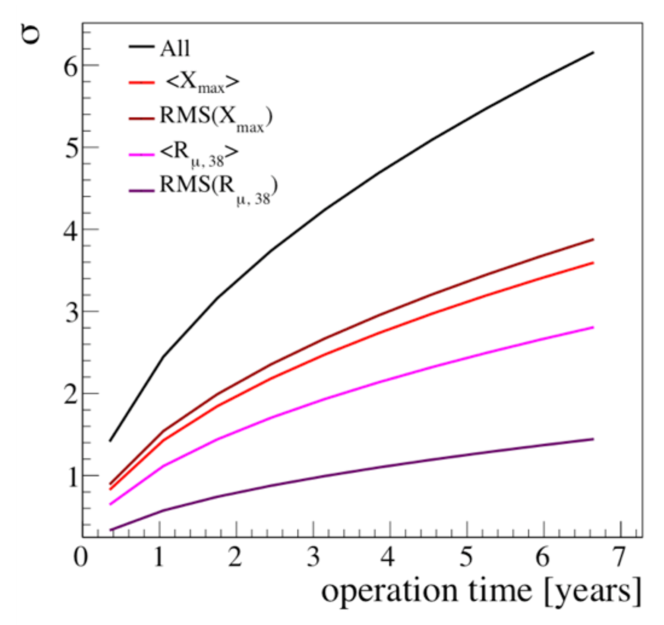
The difference between the means of the distributions as obtained from the two scenarios (“1” and “1p”)
divided by the statistical uncertainty is shown in Fig. 8 for each observable. As shown in the figure by the black line,
the best separation power is obtained by constructing a combined significance using all
observables at our disposal:
| (3) |
We conclude that using this combination and integrating above 10 EeV we might be able to distinguish between Scenario 1 and 1p (i.e. to observe a fraction of protons as low as 10%) at the highest energies with more than 5 after 5 years of operation of AugerPrime.
3.3 Composition-wise anisotropy studies
To study the gain in sensitivity with AugerPrime in the search for the sources of ultra-high energy cosmic
rays, we used the arrival directions of 454 events with E eV measured at ev454 ,
assigning them random values according to Scenario 1. A 10% enhanced proton fraction was then
implemented as in the previous study (Scenario 1p). Furthermore, we randomly assigned to 50% of these
protons an arrival direction corresponding within 3∘ to one of the AGNs of the Swift-BAT catalog,
chosen among those with distances within 100 Mpc Swbat .
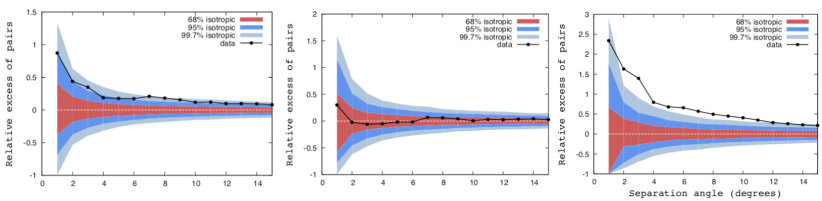
The angular correlation is shown in Fig. 9. It is not significant when
considering the complete data set of 454 events without composition information (left panel of the figure), but
with the proton-enriched sample a correlation in excess of 3 is clearly evident (right panel).
As expected, no excess of pairs is found with the AGNs for the proton-deprived selection (central plot), as in
this case the angular correlation is just due to statistical fluctuations.
3.4 Neutral particles limits
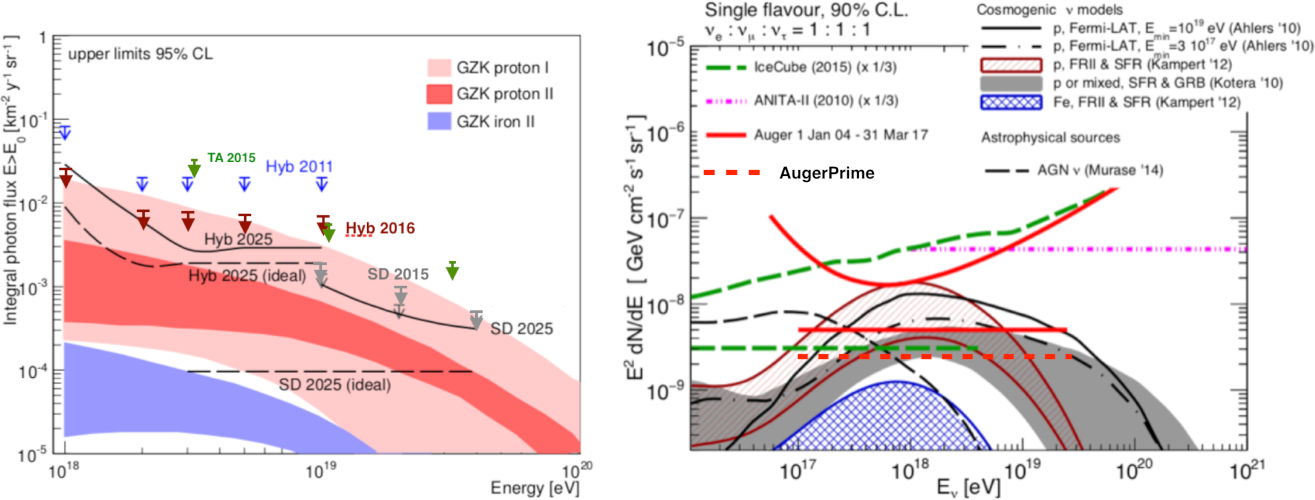
Auger observations provided the currently most stringent limits on the flux of photons at energies above
eV and severe constraints on cosmogenic neutrinos phot ; neut .
Even better limits are expected to be reached with AugerPrime: five more years of data will provide us with a large
increase in statistics, the new electronics will allow the introduction of more efficient triggers, a reduction of the
hadronic background will be possible thanks to an improved muon discrimination.
In Fig.10, the current limits for both photons and neutrinos are shown together with
preliminary calculations of the expected sensitivities from AugerPrime (dashed lines). This ideal
case assumes complete rejection of the hadronic background.
In the photon case, the introduction of the new triggers allows us to extend the measurement with SD below 10 EeV.
3.5 Hadronic interactions and fundamental physics studies
AugerPrime can shed light on whether the inconsistencies between air shower simulations and
experimental data are due to fundamental shortcomings in our understanding of hadronic multiparticle production.
Since the electromagnetic energy deposit in the atmosphere is mainly due to the first high energy interactions,
while on the other hand muons at ground come as products of low energy interactions,
an event-by-event correlation between the depth of shower maximum and the muon content in showers generated
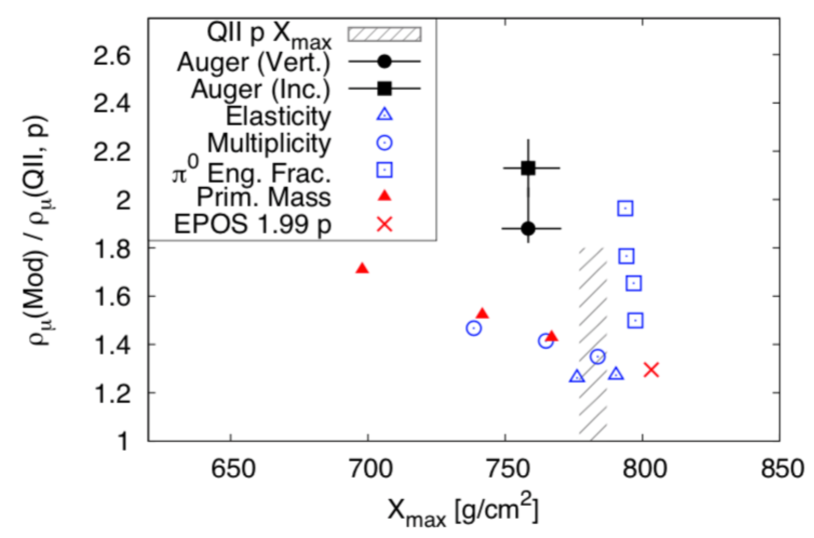
by ultra-high energy cosmic rays can bring strong constraints on hadronic interaction models GF .
As an example, the muon density as obtained by different modifications of hadronic interaction models,
relative to that predicted by QGSJetII-03 for protons, is shown in Fig.11 in correlation with the depth of
shower maximum, for various compositions.
A high resolution measurement of the muon number such as the one expected from AugerPrime can prove to be a very powerful observable also to look for exotic interaction Scenarios. As an example, if Lorentz invariance violation effects exist, the absorption and energy losses of UHECRs during propagation would be modified. Furthermore, strong changes in the development of shower produced by the interaction of UHECRs with nuclei in the atmosphere may also be visible exotic .
4 Conclusion
The quest for the sources of UHECRs will be pursued by AugerPrime, the Pierre Auger Observatory upgrade, by providing a high statistics sample of events with mass information.
Composition-wise anisotropy searches will allow us to understand the origin of the flux suppression and explore the anisotropy dependencies on the particle rigidities. AugerPrime will be able to measure the presence of even a small fraction of protons at the highest energies, as such assessing the feasibility of future projects willing to detect ultra high energy neutrinos.
A much improved measurement of the muon content in air showers will help in the study of hadronic multiparticle production and the search for exotic interactions. Furthermore, once a better tuning of the models is reached, we will have the possibility to reanalyse also the pre-upgrade data set and study the composition with much lower uncertainties.
While the main aim of the upgrade is the study of the highest energy region, above eV, the composition sensitive information will also allow to gain more information on the region of transition from a Galactic to an extra-galactic contribution to the cosmic ray flux, at eV.
An Engineering Array of twelve upgraded stations has been taking data in the field since 2016; as of October 2018, thirty more fully upgraded stations have been deployed. The data collected so far demonstrate the quality of the new detectors and the physics potential of the upgrade project. The production of scintillators and small PMT systems is proceeding at full pace: a large number of them is already available in Malargüe, while some units of the upgraded electronics boards are under test in the field. The production and deployment of the AugerPrime detectors and electronics will be completed within 2019. Operations and full data taking are planned from 2020 to 2025.
References
- (1) A. Aab et al. (Pierre Auger Collaboration), Nucl. Instr. Meth. A 798, 172 (2015).
- (2) M. Unger (Pierre Auger Collaboration), Highlight talk in Proc. 35th Int. Cosmic Ray Conf., Busan (Korea), PoS(ICRC2017) 1102 (2017).
- (3) A. Aab et al. (Pierre Auger Collaboration), Science 357, 1266 (2017).
- (4) A. Aab et al. (Pierre Auger Collaboration), Astrophys. J. 853, L29 (2018).
- (5) A. Aab et al. (Pierre Auger Collaboration), Phys. Rev. D 90, 122006 (2014).
- (6) A. Aab et al. (Pierre Auger Collaboration), Phys. Lett. B 762, 288 (2016).
- (7) A. Aab et al. (Pierre Auger Collaboration), Phys. Rev. D 96, 122003 (2017).
- (8) A. Aab et al. (Pierre Auger Collaboration), JCAP 04, 038 (2017).
- (9) A. Aab et al. (Pierre Auger Collaboration), Phys. Rev. D 91, 032003 (2015).
- (10) A. Aab et al. (Pierre Auger Collaboration), Phys. Rev. D 90, 012012 (2014). Erratum-ibid: 92 (2015) 019903.
- (11) M. Mallamaci (Pierre Auger Collaboration), Proc. 35th Int. Cosmic Ray Conf., Busan (Korea), PoS(ICRC2017) 509 (2017).
- (12) A. Aab et al. (Pierre Auger Collaboration), Phys. Rev. Lett. 117, 192001 (2016).
- (13) A. Aab et al. (Pierre Auger Collaboration), Phys. Rev. D 93, 072006 (2016).
- (14) The Pierre Auger Collaboration, The Pierre Auger Observatory Upgrade: AugerPrime. Preliminary Design Report, arXiv:1604.03637 (2016).
- (15) D. Martello (Pierre Auger Collaboration), Proc. 35th Int. Cosmic Ray Conf., Busan (Korea), PoS(ICRC2017) 383 (2017).
- (16) R. Smida (Pierre Auger Collaboration), Proc. 35th Int. Cosmic Ray Conf., Busan (Korea), PoS(ICRC2017) 390 (2017).
- (17) A. Castellina (Pierre Auger Collaboration), Proc. 35th Int. Cosmic Ray Conf., Busan (Korea), PoS(ICRC2017) 397 (2017).
- (18) T. Suomijarvi (Pierre Auger Collaboration), Proc. 35th Int. Cosmic Ray Conf., Busan (Korea), PoS(ICRC2017) 450 (2017).
- (19) A. Aab et al. (Pierre Auger Collaboration), JINST 12, P03002 (2017).
- (20) A. Aab et al. (Pierre Auger Collaboration), JCAP 10, 026 (2018).
- (21) J. Hörandel, these Proceedings.
- (22) A. Letessier-Selvon et al., Nucl. Instrum. Meth. A 767, 41 (2014).
- (23) D. Maurel et al., Proc. of 33rd Int. Cosmic Ray Conf., Rio de Janeiro, Brazil, 600 (2013).
- (24) A. Aab et al. (Pierre Auger Collaboration), Astrophys. J. 804, 15 (2015).
- (25) W. Baumgartner, J. Tueller, C. Markwardt, G. Skinner, S. Barthelmy et al., Astrophys. J. Suppl. 207, 19 (2013).
- (26) M. Niechciol (Pierre Auger Collaboration), Proc. 35th Int. Cosmic Ray Conf., Busan (Korea), PoS(ICRC2017) 517 (2017).
- (27) E. Zas (Pierre Auger Collaboration), Proc. 35th Int. Cosmic Ray Conf., Busan (Korea), PoS(ICRC2017) 972 (2017).
- (28) G.R. Farrar, J.D. Allen, Proc. 33rd Int. Cosmic Ray Conf., Rio de Janeiro (Brasil), arXiv:1307.7131 (2013).
- (29) R. Aloisio et al., Frascati Phys. Ser. 58, 274 (2014).