Quantum noise limited nanoparticle detection with exposed-core fiber
Abstract
Label-free biosensors are important tools for clinical diagnostics and for studying biology at the single molecule level. The development of optical label-free sensors has allowed extreme sensitivity, but can expose the biological sample to photodamage. Moreover, the fragility and complexity of these sensors can be prohibitive to applications. To overcome these problems, we develop a quantum noise limited exposed-core fiber sensor providing robust platform for label-free biosensing with a natural path toward microfluidic integration. We demonstrate the detection of single nanoparticles down to 25 nm in radius with optical intensities beneath known biophysical damage thresholds.
1 Introduction
The past few decades have seen rapid improvements in the sensitivity of label-free optical biosensors. Single proteins of a few nanometres in size and below can now be routinely detected in solution [1, 2, 3, 4]. Recently, these biosensors have been used to shed light on fundamental biophysics phenomena [5, 1] and have been shown to have potential applications ranging from medical diagnostics [2] to high-resolution imaging [6] and environmental monitoring [1]. Among the currently developed sensors are whispering gallery mode (WGM) resonators [7, 8] and plasmonic sensors [3, 9]. Combining both approaches allows resolution of the motion of single enzymes [5] and detection of single ions in solution [1]. However, these sensors generally operate with optical intensities far above known thresholds for photochemical intrusion and photodamage [10, 11, 12]. To overcome this problem, quantum-noise limited measurement techniques have been developed using a nanofiber combined with dark field heterodyne measurement [2]. Sensors based on these techniques are capable of detecting single BSA molecules (3.5 nm) with four orders of magnitude reduced optical intensity. However, the relative fragility of these sensors and the lack of integrated microfluidic channels has, so far, prevented their integrated used. Nanofluidic optical fibers can overcome some of these issues and have been used to detect and differentiate label-free single viruses via their optical scattering when illuminated by the guided mode of the fiber [4, 13]. Here we introduce a biosensor combining the advantages of these techniques using exposed-core fiber and quantum noise limited dark field heterodyne measurement. Exposed-core fibers can be interated with microfluidics channels [14] and are more robust than nanofibers due to their hundred microns diameter. We demonstrate detection of single label-free nanoparticles in solution at the quantum noise limit and compare our results with theory and simulations.
2 Approach
2.1 Exposed-core fibers
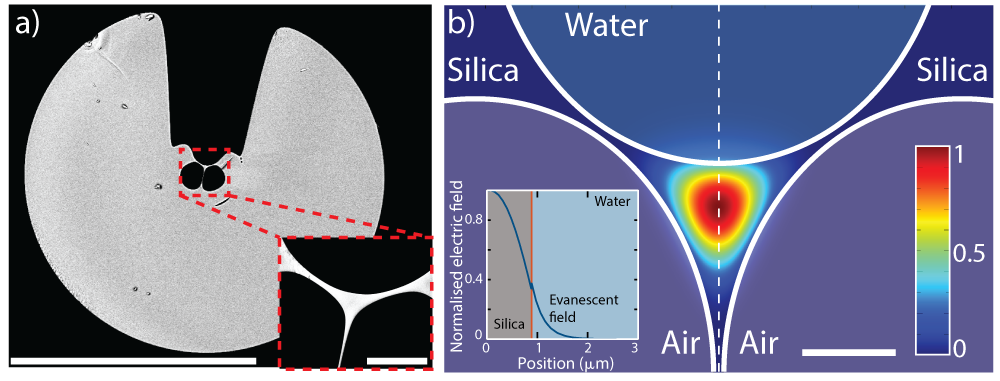
The exposed-core fibers used here are microstructured optical fibers that confine light through three longitudinal air holes [15, 16, 17], as seen in the scanning electron microscopy (SEM) image in Fig.1a. The air holes introduce a large refractive index mismatch so that the light can be guided in a micrometre sized core of the same material as the cladding (see Fig.1b). In exposed-core fibers, one of the air holes is engineered to be open to the surrounding medium allowing direct interaction between the guided light and the environment. This is shown in Fig.1b where we have simulated the fundamental mode shape of a 2 m diameter exposed-core fiber with the top hole opened to a solution of water, which could contain the particles of interest. One can see that most of the light is guided in the core of the fiber but a fraction propagates in the surrounding medium as an evanescent field (see Fig. 1b inset). Similar to other evanescent field techniques such as WGM or nanofiber sensors, any perturbation in refractive index within the evanescent field will perturb the propagating field and can potentially be detected. The region where the evanescent field propagates determines the interaction volume between the light and the surrounding medium. This accessible interaction volume allowed a wide variety of applications including sensors for biology [18, 19]. For example, exposed-core fibers have been used for the detection of fluorescence signals [20, 21] and for detection of label-free molecule ensembles in an interferometric configuration [18, 19].
Compared with optical nanofibers, the advantages of exposed-core fibers are that they are made from a single material and can be consistently drawn for hundreds of meters, allowing large-scale production [16]. By comparaison, nanofibers must be pulled individually and their typical sensing region is only a few mm long [22]. Even though the core of the exposed-core fiber is small (2 m), when including the cladding they are about m in diameter (see Fig.1a) making them much less fragile than nanofibers (500 nm). Moreover, they have already been demonstrated to be compatible with microfluidics channels [14].
2.2 Evanescent sensing mechanism
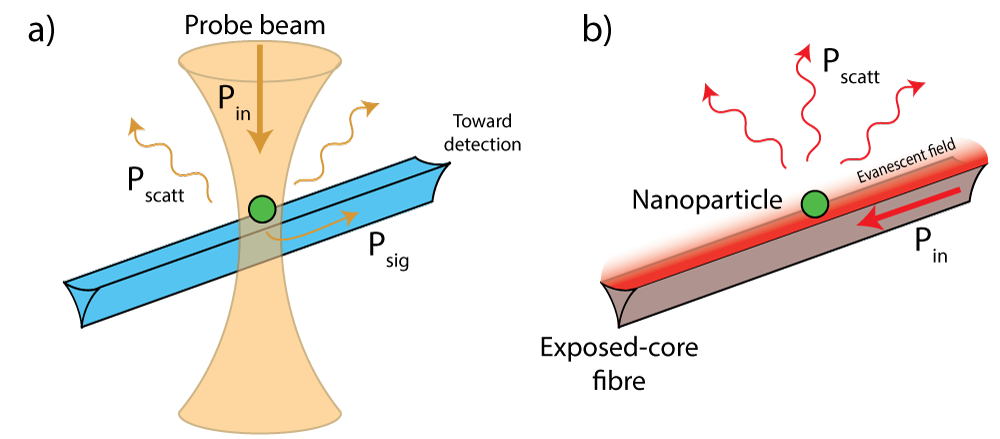
As displayed in Fig. 2 a), to detect nanoparticles with exposed-core fiber, we focus a probe beam (yellow) on the exposed-core fiber immersed in a solution containing nanoparticles. When a particle enters the region close to the fiber where the probe light is focussed, it will scatter the probe light and a portion of the scattered light will be collected by the guided mode of the exposed-core fiber. This forms a dark field configuration since the probe field is orthogonal to the direction of propagation in the fiber and when no particle is present, a very small amount of probe light will be collected (additional details in appendix section 5).
When a detection event occurs, for a focussed Gaussian probe beam, the scattered power by the nanoparticle is given by [23]:
| (1) |
where is the input power, is the probe beam waist, is the scattering cross-section of the nanoparticle and we have neglected modifications of the optical density of states due to the presence of the fiber, which we expect to be small. The standard model used to determine for particles smaller than the wavelength of the light is the dipole scattering model [24]:
| (2) |
where is the radius of the particle, is the wave vector of the light, is the wavelength of the light and is the refractive index ratio of the nanoparticle material and the surrounding medium . The power of the detected signal at one end of the exposed-core fiber, , will depend on how much of is collected by the exposed-core fiber. Thus, we have , with being the collection efficiency of the exposed-core fiber. Overall, the detection of single nanoparticles is challenging because the fraction of collected photons and the number of scattered photons can be very small. Indeed, as seen in eq. 1 and 2 the signal power scales with the particle volume squared and is greatly reduced when the radius reaches nanometres in size.
The parameter is equal to the overlap integral between the scattered field and the guided modes of the exposed-core fiber, which is hard to determine analytically. However, it is closely related to the evanescent field outside of the fiber. This can be understood using Helmholtz reciprocity. Imagine the reverse path of the light, where the incident light enters through the exposed-core fiber and is scattered out of the core by a nanoparticle on the surface of the fiber, as in Fig. 2 b). From eq. 1 we see that the power scattered will be proportional to the incident power and therefore, the stronger the electric field is at the fiber surface, the larger the power scattered. Helmoltz reciprocity tells us that must be the same for the forward and reverse process. Therefore, the stronger the evanescent field at the interface is, the higher the collection efficiency. Using finite element simulation, the collection efficiency can be calculated (see appendix in section 5). In the case of a 2 m exposed-core fiber, we estimate the collection efficiency to be around 1 to 8 percent.
2.3 Apparatus
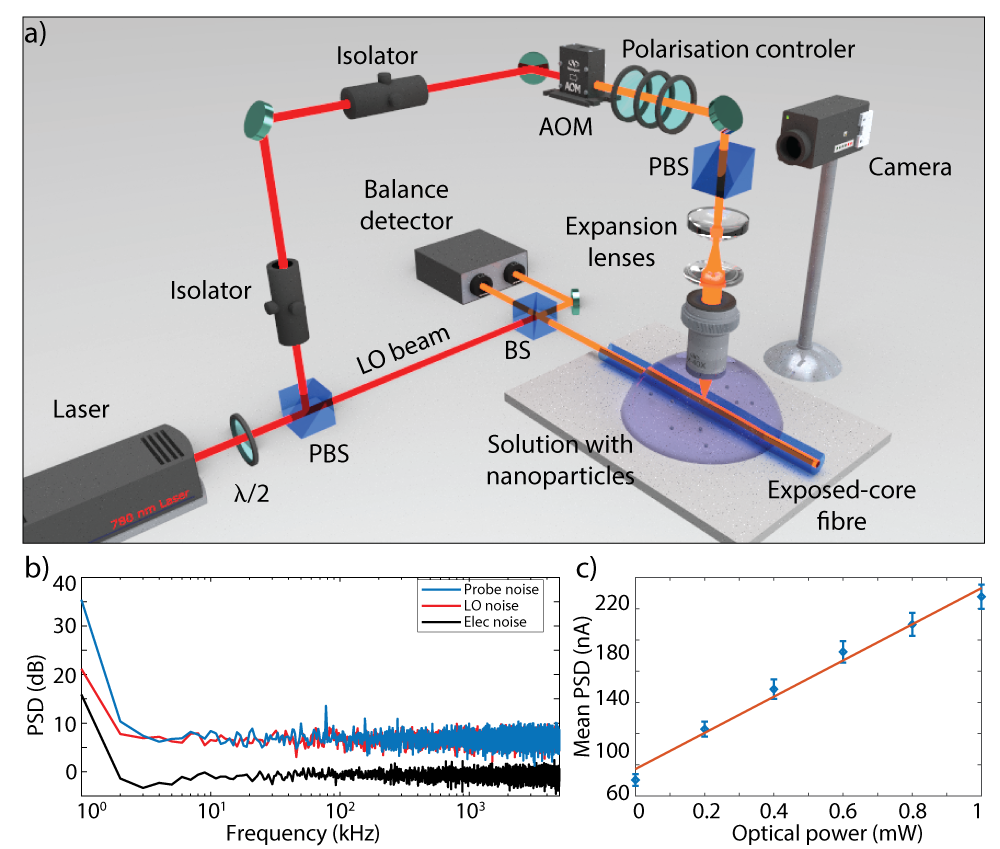
Experimentally, to setup a dark field heterodyne measurement, we split a 780 nm laser beam into a local oscillator (LO) and an illumination field (probe), as seen in Fig. 3a. The illumination field, is shifted up in frequency by an acousto-optic modulator (AOM), expanded and focused using a water immersion microscope objective (60x, 0.9 NA) on a 5 to 10 cm long exposed-core fiber. To guide the collected signal toward detection, one of the ends of the exposed-core fiber is spliced to an ultra high NA fiber (UHNA4). It is then interfered with the local oscillator on a 50-50 fiber beam splitter single mode at 780 nm. The interference is detected on a balanced detector which creates a photocurrent with a beat note at the AOM frequency. The amplitude of this beat note is proportional to the nanoparticle scattered field amplitude and is amplified by the LO. A half wave plate is used before splitting the laser to control how much power goes in each beam. Typically, 2 mW of probe power is sent to the objective and 1 mW of LO is sent to each photodiode of the balanced detector. Note that compared to our previous approach used in Ref [2], the LO is not sent through the sensing fiber but interfered after on the beam splitter. This improves the signal to noise ratio by a factor of two since the signal is detected by both photo-diodes of the detector, and reduces the intensity of the light which the sample is exposed to.
To test the noise performance of the sensor we measured the power spectral density (PSD) of the apparatus in different configurations, see Fig. 3b. In this figure, the black curve represents the electronic noise, with no light on the detector, the red curve the LO noise, when only the LO is detected. The blue curve represents the noise power spectral density when both probe and LO noise are sent to the detector with no particles present in the solution and the probe beam focussed on a static scatterer on the fiber. One can see that for frequencies smaller than 4 Hz the measurement is limited by electronic pick up and classical noise from the laser light. This can prevent observation of signal scattered by nanoparticles. However, above 4 Hz, the system is not limited by the electronic noise and only the laser noise dominates. One signature of the quantum laser noise is that its power spectral density is linearly proportional to the optical power due to the addition of vacuum noise [2]. We test this dependence in Fig. 3c, which shows the average power spectral density of the laser noise over a bandwidth of 10 kHz against the optical power on the photodiodes of the balanced detector. The observed linear relationship shows that the laser noise is only composed of quantum noise. This demonstrates that by using heterodyne detection, we can achieve quantum noise limited detection for most frequencies of interest, improving the signal to noise ratio and allowing better sensitivity than conventional direct detection methods.
After detection, this quantum noise limited signal is then mixed down with a home-built dual-phase lock-in amplifier (not shown on the figure) creating two orthogonal quadratures ( and ), which are digitalized on an oscilloscope. These two quadratures are used to extract a value proportional to the amplitude of the collected signal in post-processing as .
3 Results
3.1 Nanoparticles detection
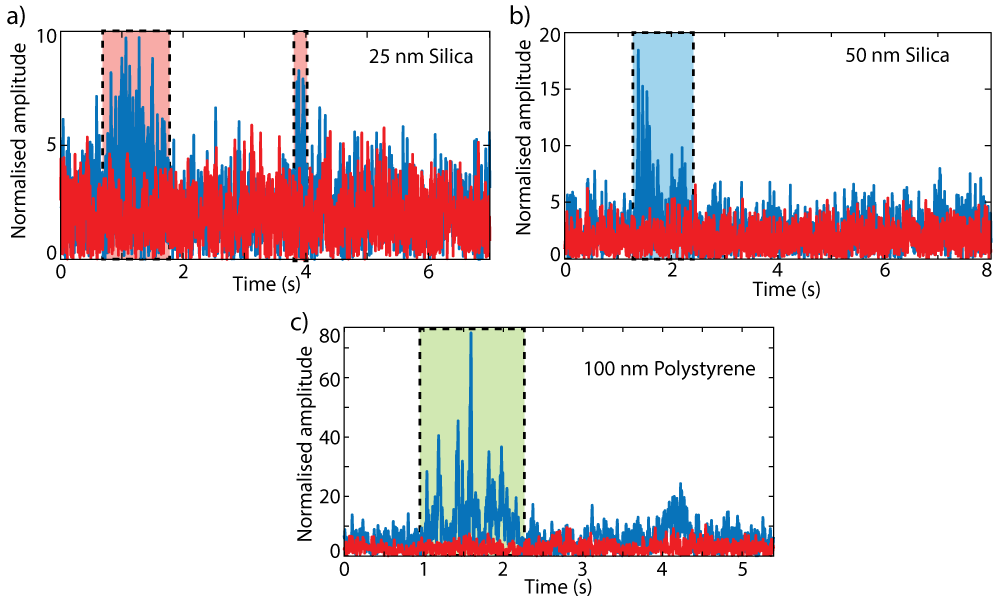
We have tested the sensor with solutions containing either silica nanoparticles of 25 nm or 50 nm in radius or polystyrene nanoparticles of 100 nm in radius. The solvent used here is dulbecco’s phosphate buffered saline (DPBS). DPBS was used instead of deionized water because it contains many ions that can screen the surface charges present on the exposed-core fiber and the nanoparticles. These surface charges could prevent the nanoparticles from entering the fiber groove and diffusing close to the core of the fiber due to electrostatic repulsion.
Experiments were performed following three steps. First, the exposed-core fiber was immersed in a 0.6 mL droplet of pure DPBS and the probe field was focussed on the fiber using the microscope objective. Second, a set of noise measurements were taken to record the electronic noise and the laser noise of the apparatus. Third, 40 L of nanoparticle solution, at concentration of , and particles per mL for the 25 nm, 50 nm and 100 nm particles receptively, was added to the droplet and the signal was monitored and recorded on an oscilloscope.
Typical experimental time traces are shown in Fig. 4a, b, c where the detection events are highlighted in red, blue and green for the 25 nm, 50 nm and 100 nm particles respectively. As expected (see the previous section 2.2), larger particles have higher scattering cross-section. Consistent with this, we observe that the signal-to-noise ratio increases when increasing the nanoparticle size.
The capacity to detect 25 nm particles shows the effectiveness of heterodyne detection and compares favourably to other direct detection experiments with nanofibers which have reported detection of particles with sizes of 100 nm [25] and 130 nm [26] in radius. Our sensor is competitive with nanofluidic optical fibers sensors which have been demonstrated to detect single 19 nm polystyrene particles [4]. However, the accessible core, in our case, offers greater flexibility for applications, while the use of dark field heterodyne allows megahertz detection bandwidth, compared to the camera-limited of few kilohertz in Ref.[4].
3.2 Particle radius scaling
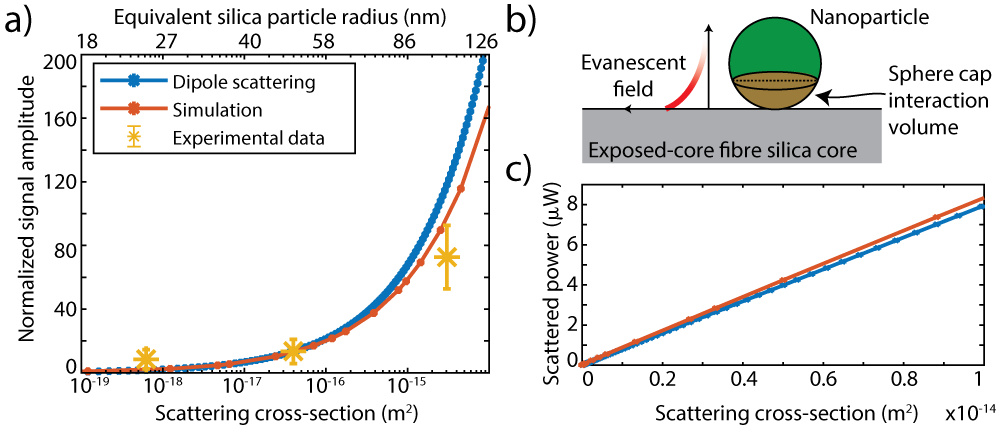
In Fig. 5a we investigate how the experimental mean maximum signal amplitude (yellow dots) scales with particle radius. We compare the experimental data with finite element simulation of exposed-core fiber (red curve, see appendix 5 for details) and with the theoretical dipole scattering of section 2.2 (blue curve). Because some experimental parameters such as the conversion of light signal power into voltage by the detector are unknown, the simulation and theoretical data are multiplied by a constant scaling factor to match the normalized amplitude signal of the experimental data for the 50 nm particle (see Fig. 5a inset). One can see that the experimental data is in relatively good agreement with the finite element simulation. However, dipole scattering overestimates the signal from particles larger than 80 nm. We expect that this is due to the exponential decay of the fiber evanescent field, such that the mean evanescent field within the volume of the nanoparticle is reduced as the particle size increases [27]. Indeed, for large particles, the interaction volume between the evanescent field of the fiber and the nanoparticle can be roughly modelled as a sphere dome, or sphere cap (see Fig. 5b). The volume of this sphere cap is proportional to the radius of the particle since the depth of the evanescent field is constant. Therefore, the scattered power deviates from the dipole scattering model.
The decay length of the evanescent field is equal to [26]. In water, this decay length is equal to 93 nm for 780 nm light. From the finite element simulation of Fig.1b inset, we can see that the field amplitude will decay to approximatively 4% of the maximum field amplitude 186 nm away form the fiber surface. Hence for particles with a diameter bigger than 2, the signal amplitude scaling with radius will start to decrease. This is what we observe in our simulation and experiments as seen in Fig. 5a where the dipole scattering model starts to differ for particles bigger than 80 nm. To confirm that this discrepancy does not come from errors in the simulation, we also calculated the scattered power of the nanoparticle which scales similarly to dipole scattering theory as shown in Fig. 5b.
4 Discussion
We have demonstrated that exposed-core fibers combined with dark field heterodyne detection can be used to detected single label-free nanoparticles as small as 25 nm silica particles at the quantum noise limit in a biologically compatible solution. The light intensity used was only W/m2 (probe beam) which is an order of magnitude smaller than intensities used for nanofibers ( W/m2 in Ref. [2]) and five orders of magnitude lower than intensities used in WGM resonator sensors. It is two orders of magnitude lower than known photodamage threshold [10] showing that the exposed-core fiber sensor should be compatible with observation of biophysics phenomena for an extended period of time. Increasing the intensity of the probe beam by an order of magnitude would still result in intensities below photodamage thresholds and, according to eq. 1, could allow detection of single nanoparticles with a scattering cross-section ten times smaller than 25 nm silica particles with the same signal to noise ratio. From Figs. 2 and 3, one can see that half of the signal is guided toward the other end of the exposed-core fiber and is not used. This signal could be also detected by using a fiber coupled mirror, for example, and could increase the signal to noise ratio of our sensor by a factor of .
To further enhance the sensitivity of the sensor, the exposed-core fiber could be designed with smaller core. Our simulation in Fig. 1b shows that the electric field amplitude at the surface of a 2 m exposed-core fiber is around 34% of the maximum field amplitude. Performing a simulation with a 500 nm core exposed-core fiber shows that the field can be enhanced to 74% of the maximum. This means that the signal amplitude could be enhanced by a factor of more than two as well as the sensitivity of the sensor assuming that the sensor remains quantum limited. In addition, the portion of the evanescent field outside the fiber will be larger, which will increase the detection volume.
In general, our results show that the exposed-core fiber sensor is sufficiently sensitive to compete with other label-free sensors. Because exposed-core fibers are less fragile and can be produced at large scale, they can be used in robust detection devices or in lab-on-chip configuration and integrated to microfluidic channels. For example, they could be used in medical diagnostic devices to detect disease markers. With such sensitivity, very few markers need to be detected and very low sample volume will be needed.
5 Appendix: Exposed-core fiber simulation
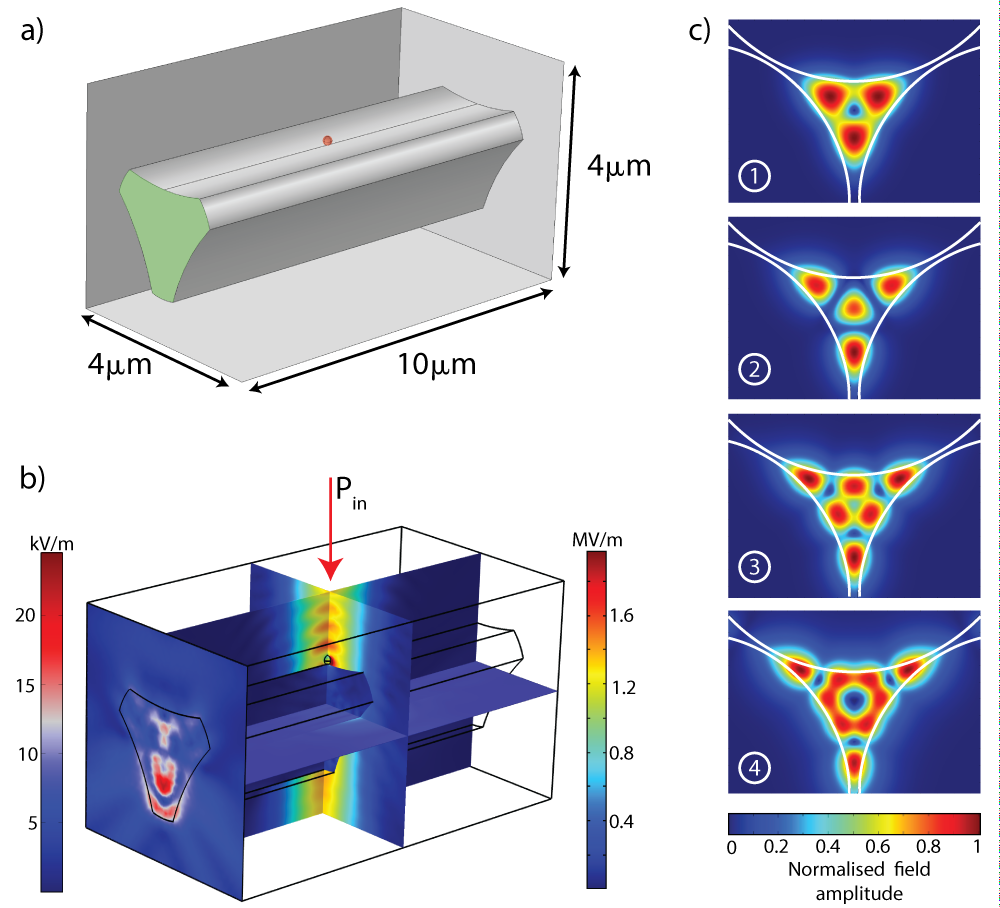
To simulate the exposed-core fiber sensor, we used the finite element simulation software COMSOL multiphysics. For simplicity, only the core of the exposed-core fiber made of silica was simulated in a 4m 4m 10m volume, as seen in Fig. 6a. The simulated volume was surrounded by a perfect matching layer (PML, not shown in the figure) to avoid contamination by back reflections. Because the PML material should be continuous with the simulation volume and made of a single material, we have immersed the core of the fiber in water and the air holes are also filled with water. A 780 nm Gaussian beam of 1 mW was focused on a nanoparticle on the fiber from the top and the electromagnetic field distribution was solved for the scattered field in the entire simulation volume. Two parameters were extracted from this simulation for a range of nanoparticle radii. The first one is the collected signal power , calculated using:
| (3) |
where is the surface at one end of the exposed-core fiber (see green surface in Fig. 6a, is the Poynting vector at the cartesian coordinates and is a unitary vector perpendicular to the surface . In Fig. 5a we have compared the normalized amplitude from the experiment with the amplitude of the collected signal power with a constant as explained in section 3.2. The second parameter extracted from the simulation is the scattered power from the nanoparticle which is obtain similarly by integrating the Poynting vector around the nanoparticle surface (red surface in Fig. 6a).
In Fig. 6b, the solution of the electric field norm is shown for a 100 nm silica particle. One can see that part of the incident field is reflected back to the top by the fiber and creates some interferences but most of the field is transmitted and exits the simulation volume from the bottom. The solution of the collected signal field is displayed by the cut at the left end of the fiber. One can see that the collected light is not only guided in the fundamental mode of the exposed-core fiber displayed in Fig. 1b. We believe the nanoparticle excites several modes supported by the exposed core fiber and the the cut of collected signal results from the interference between these modes. The first few modes are displayed in Fig. 6c and one can see that the collected signal could be mostly supported by the second and fourth mode.
Using eq. 3, the collected signal power calculated for a 100 nm silica particle is 5.310-4 mW and the scattered power is around 7.410-3 mW. From these two parameters, the collection efficiency can be calculated using which gives 7.2 percent for the 100 nm particle. For particles of other sizes, ranging from 10 nm to 200 nm, the calculated collection efficiency is between 1.7 and 8.1 percent. Note that the collection efficiency is actually twice this value as there are collected photons that propagate in the other direction, but are not detected.
Finally, to verify that our simulation is valid, a control simulation was performed with no particle and showed that the collected power at the end of the fiber was at least 6 orders of magnitude lower than when a 100 nm particle is present.
Funding:
This work was supported by a grant from the Air Force Office of Scientific Research (grant no. FA9550-17-10397). The authors would like to acknowledge ARC Centre of Excellence for Engineered Quantum Systems (CE110001013), ARC Centre of Excellence for Nanoscale Biophotonics (CE14010003) and the OptoFab node of the Australian National Fabrication Facility utilizing Commonwealth and South Australian State Government funding. W.P.B. acknowledges a fellowship from the Australian Research Council (FT140100650). S.C.W-S. acknowledges a Ramsay Fellowship from the University of Adelaide. L.P. acknowledges financial support from the China Scholarship Council.
Acknowledgments:
The authors thank Alastair Dowler and Evan Johnson from the University of Adelaide for the exposed-core fiber fabrication.
References
- [1] M. D. Baaske, M. R. Foreman, and F. Vollmer, “Single-molecule nucleic acid interactions monitored on a label-free microcavity biosensor platform,” \JournalTitleNature nanotechnology 9, 933 (2014).
- [2] N. Mauranyapin, L. Madsen, M. Taylor, M. Waleed, and W. Bowen, “Evanescent single-molecule biosensing with quantum-limited precision,” \JournalTitleNature Photonics 11, 477 (2017).
- [3] Y. Pang and R. Gordon, “Optical trapping of a single protein,” \JournalTitleNano letters 12, 402–406 (2011).
- [4] S. Faez, Y. Lahini, S. Weidlich, R. F. Garmann, K. Wondraczek, M. Zeisberger, M. A. Schmidt, M. Orrit, and V. N. Manoharan, “Fast, label-free tracking of single viruses and weakly scattering nanoparticles in a nanofluidic optical fiber,” \JournalTitleACS nano 9, 12349–12357 (2015).
- [5] E. Kim, M. D. Baaske, I. Schuldes, P. S. Wilsch, and F. Vollmer, “Label-free optical detection of single enzyme-reactant reactions and associated conformational changes,” \JournalTitleScience advances 3, e1603044 (2017).
- [6] M. D. Baaske and F. Vollmer, “Optical observation of single atomic ions interacting with plasmonic nanorods in aqueous solution,” \JournalTitleNature Photonics 10, 733 (2016).
- [7] J. D. Swaim, J. Knittel, and W. P. Bowen, “Detection of nanoparticles with a frequency locked whispering gallery mode microresonator,” \JournalTitleApplied Physics Letters 102, 183106 (2013).
- [8] S. Arnold, D. Keng, S. Shopova, S. Holler, W. Zurawsky, and F. Vollmer, “Whispering gallery mode carousel–a photonic mechanism for enhanced nanoparticle detection in biosensing,” \JournalTitleOptics Express 17, 6230–6238 (2009).
- [9] C. Chen, M. L. Juan, Y. Li, G. Maes, G. Borghs, P. Van Dorpe, and R. Quidant, “Enhanced optical trapping and arrangement of nano-objects in a plasmonic nanocavity,” \JournalTitleNano letters 12, 125–132 (2011).
- [10] U. Mirsaidov, W. Timp, K. Timp, M. Mir, P. Matsudaira, and G. Timp, “Optimal optical trap for bacterial viability,” \JournalTitlePhysical Review E 78, 021910 (2008).
- [11] M. P. Landry, P. M. McCall, Z. Qi, and Y. R. Chemla, “Characterization of photoactivated singlet oxygen damage in single-molecule optical trap experiments,” \JournalTitleBiophysical journal 97, 2128–2136 (2009).
- [12] S. Wäldchen, J. Lehmann, T. Klein, S. Van De Linde, and M. Sauer, “Light-induced cell damage in live-cell super-resolution microscopy,” \JournalTitleScientific reports 5, 15348 (2015).
- [13] L. Ma, S. Zhu, Y. Tian, W. Zhang, S. Wang, C. Chen, L. Wu, and X. Yan, “Label-free analysis of single viruses with a resolution comparable to that of electron microscopy and the throughput of flow cytometry,” \JournalTitleAngewandte Chemie International Edition 55, 10239–10243 (2016).
- [14] N. Luan and J. Yao, “Surface plasmon resonance sensor based on exposed-core microstructured optical fiber placed with a silver wire,” \JournalTitleIEEE Photonics Journal 8, 1–8 (2016).
- [15] E. P. Schartner, A. Dowler, and H. Ebendorff-Heidepriem, “Fabrication of low-loss, small-core exposed core microstructured optical fibers,” \JournalTitleOptical Materials Express 7, 1496–1502 (2017).
- [16] R. Kostecki, H. Ebendorff-Heidepriem, C. Davis, G. McAdam, S. C. Warren-Smith, and T. M. Monro, “Silica exposed-core microstructured optical fibers,” \JournalTitleOptical Materials Express 2, 1538–1547 (2012).
- [17] R. Kostecki, H. Ebendorff-Heidepriem, S. C. Warren-Smith, and T. M. Monro, “Predicting the drawing conditions for microstructured optical fiber fabrication,” \JournalTitleOptical Materials Express 4, 29–40 (2014).
- [18] X. Li, L. V. Nguyen, Y. Zhao, H. Ebendorff-Heidepriem, and S. C. Warren-Smith, “High-sensitivity sagnac-interferometer biosensor based on exposed core microstructured optical fiber,” \JournalTitleSensors and Actuators B: Chemical 269, 103–109 (2018).
- [19] L. V. Nguyen, K. Hill, S. Warren-Smith, and T. Monro, “Interferometric-type optical biosensor based on exposed core microstructured optical fiber,” \JournalTitleSensors and Actuators B: Chemical 221, 320–327 (2015).
- [20] S. C. Warren-Smith, E. Sinchenko, P. R. Stoddart, and T. M. Monro, “Distributed fluorescence sensing using exposed core microstructured optical fiber,” \JournalTitleIEEE Photonics Technology Letters 22, 1385–1387 (2010).
- [21] R. Kostecki, H. Ebendorff-Heidepriem, S. Afshar V., G. McAdam, C. Davis, and T. M. Monro, “Novel polymer functionalization method for exposed-core optical fiber,” \JournalTitleOptical Materials Express 4, 1515–1525 (2014).
- [22] L. S. Madsen, C. Baker, H. Rubinsztein-Dunlop, and W. P. Bowen, “Nondestructive profilometry of optical nanofibers,” \JournalTitleNano letters 16, 7333–7337 (2016).
- [23] J. D. Jackson, “Classical electrodynamics,” (1999).
- [24] M. A. Taylor and W. P. Bowen, “Quantum metrology and its application in biology,” \JournalTitlePhysics Reports 615, 1–59 (2016).
- [25] X.-C. Yu, B.-B. Li, P. Wang, L. Tong, X.-F. Jiang, Y. Li, Q. Gong, and Y.-F. Xiao, “Single nanoparticle detection and sizing using a nanofiber pair in an aqueous environment,” \JournalTitleAdvanced Materials 26, 7462–7467 (2014).
- [26] J. D. Swaim, J. Knittel, and W. P. Bowen, “Tapered nanofiber trapping of high-refractive-index nanoparticles,” \JournalTitleApplied Physics Letters 103, 203111 (2013).
- [27] J. D. Swaim, J. Knittel, and W. P. Bowen, “Detection limits in whispering gallery biosensors with plasmonic enhancement,” \JournalTitleApplied Physics Letters 99, 243109 (2011).