First Abundance Measurement of Organic Molecules in the Atmosphere of HH 212 Protostellar Disk
Abstract
HH 212 is one of the well-studied protostellar systems, showing the first vertically resolved disk with a warm atmosphere around the central protostar. Here we report a detection of 9 organic molecules (including newly detected ketene, formic acid, deuterated acetonitrile, methyl formate, and ethanol) in the disk atmosphere, confirming that the disk atmosphere is, for HH 212, the chemically rich component, identified before at a lower resolution as a “hot-corino”. More importantly, we report the first systematic survey and abundance measurement of organic molecules in the disk atmosphere within 40 au of the central protostar. The relative abundances of these molecules are similar to those in the hot corinos around other protostars and in Comet Lovejoy. These molecules can be either (i) originally formed on icy grains and then desorbed into gas phase or (ii) quickly formed in the gas phase using simpler species ejected from the dust mantles. The abundances and spatial distributions of the molecules provide strong constraints on models of their formation and transport in star formation. These molecules are expected to form even more complex organic molecules needed for life and deeper observations are needed to find them.
1 Introduction
Accretion disks have been detected in very young protostellar systems, feeding the central protostars. With the advent of the Atacama Large Millimeter/submillimeter Array (ALMA), we have started to resolve the disks and study their physical processes in great detail. HH 212 is one of the well-studied protostellar systems, showing the first vertically resolved disk with a warm atmosphere around the central protostar (Lee et al., 2017b, c). This warm atmosphere seems to be the hot corino reported recently at a lower angular resolution (Codella et al., 2016, 2018). Hot corinos are the hot ( K) and compact regions immediately around low-mass (sun-like) protostars (Ceccarelli et al., 2007), and rich in organic molecules including complex organic molecules (COMs, refering to C-bearing species with six atoms or more, Herbst & van Dishoeck, 2009). By determining the connection of the disk atmosphere with the hot corino in HH 212, we aim to determine the origin of the hot corino and the related physical processes in the innermost region. In particular, the nearly edge-on orientation of the disk in this system provides the best view of the atmosphere, allowing us to study the physical properties of the disk atmosphere, and the formation of the organic molecules and their role in producing the rich organic chemistry needed for life.
HH 212 is a young Class 0 protostellar system deeply embedded in a compact molecular cloud core in the L1630 cloud of Orion at a distance of 400 pc (Kounkel et al., 2017). The central source is IRAS 05413-0104, with a bolometric luminosity of 9 (updated for the new distance) (Zinnecker et al., 1992). The central protostar has a mass of 0.25 (Lee et al., 2017c). It drives a powerful bipolar jet (Zinnecker, McCaughrean, & Rayner, 1998; Lee et al., 2015), which is recently found to be spinning (Lee et al., 2017a). A rotating disk must have formed around the protostar in order to launch the jet. Our previous ALMA observations towards the center indeed showed a spatially resolved nearly edge-on dusty disk with a radius of 60 au (Lee et al., 2017b). In addition, we also detected a warm atmosphere of the disk with a few organic molecules (Lee et al., 2017c), suggesting that the warm disk atmosphere can be the hot corino reported before at a lower resolution (Codella et al., 2016). Recent observations at a resolution of (60 au) suggested that deuterated water and CH3CHO can also reside in the disk atmosphere (Codella et al., 2018). In this paper, we zoom in to the disk region at a higher resolution of (12 au) and higher sensitivity and detect additional and more complex organic molecules characteristic of a hot corino, with most of them detected for the first time in the disk atmosphere. Our observations confirm that the hot corino in HH 212 is indeed the warm disk atmosphere. We will discuss the formation of the organic molecules by comparing their abundances to those in hot corinos around other low-mass protostars.
2 Observations
The HH 212 protostellar system was observed with ALMA in Band 7 at 341.5 GHz in Cycle 5. Project ID was 2017.1.00044.S. Three observations were executed on the same day on 2017 November 27 with 47 antennas, with each observation having an integration time of 32.7 min on the target. Thus, the total time on the target was 98 minutes. The projected baselines were 60-8500 m. The correlator was set up to have 4 spectral windows, with 3 in continuum mode having a bandwidth of 2 GHz, and one in spectral mode having a bandwidth of 1.875 GHz. In this paper, we only report the results obtained with the spectral mode that covers the rest frequency from 345.635 to 347.510 GHz. The spectral resolution was 1.953 MHz per channel, resulting in a velocity resolution of 1.69 km s-1 per channel at 346.5 GHz. The primary beam was . A single pointing was used to map the system within of the central source. The maximum recoverable size scale was , enough to map the disk atmosphere without any significant missing flux.
The data were calibrated with the CASA package, with quasar J0510+1800 as a passband and flux calibrator, and quasar J0541-0211 (a flux of 0.137 Jy) as a gain calibrator. We used a robust factor of 0.5 for the visibility weighting to generate the channel maps with a synthesized beam of at a position angle of 78∘. We used the line-free channels to generate a continuum map centered at 356.5 GHz. The channel maps of the molecular lines were generated after continuum subtraction. The noise levels are 0.121 mJy beam-1 (or 1.13 K) in the continuum map and 0.80 mJy beam-1 (or 7.45 K) in the channel maps. The velocities in the channel maps are LSR velocities.
3 Results
In HH 212, the jet has an axis with a position angle of 23∘ and an inclination angle of 4∘ to the plane of the sky, with its northern component tilted toward us (Claussen et al., 1998). The disk is nearly edge-on and exactly perpendicular to the jet axis (Lee et al., 2017b). The systemic velocity is km s-1 LSR (Lee et al., 2014). In order to facilitate our presentations, we define an offset velocity and rotate our maps by 23∘ clockwise to align the jet axis in the vertical direction.
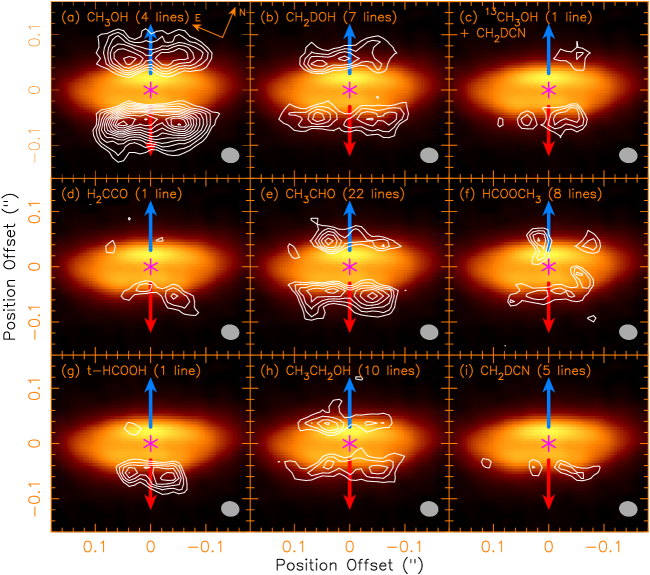
Figure 1 shows the emission line intensity maps (contours) of nine organic molecules, including CH3OH (methanol, 4 lines), CH2DOH (deuterated methanol, 7 lines), 13CH3OH (13C isotopologue of methanol, 1 line, contaminated by a much weaker CH2DCN line), H2CCO (ketene, 1 line), CH3CHO (acetaldehyde, 22 lines), HCOOCH3 (methyl formate, 8 lines), t-HCOOH (formic acid in trans state, 1 line), CH3CH2OH (ethanol, 10 lines), and CH2DCN (deuterated acetonitrile, 5 lines), on the continuum map (color image) of the disk at 865 m (or equivalently 347 GHz), obtained from our observations. As seen before at a similar wavelength ( 850 m) in Lee et al. (2017b), the continuum map shows a “hamburger-shaped” dusty disk with an equatorial dark lane sandwiched between two brighter features on the top and bottom. As discussed in that paper, the presence of the equatorial dark lane is due to relatively low temperature and high optical depth near the disk midplane. As discussed below, the maps of the molecular emissions are obtained by stacking a number of lines (as indicated above in the parenthesis) in different transitions with a range of upper energy levels for better detections. Molecular line emissions are only detected in the upper (above the midplane) and lower disk atmosphere, with the emission brighter in the lower disk atmosphere below the midplane. No molecular emission is detected toward the disk midplane, either because the emission is lost in the optically thick dust continuum emission or because of a lack of emission of these molecules there. All the molecular emissions are detected within the centrifugal barrier (which has a radius of or 44 au) of the central protostar. For CH3OH, CH2DOH, CH3CHO, and CH3CH2OH, their emissions are clearly detected in the upper and lower atmosphere with a roughly similar distribution, suggesting that they are chemically related. In addition, the emission moves closer to the disk midplane from CH3OH, CH2DOH, CH3CHO, to CH3CH2OH, suggesting that the emission of less abundant molecule (see next section for their abundances) traces deeper into the disk atmosphere, probably due to an optical depth effect. However, it could also be due to a chemical stratification in the vertical direction. CH2DOH and CH3CH2OH emission in the lower atmosphere in the outer edge show a structure curving back towards the midplane, following the lower boundary of the dusty disk emission, likely outlining a physical boundary for the dusty disk.
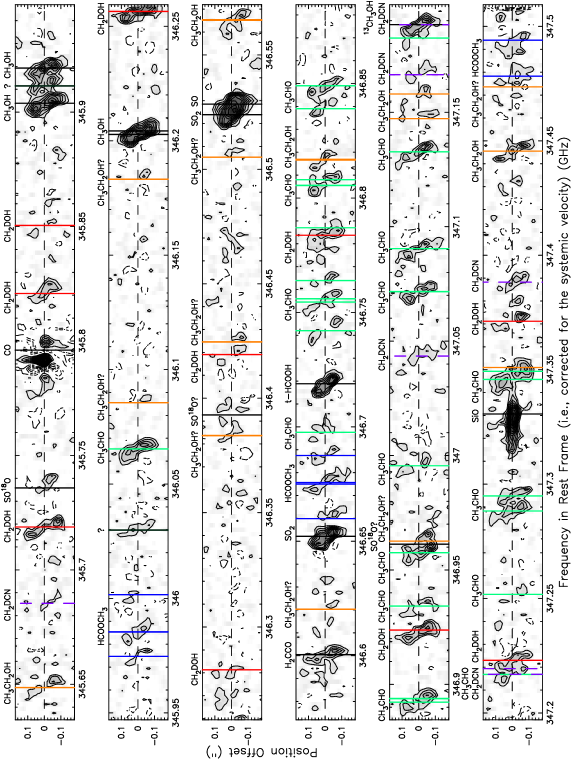
Figure 2 shows the position-frequency (PF) diagrams obtained with a cut along the lower atmosphere, where the emission is brighter, in order to identify the detections of various molecular lines. The PF diagrams for the upper atmosphere show similar structures but fainter and are thus not shown here. As can be seen, many lines are detected, with their emission detected within 5 MHz of their rest frequencies (or 4 km s-1 within the systemic velocity) marked by the vertical lines, with one color for each organic molecular species at different transitions. For each line, the diagrams show a roughly linear PF structure with the redshifted emission in the southeast (positive ) and blueshifted emission in the northwest (negative ), as seen before in the corresponding position-velocity diagrams for the CH3OH and CH2DOH lines (Lee et al., 2017c). As discussed in that paper, this linear PF structure likely arises from a warm rotating ring of the disk atmosphere near the centrifugal barrier. With this feature, we identify lines from the nine organic molecules mentioned above, and a few other simple molecules (e.g., SO, SO2 and its isotopologue SO18O). Other lines from CO and SiO trace mainly the outflow and jet, and thus do not show such a clear linear PF structure.
Table 1 lists the properties of the organic molecular lines. For each molecular species, we stacked the line intensity maps in different transitions, excluding those tentatively detected (marked with T) and blended (marked with B), producing the mean line intensity map shown in Figure 1.
3.1 Physical condition in the disk atmosphere
Here we derive the mean excitation temperature and column density in the disk atmosphere by fitting the rotation diagram of the molecular lines. This diagram plots the column density per statistical weight in the upper energy state in the optically thin limit, , versus the upper energy level of the lines. Here , where the integrated line intensity with being the brightness temperature.
The emission in the lower disk atmosphere is brighter and is thus used to better derive the mean excitation temperature and column density in the disk atmosphere. Table 1 lists the integrated line intensities in the lower disk atmosphere measured (with a cutoff of 2) for the reasonably isolated lines detected with more than . They are the mean values averaged over a rectangular region that covers most of the emission in the lower atmosphere. Figure 3 shows the resulting diagrams for the six molecules detected with multiple lines. The blended lines are excluded. With the CH3OH lines, we derived an excitation temperature of K. With the lines from its deuterated species CH2DOH, we derived a similar temperature of K. For a check, we also obtained similar temperatures of K and K for the upper atmosphere from the CH3OH lines and CH2DOH lines, respectively. The resulting column densities of CH3OH and CH2DOH are listed in Table 2. As discussed later, since the CH3OH lines are likely optically thick, the CH3OH column derived here is only a lower limit and a more accurate value will be derived using the 13CH3OH column density below.
From CH3OH and CH2DOH, we obtain a mean excitation temperature of K in the lower disk atmosphere, similar to that found before in Lee et al. (2017c). This mean temperature is also consistent with that derived towards the disk at a lower angular resolution in Bianchi et al. (2017). Assuming this mean temperature for the disk atmosphere, we can estimate the column densities of other molecules with weaker lines. For those molecules detected with multiple lines, such as CH3CHO, HCOOCH3, CH3CH2OH, and CH2DCN, we can obtain their column densities by fitting their rotation diagrams, as shown in Figures 3(c)-(f). Notice that the column density of CH3CHO is estimated here to be (1.50.6) cm-2, with the lower limit consistent with that estimated previously at a lower resolution with an excitation temperature of 7814 K in Codella et al. (2018). For those detected with a single line, such as 13CH3OH, H2CCO, and t-HCOOH, we derived their column densities from their measured integrated line intensity. For 13CH3OH, the only detected line is contaminated by a weaker line of CH2DCN and thus its column density is estimated after removing the expected intensity of the CH2DCN line. The expected intensity of the CH2DCN line is assumed to be given by the mean intensity of other CH2DCN lines with similar Eu and , and it is estimated to be 21 K km s-1, or 18% of the total intensity there. Also, since the 13CH3OH line is optically thinner than the CH3OH lines, we can improve the CH3OH column density by multiplying the 13CH3OH column density by a 12C/13C ratio of 50 as obtained in the Orion Complex (Kahane et al., 2018). As can be seen from Table 2, the CH3OH column density derived this way is about twice that derived from the rotation diagram, suggesting that the CH3OH lines are indeed optically thick. Also shown in the table are the column densities of NH2CHO, D2CO, and CH3SH measured in Lee et al. (2017c), adjusted with the mean excitation temperature here.
Based on our disk model that reproduced the dust continuum emission at a similar wavelength of 850 m (Lee et al., 2017b), the dust continuum emission in the disk atmosphere has an optical depth . Thus, the derived column densities of the organic molecules could be underestimated by a factor of . In that disk model, the disk atmosphere has a mean H2 column density of 3.8 cm-2. Hence, the abundances of the molecules, as listed in Table 2, can be obtained by dividing the column density of the molecules by this mean H2 column density. The abundances here can be uncertain by a factor a few because the mean H2 column density depends on dust opacity, which can be uncertain by a factor a few.
4 Discussion
4.1 Corino-like Disk Atmosphere
Hot corinos with a temperature 100 K have been detected around low-mass protostars and they are rich in organic molecules (including complex organic molecules). A hot corino has also been recently reported in HH 212 in the inner 100 au with a detection of CH3CHO and deuterated water HDO (Codella et al., 2016, 2018). Now at higher resolution, we find CH3CHO to reside in the disk atmosphere. Moreover, we also detect 8 other organic molecules (H2CCO, t-HCOOH, CH3OH, CH2DOH, 13CH3OH, CH2DCN, HCOOCH3, and CH3CH2OH) in the disk atmosphere, with an excitation temperature of 15050 K. Adding 3 other organic molecules (D2CO, CH3SH and NH2CHO) from Lee et al. (2017c), we have 12 organic molecules, with 9 of them being complex organic molecules, detected in the disk atmosphere. These results indicate that the hot corino in HH 212 is actually a warm atmosphere of the disk.
4.2 Formation of Organic Molecules
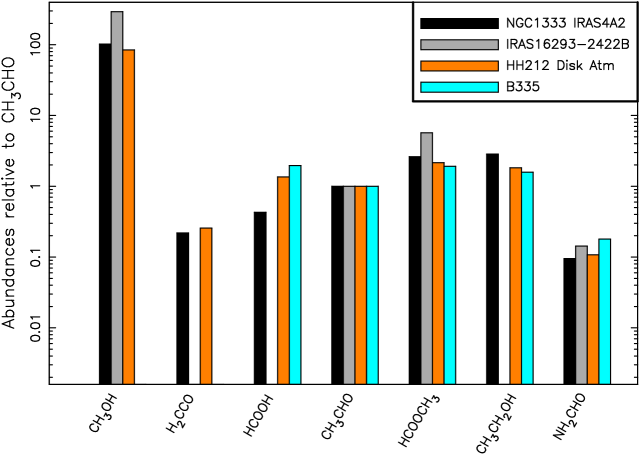
We can study the formation of the organic molecules in the disk atmosphere by comparing their abundances to those estimated in the hot corinos around other Class 0 low-mass protostars. The abundance of CH3CHO, which is commonly observed in hot corinos, is estimated here to be 3.9 in HH 212, similar to those found in other hot corinos, e.g., 5.8 in IRAS 16293-2422B (Jørgensen et al., 2016), 2.4 in B335 (Imai et al., 2016), and 4.2 in NGC 1333 IRAS4A2 (López-Sepulcre et al., 2017). To facilitate comparison, we calculate and compare the abundances of the organic molecules relative to CH3CHO. Figure 4 shows the comparison of the relative abundances of 7 organic molecules (excluding deuterated species and 13C isotopologue) to those in IRAS 16293-2422B (Jørgensen et al., 2016), B335 (Imai et al., 2016), and NGC 1333 IRAS4A2 (López-Sepulcre et al., 2017). In this comparison, CH3SH is excluded because of no reliable measurement of this molecule in other hot corinos to compare with. Interestingly, the relative abundances of most molecules here in HH 212 are similar to those in other hot corinos to within a factor of few, suggesting that the formation of these molecules in the disk atmosphere could be similar to that in other hot corinos. Notice that the abundance of CH3SH here is also consistent with that predicted in the hot corino, which can be as high as 5 (Majumdar et al., 2016). Moreover, the abundances here are also similar to those seen in the Class I corino SVS13-A (Bianchi et al., 2019) and to those seen in Comet Lovejoy, which shows similar abundances to IRAS 16293-2422B (Biver et al., 2015).
As discussed in Lee et al. (2017c), the high degree of deuteration in methanol (with [CH2DOH]/[CH3OH] ) and the detection of doubly deuterated formaldehyde suggest that the methanol and formaldehyde in the disk atmosphere are originally formed on icy grains and later desorbed (evaporated) into gas phase due to the heating possibly by low-velocity accretion shock near the centrifugal barrier or the radiation of the protostar. This heating can also be produced by an interaction with a wind/outflow from an inner region (Lee et al., 2018). The temperature of the disk atmosphere where the organic molecules are detected is similar to the freeze-out temperature of water, which is 150 K (Öberg et al., 2011). Thus, the detection of deuterated water in the disk atmosphere (Codella et al., 2018) supports that the two organic molecules are evaporated in the disk atmosphere where it is warm enough to release the water. However, how the other organic molecules are formed is still an open question and not necessarily on the grain surfaces.
In case the organic molecules are formed on the icy grains, they can be formed on the icy grains in the disk, as suggested in the TW Hya protoplanetary disk for the methanol (Walsh et al., 2016), either in situ on the surface or first in the midplane and then brought to the surface by turbulence (Furuya & Aikawa, 2014). Like the hot corinos, it is also possible that the molecules already formed on the icy grains in the prestellar core, and then brought in to the disk surface. CO is frozen onto to the grains at the temperature of 20 K (Öberg et al., 2011). One possible scenario (although to be proven) is that, in the regions such as prestellar cores and probably disk midplane where the temperature is below 20 K, CO-rich ices on dust grains can undergo addition reactions with H (and D), O, C, and N atoms accreted from the gas, producing a rich organic chemistry on the grains, as proposed in Charnley & Rodgers (2008).
Having said that, some of the organic molecules could also be quickly formed in the gas phase using simpler species released from grains. This could be the case for formamide, which was found to be mainly formed in the gas phase in a young shocked region such as L1157-B1 (Codella et al., 2017). In addition, acetaldehyde can also be formed in gas phase, as suggested in Charnley (2004).
These organic molecules are of great importance for forming even more complex organic molecules such as amino acids and amino sugars, which are the building blocks of life. Our observations clearly show that they have formed in a disk or been brought in to a disk in the earliest phase of star formation and may play a crucial role in producing the rich organic chemistry needed for life. It is also tempting to estimate the alcohol degree in the disk atmosphere. According to Codella et al. (2018), the column density of deuterated water is cm-2. Assuming [H/D] [CH3OH/CH2DOH] 8.1, then the column density of the water is cm-2. With the derived column density of ethanol in Table 2, and the molecular mass of ethanol of 46 and water of 18, the alcohol degree by mass is estimated to be 2.8%, and thus could be similar to that of a regular beer.
4.3 Possible Disk Wind?
Methanol and acetaldehyde have been argued to trace a disk wind in HH 212 (Leurini et al., 2016; Codella et al., 2018). Now in observations at higher resolution, they seem to trace mainly a ring of disk atmosphere near the centrifugal barrier, which could in principle be heated by a weak (accretion) shock produced by the rapid decrease of the infall velocity near the centrifugal barrier. However, since their maps also show small extensions extending out from the disk (see Figure 1), they may also trace a wind coming out from the disk surface. Nonetheless, since these extensions appear to be surrounding the SO outflow shell detected further in Lee et al. (2018), they could also be the disk atmosphere pushed away by the SO outflow shell. Detailed kinematic study of these extensions with the SO outflow shell are needed to check these scenarios.
5 Conclusions
The nearly edge-on orientation of the disk in HH 212 provides the best view of the disk atmosphere. Here we have detected 9 organic molecules in the disk atmosphere. These molecules are characteristic of a hot corino and found here to be in the disk atmosphere, confirming that the corino here is a warm disk atmosphere. Adding 3 other organic molecules from our previous study, we have detected 12 organic molecules, with 9 of them being complex organic molecules, in the disk atmosphere within 40 au of the central protostar. These molecules seem to arise mainly from a ring of disk atmosphere near the centrifugal barrier. Some of them may also trace a wind coming out from the disk surface.
The relative abundances of the organic molecules in the HH 212 disk atmosphere are similar to those in hot corinos around other low-mass protostars and even to those in Comet Lovely. It would be interesting to determine whether the hot corinos around other low-mass protostars are also located in their disk atmospheres or not, perhaps through higher resolution ALMA observations. In addition, the formation mechanism of the organic molecules can also be similar to that in those corinos. The organic molecules can originally formed on icy grains, either in the disk or in the prestellar core and then brought in to the disk, and then desorbed (evaporated) into the gas phase. They can also be quickly formed in the gas phase using simpler species ejected from the dust mantles.
References
- Bianchi et al. (2017) Bianchi, E., Codella, C., Ceccarelli, C., et al. 2017, MNRAS, 467, 3011
- Bianchi et al. (2019) Bianchi, E., Codella, C., Ceccarelli, C., et al. 2019, MNRAS, 483, 1850
- Biver et al. (2015) Biver, N., Bockelée-Morvan, D., Moreno, R., et al. 2015, Science Advances, 1, 1500863
- Bizzocchi et al. (2014) Bizzocchi, L., Caselli, P., Spezzano, S., & Leonardo, E. 2014, A&A, 569, A27
- Ceccarelli et al. (2007) Ceccarelli, C., Caselli, P., Herbst, E., Tielens, A. G. G. M., & Caux, E. 2007, Protostars and Planets V, 47
- Charnley (2004) Charnley, S. B. 2004, Advances in Space Research, 33, 23
- Charnley & Rodgers (2008) Charnley, S. B., & Rodgers, S. D. 2008, Space Sci. Rev., 138, 59
- Claussen et al. (1998) Claussen, M.J., Marvel., K.B., Wootten, A., Wilking, B.A. 1998, ApJL, 507, L79
- Codella et al. (2016) Codella, C., Ceccarelli, C., Cabrit, S., et al. 2016, A&A, 586, L3
- Codella et al. (2017) Codella, C., Ceccarelli, C., Caselli, P., et al. 2017, A&A, 605, L3
- Codella et al. (2018) Codella, C., Bianchi, E., Tabone, B., et al. 2018, A&A, 617, A10
- Furuya & Aikawa (2014) Furuya, K., & Aikawa, Y. 2014, ApJ, 790, 97
- Herbst & van Dishoeck (2009) Herbst, E., & van Dishoeck, E. F. 2009, ARA&A, 47, 427
- Imai et al. (2016) Imai, M., Sakai, N., Oya, Y., et al. 2016, ApJ, 830, L37
- Jørgensen et al. (2016) Jørgensen, J. K., van der Wiel, M. H. D., Coutens, A., et al. 2016, A&A, 595, A117
- Kahane et al. (2018) Kahane, C., Jaber Al-Edhari, A., Ceccarelli, C., et al. 2018, ApJ, 852, 130
- Kounkel et al. (2017) Kounkel, M., Hartmann, L., Loinard, L., et al. 2017, ApJ, 834, 142
- Lee et al. (2018) Lee, C.-F., Li, Z.-Y., Codella, C., et al. 2018, ApJ, 856, 14
- Lee et al. (2017a) Lee, C.-F., Ho, P. T. P., Li, Z.-Y., et al. 2017a, Nature Astronomy, 1, 0152
- Lee et al. (2017b) Lee, C.-F., Li, Z.-Y., Ho, P. T. P., et al. 2017b, Science Advances, 3, e1602935
- Lee et al. (2017c) Lee, C.-F., Li, Z.-Y., Ho, P. T. P., et al. 2017c, ApJ, 843, 27
- Lee et al. (2015) Lee, C.-F., Hirano, N., Zhang, Q., et al. 2015, ApJ, 805, 186
- Lee et al. (2014) Lee, C.-F., Hirano, N., Zhang, Q., et al. 2014, ApJ, 786, 114
- Leurini et al. (2016) Leurini, S., Codella, C., Cabrit, S., et al. 2016, A&A, 595, L4
- López-Sepulcre et al. (2017) López-Sepulcre, A., Sakai, N., Neri, R., et al. 2017, A&A, 606, A121
- Majumdar et al. (2016) Majumdar, L., Gratier, P., Vidal, T., et al. 2016, MNRAS, 458, 1859
- Milam et al. (2005) Milam, S. N., Savage, C., Brewster, M. A., Ziurys, L. M., & Wyckoff, S. 2005, ApJ, 634, 1126
- Öberg et al. (2011) Öberg, K. I., Murray-Clay, R., & Bergin, E. A. 2011, ApJ, 743, L16
- Walsh et al. (2016) Walsh, C., Loomis, R. A., Öberg, K. I., et al. 2016, ApJ, 823, L10
- Zinnecker, McCaughrean, & Rayner (1998) Zinnecker, H., McCaughrean, M. J. & Rayner, J. T. 1998, Natur, 394, 862
- Zinnecker et al. (1992) Zinnecker, H. , Bastien, P. , Arcoragi, J. -P. & Yorke, H. W. 1992, A&A, 265, 726

| Transition | Frequency | log() | Line | ||
|---|---|---|---|---|---|
| QNs | (MHz) | (s-1) | (K) | (K km s-1) | List |
| t-HCOOH 15( 2,13)-14( 2,12) | 346718.85 | -3.331 | 144.457 | 147 | CDMS |
| H2CCO 17( 1,16)-16( 1,15) | 346600.45 | -3.325 | 162.789 | 79 | JPL |
| CH3OH 16(1)- - 15(2)- | 345903.91 | -4.044 | 332.653 | 234 | JPL |
| CH3OH 18(-3) - 17(-4), E2 | 345919.26 | -4.136 | 459.435 | 200 | JPL |
| CH3OH 5(4)- - 6(3)- | 346202.71 | -4.662 | 115.162 | 129m | JPL |
| CH3OH 5(4)+ - 6(3)+ | 346204.27 | -4.662 | 115.162 | 129m | JPL |
| 13CH3OH 14( 1,13)- 14( 0,14) - + | 347188.28 | -3.360 | 254.251 | 96† | CDMS |
| CH2DOH 3(2,1) - 2(1,2), e1 | 345718.71 | -4.373 | 39.434 | 51 | JPL |
| CH2DOH 19(1,19) - 18(2,17), e1 | 345820.79 | -4.531 | 418.032 | B | JPL |
| CH2DOH 22(4,19) - 22(3,19), e1 | 345850.48 | -3.888 | 613.625 | 16m | JPL |
| CH2DOH 3(1,2) - 3(0,3), e1 | 346256.50 | -3.699 | 29.488 | 152 | JPL |
| CH2DOH 22(4,18) - 22(3,20), e1 | 346281.30 | -3.874 | 613.621 | 16m | JPL |
| CH2DOH 21(4,18) - 21(3,18), e1 | 346419.06 | -3.886 | 566.562 | 13 | JPL |
| CH2DOH 21(4,17) - 21(3,19), e1 | 346783.70 | -3.876 | 566.559 | B | JPL |
| CH2DOH 20(4,17) - 20(3,17), e1 | 346923.75 | -3.886 | 521.634 | 85 | JPL |
| CH2DOH 20(4,16) - 20(3,18), e1 | 347222.99 | -3.878 | 521.632 | B | JPL |
| CH2DOH 19(4,16) - 19(3,16), e1 | 347371.16 | -3.887 | 478.841 | 18 | JPL |
| CH2DCN 20( 1,20)-19( 1,19) | 345685.36 | -2.444 | 179.628 | 12 | JPL |
| CH2DCN 20( 0,20)-19( 0,19) | 347043.43 | -2.438 | 174.955 | 27 | JPL |
| CH2DCN 20( 4,17)-19( 4,16) | 347166.47 | -2.455 | 261.246 | 13m | JPL |
| CH2DCN 20( 4,16)-19( 4,15) | 347166.48 | -2.455 | 261.246 | 13m | JPL |
| CH2DCN 20( 2,19)-19( 2,18) | 347188.29 | -2.441 | 196.562 | B | JPL |
| CH2DCN 20( 3,18)-19( 3,17) | 347216.91 | -2.447 | 223.527 | B | JPL |
| CH2DCN 20( 3,17)-19( 3,16) | 347219.39 | -2.447 | 223.527 | B | JPL |
| CH2DCN 20( 2,18)-19( 2,17) | 347388.21 | -2.441 | 196.615 | 24 | JPL |
| CH3CHO vt=1, 18(2,17) - 17(2,16), E | 346065.34 | -2.838 | 371.350 | 90 | JPL |
| CH3CHO v=0, 18(11, 7) - 17(11, 6), E | 346697.59 | -3.028 | 430.543 | T | JPL |
| CH3CHO v=0, 18(10, 8) - 17(10, 7), E | 346742.00 | -2.986 | 383.352 | 16 | JPL |
| CH3CHO v=0, 18(11, 8) - 17(11, 7), E | 346754.52 | -3.028 | 430.451 | 12m | JPL |
| CH3CHO v=0, 18(11, 8) - 17(11, 7), E | 346755.92 | -3.028 | 430.474 | 12m | JPL |
| CH3CHO v=0, 18(11, 7) - 17(11, 6), E | 346755.92 | -3.028 | 430.474 | 12m | JPL |
| CH3CHO v=0, 18(10, 9) - 17(10, 8), E | 346763.91 | -2.985 | 383.297 | 30 | JPL |
| CH3CHO v=0, 18(9, 9) - 17(9, 8), E | 346787.03 | -2.950 | 340.618 | B | JPL |
| CH3CHO v=0, 18(10, 8) - 17(10, 7), E | 346805.46 | -2.985 | 383.258 | S | JPL |
| CH3CHO v=0, 18(10, 9) - 17(10, 8), E | 346805.46 | -2.985 | 383.258 | S | JPL |
| CH3CHO v=0, 18(9, 10) - 17(9, 9), E | 346807.99 | -2.950 | 340.612 | S | JPL |
| CH3CHO v=0, 18(8,10) - 17(8, 9), E | 346839.03 | -2.920 | 302.406 | 23 | JPL |
| CH3CHO v=0, 18(9,10) - 17(9, 9), E | 346849.06 | -2.950 | 340.535 | 30m | JPL |
| CH3CHO v=0, 18(9, 9) - 17(9, 8), E | 346849.06 | -2.950 | 340.535 | 30m | JPL |
| CH3CHO v=0, 18(8,11) - 17(8,10), E | 346892.18 | -2.920 | 302.343 | S | JPL |
| CH3CHO v=0, 18(8,11) - 17(8,10), E | 346893.81 | -2.920 | 302.316 | S | JPL |
| CH3CHO v=0, 18(8,10) - 17(8, 9), E | 346893.81 | -2.920 | 302.316 | S | JPL |
| CH3CHO v=0, 18(7,11) - 17(7,10), E | 346934.22 | -2.896 | 268.661 | B | JPL |
| CH3CHO v=0, 18(7,12) - 17(7,11), E | 346957.55 | -2.896 | 268.606 | B | JPL |
| CH3CHO v=0, 18(7,11) - 17(7,10), E | 346957.55 | -2.896 | 268.606 | B | JPL |
| CH3CHO v=0, 18(7,12) - 17(7,11), E | 346995.53 | -2.896 | 268.572 | 24 | JPL |
| CH3CHO v=0, 18(6,13) - 17(6,12), E | 347071.54 | -2.875 | 239.399 | 33m | JPL |
| CH3CHO v=0, 18(6,12) - 17(6,11), E | 347071.68 | -2.875 | 239.399 | 33m | JPL |
| CH3CHO v=0, 18(6,12) - 17(6,11), E | 347090.40 | -2.875 | 239.397 | 33m | JPL |
| CH3CHO v=0, 18(6,13) - 17(6,12), E | 347132.68 | -2.875 | 239.321 | 33 | JPL |
| CH3CHO vt=1, 18(4,14) - 17(4,13), E | 347182.41 | -2.845 | 400.378 | B | JPL |
| CH3CHO vt=1, 18(5,13) - 17(5,12), E | 347216.79 | -2.859 | 420.440 | B | JPL |
| CH3CHO vt=1, 18(5,14) - 17(5,13), E | 347251.82 | -2.858 | 419.672 | T | JPL |
| CH3CHO v=0, 18(5,14) - 17(5,13), E | 347288.26 | -2.858 | 214.697 | 53 | JPL |
| CH3CHO v=0, 18(5,13) - 17(5,12), E | 347294.87 | -2.858 | 214.698 | 115 | JPL |
| CH3CHO v=0, 18(5,13) - 17(5,12), E | 347345.71 | -2.858 | 214.640 | B | JPL |
| CH3CHO v=0, 18(5,14) - 17(5,13), E | 347349.27 | -2.858 | 214.611 | B | JPL |
| HCOOCH3 v=0 28(12,16)-27(12,15) E | 345974.66 | -3.287 | 335.433 | 11m | JPL |
| HCOOCH3 v=0 28(12,17)-27(12,16) A | 345985.38 | -3.287 | 335.434 | 11m | JPL |
| HCOOCH3 v=0 28(12,16)-27(12,15) A | 345985.38 | -3.287 | 335.434 | 11m | JPL |
| HCOOCH3 v=0 28(12,17)-27(12,16) E | 346001.61 | -3.287 | 335.430 | 11m | JPL |
| HCOOCH3 v=0 28(11,17)-27(11,16) E | 346659.86 | -3.269 | 320.394 | B | JPL |
| HCOOCH3 v=0 28(11,18)-27(11,17) A | 346674.98 | -3.269 | 320.395 | 22m | JPL |
| HCOOCH3 v=0 28(11,17)-27(11,16) A | 346675.64 | -3.269 | 320.396 | 22m | JPL |
| HCOOCH3 v=0 28(11,18)-27(11,17) E | 346687.46 | -3.269 | 320.391 | 22m | JPL |
| HCOOCH3 v=0 27( 5,22)-26( 5,21) E | 347478.25 | -3.211 | 247.252 | B | JPL |
| HCOOCH3 v=0 27( 5,22)-26( 5,21) A | 347493.96 | -3.211 | 247.256 | 30 | JPL |
| g-CH3CH2OH 20( 3,18)-19( 3,17) vt=0-0 | 345648.57 | -3.436 | 242.486 | 27 | JPL |
| g-CH3CH2OH 20(10,10)-19(10, 9) vt=1-1 | 346085.56 | -3.549 | 358.843 | T | JPL |
| g-CH3CH2OH 20(10,11)-19(10,10) vt=1-1 | 346085.56 | -3.549 | 358.843 | T | JPL |
| g-CH3CH2OH 20( 9,12)-19( 9,11) vt=1-1 | 346183.19 | -3.522 | 335.566 | T | JPL |
| g-CH3CH2OH 20( 9,11)-19( 9,10) vt=1-1 | 346183.19 | -3.522 | 335.566 | T | JPL |
| g-CH3CH2OH 20(11,10)-19(11, 9) vt=0-0 | 346383.64 | -3.580 | 379.110 | 5m | JPL |
| g-CH3CH2OH 20(11, 9)-19(11, 8) vt=0-0 | 346383.64 | -3.580 | 379.110 | 5m | JPL |
| g-CH3CH2OH 20(10,11)-19(10,10) vt=0-0 | 346424.58 | -3.548 | 353.452 | T | JPL |
| g-CH3CH2OH 20(10,10)-19(10, 9) vt=0-0 | 346424.58 | -3.548 | 353.452 | T | JPL |
| g-CH3CH2OH 20( 9,12)-19( 9,11) vt=0-0 | 346505.34 | -3.521 | 330.252 | T | JPL |
| g-CH3CH2OH 20( 9,11)-19( 9,10) vt=0-0 | 346505.34 | -3.521 | 330.252 | T | JPL |
| g-CH3CH2OH 20( 7,14)-19( 7,13) vt=1-1 | 346565.08 | -3.479 | 296.366 | 22m | JPL |
| g-CH3CH2OH 20( 7,13)-19( 7,12) vt=1-1 | 346565.39 | -3.479 | 296.366 | 22m | JPL |
| g-CH3CH2OH 20( 8,13)-19( 8,12) vt=0-0 | 346620.32 | -3.498 | 309.511 | T | JPL |
| g-CH3CH2OH 20( 8,12)-19( 8,11) vt=0-0 | 346620.33 | -3.498 | 309.511 | T | JPL |
| g-CH3CH2OH 20( 7,14)-19( 7,13) vt=0-0 | 346816.58 | -3.478 | 291.241 | 12m | JPL |
| g-CH3CH2OH 20( 7,13)-19( 7,12) vt=0-0 | 346816.92 | -3.478 | 291.241 | 12m | JPL |
| t-CH3CH2OH 21( 0,21)-20( 1,20) | 346962.59 | -3.616 | 185.843 | B | JPL |
| g-CH3CH2OH 20( 6,15)-19( 6,14) vt=0-0 | 347147.20 | -3.461 | 275.456 | 13 | JPL |
| g-CH3CH2OH 20( 6,14)-19( 6,13) vt=0-0 | 347157.99 | -3.461 | 275.457 | 9 | JPL |
| t-CH3CH2OH 14( 3,12)-13( 2,11) | 347350.92 | -3.757 | 99.660 | B | JPL |
| t-CH3CH2OH 21( 1,21)-20( 0,20) | 347445.52 | -3.573 | 185.853 | 41 | JPL |
| g-CH3CH2OH 20( 5,16)-19( 5,15) vt=1-1 | 347473.56 | -3.447 | 267.087 | B | JPL |
| Species | Excitation Temperature | Column Density | Abundance† |
|---|---|---|---|
| (K) | (cm-2) | ||
| CH3OH…a | () | () | |
| CH3OH…b | () | () | |
| CH2DOH | () | () | |
| 13CH3OHd | () | () | |
| H2CCO | () | () | |
| t-HCOOH | () | () | |
| CH2DCN | () | () | |
| CH3CHO | () | () | |
| HCOOCH3 | () | () | |
| CH3CH2OH | () | () | |
| CH3SHe | () | () | |
| NH2CHOe | () | () | |
| D2COe | () | () |