The tidal disruption event AT2017eqx: spectroscopic evolution from hydrogen rich to poor suggests an atmosphere and outflow
Abstract
We present and analyse a new tidal disruption event (TDE), AT2017eqx at redshift , discovered by Pan-STARRS and ATLAS. The position of the transient is consistent with the nucleus of its host galaxy; the spectrum shows a persistent blackbody temperature K with broad H I and He II emission; and it peaks at a blackbody luminosity of erg s-1. The lines are initially centered at zero velocity, but by 100 days the H I lines disappear while the He II develops a blueshift of km s-1. Both the early- and late-time morphologies have been seen in other TDEs, but the complete transition between them is unprecedented. The evolution can be explained by combining an extended atmosphere, undergoing slow contraction, with a wind in the polar direction becoming visible at late times. Our observations confirm that a lack of hydrogen a TDE spectrum does not indicate a stripped star, while the proposed model implies that much of the diversity in TDEs may be due to the observer viewing angle. Modelling the light curve suggests AT2017eqx resulted from the complete disruption of a solar-mass star by a black hole of M⊙. The host is another Balmer-strong absorption galaxy, though fainter and less centrally concentrated than most TDE hosts. Radio limits rule out a relativistic jet, while X-ray limits at 500 days are among the deepest for a TDE at this phase.
keywords:
accretion, accretion disks – galaxies: nuclei – black hole physics1 Introduction
A tidal disruption event (TDE) occurs when an unfortunate star passes so close to a supermassive black hole (SMBH) that the tidal force of the SMBH exceeds the self-gravity of the star (Hills, 1975). If this takes place outside of the Schwarzschild radius, the result is a luminous flare with erg s-1, powered either by accretion onto the SMBH (Kochanek, 1994; Jiang et al., 2016b; Lodato, 2012; Piran et al., 2015). Observationally, these are differentiated from more common transients like supernovae by their higher blackbody temperatures ( K) and coincidence with the centres of galaxies.
Although TDEs were initially expected to peak at X-ray wavelengths if they are powered by accretion (Komossa, 2002), TDE candidates have now been discovered in the rest-frame UV and optical by surveys such as SDSS (van Velzen et al., 2011), Pan-STARRS (Gezari et al., 2012; Chornock et al., 2014; Blanchard et al., 2017; Holoien et al., 2018b), ASASSN (Holoien et al., 2014, 2016a, 2016b), OGLE (Wyrzykowski et al., 2017), PTF (Arcavi et al., 2014; Hung et al., 2017; Blagorodnova et al., 2017, 2019) and ZTF (van Velzen et al., 2019). Up to of these events are in fact faint in X-rays (Auchettl et al., 2017), suggesting either that some events are not powered by direct accretion, or that X-rays can only escape along certain sight-lines (Dai et al., 2018).
TDEs have been found in galaxies with stellar masses ranging from M⊙ (van Velzen, 2018; Wevers et al., 2017, 2019a), corresponding to black hole masses M⊙ (Mockler et al., 2019), and even greater in the case of rapidly rotating SMBHs (Leloudas et al., 2016). They provide a novel way to probe the properties of otherwise dormant SMBHs and their environments, especially at the lower end of the mass spectrum. TDEs are more common in galaxies with a high stellar mass surface density and a centrally-concentrated light profile (Law-Smith et al., 2017; Graur et al., 2018), but there remains an unexplained over-representation of Balmer-strong absorption galaxies (Arcavi et al., 2014; French et al., 2016; French & Zabludoff, 2018).
Studying TDEs is complicated by the wide diversity in their observed characteristics, in the optical, X-rays and radio (Auchettl et al., 2017; Zauderer et al., 2011; Levan et al., 2011; van Velzen et al., 2016; Alexander et al., 2016). Their optical spectra can exhibit lines of H I, He II, or both (Arcavi et al., 2014), but usually retain their spectroscopic signatures over time. A few instead show broad absorption lines (Chornock et al., 2014; Leloudas et al., 2016). More recently, metal lines have been detected in some TDEs (Blagorodnova et al., 2019; Brown et al., 2018; Leloudas et al., 2019; Wevers et al., 2019b), while yet others show spectra dominated by pre-existing broad-line and narrow-line regions from an active galactic nucleus (Blanchard et al., 2017; Kankare et al., 2017). Determining the nature of line formation in TDEs is key to understanding the physical processes in these events (e.g. Guillochon et al., 2014; Roth & Kasen, 2018).
In this paper, we present a new TDE, AT2017eqx, which we observed to undergo a radical evolution in its spectroscopic properties over time. The spectrum initially showed prominent Balmer and He II emission lines centred at close to zero velocity. Later spectra showed no evidence for hydrogen emission, while the He II feature became blueshifted by km s-1. Both of these morphologies have been observed before in other TDEs, but to our knowledge such a transition within the same event has not. Understanding this evolution can shed new light on the geometry and line-formation in these events.
Our study is organised as follows. We describe the discovery of AT2017eqx in section 2 and detail our multiwavelength follow-up observations in section 3. We analyze the light curve in section 4 to derive bolometric properties and infer physical parameters. We present and interpret the surprising spectroscopic evolution in section 5. In section 6, we study the host galaxy in the context of other TDE hosts, before concluding in section 7.
2 Discovery and classification
AT2017eqx (survey name, PS17dhz) was discovered by the PanSTARRS Survey for Transients (Chambers et al., 2016) on 2017-06-07 UT, at right ascension 22h 26m 48.370s, declination 17∘ 08’ 52.40”. The source was coincident with the centre of a galaxy catalogued in the Sloan Digital Sky Survey as SDSS J222648.38+170852.2, with an apparent magnitude of mag in Data Release 14 (Abolfathi et al., 2018). We determined the offset of AT2017eqx from the nucleus of this galaxy using a deep -band image of the transient obtained with LDSS3 on 2017-07-22 and an archival pre-disruption image from PanSTARRS DR1 (Flewelling et al., 2016). We geometrically aligned these images, with 30 common stars for reference, using the geomap and geotran tasks in pyraf. After transforming to a common coordinate grid and measuring the centroids of the transient and host galaxy, we find a relative offset of . Thus the origin of the source is fully consistent with the nucleus of the galaxy.
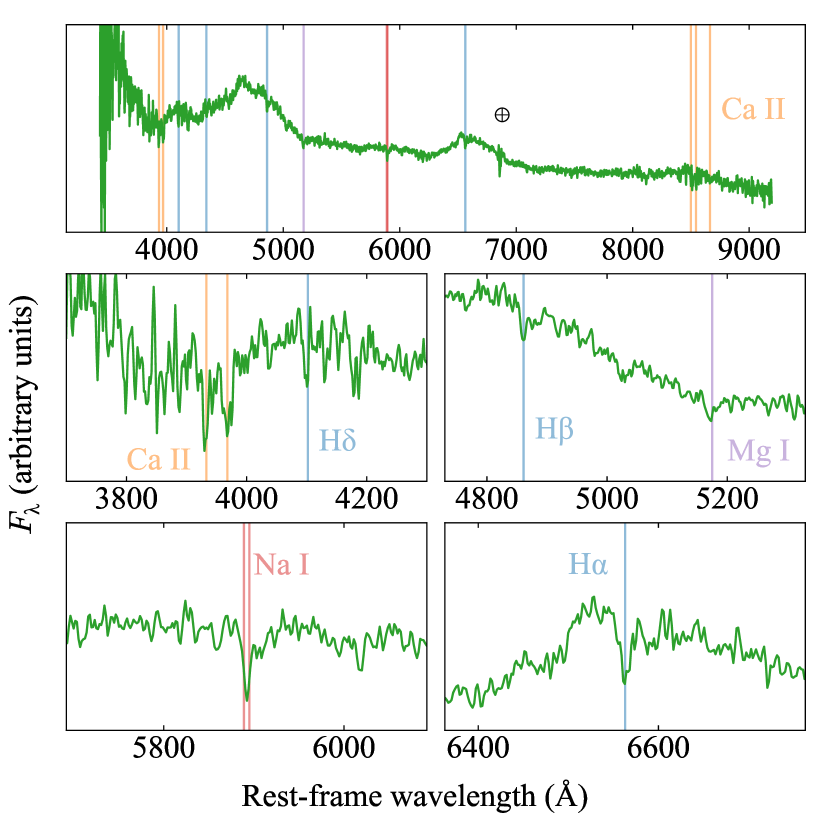
We observed AT2017eqx spectroscopically, beginning on 28-06-2017, as part of a search for nuclear transients. The spectrum with the highest signal-to-noise ratio is shown in Figure 1. Our observations show the hallmarks of TDEs: a blue continuum, with a roughly constant blackbody temperature of (2–3) K, and emission lines with widths km s-1. We also detect narrow absorption lines from the host galaxy, from which we measure the redshift . The host is a Balmer-strong absorption galaxy – a rare type of galaxy that is greatly over-represented among TDE hosts (Arcavi et al., 2014; French et al., 2016; Law-Smith et al., 2017; Graur et al., 2018).
The field was frequently monitored by the Asteroid Terrestrial-impact Last Alert System (Tonry et al., 2018). The ATLAS automated search pipeline triggers on detections (Stalder et al., 2017; Tonry et al., 2018) and no new source (with multiple detections) was found by the pipeline. We applied forced photometry on template-subtracted images at the transient coordinates, and manually binned the resulting magnitudes to a nightly cadence. This resulted in several 3 detections in the ATLAS -band, including one prior to the PSST discovery. Synthetic photometry on our earliest spectrum of the transient indicates a colour mag at the time of discovery, in some tension with the PanSTARRS and ATLAS photometry ( mag). While not entirely explained, this may be related to a broad emission feature at the blue edge of the -band. To compensate, we added a constant shift of 0.31 mag to all ATLAS measurements so that the colour is consistent with the higher signal-to-noise ratio PanSTARRS photometry.
3 Follow-up observations
3.1 Photometry
We imaged AT2017eqx in the optical filters using the Inamori Magellan Areal Camera and Spectrograph (IMACS) (Dressler et al., 2011) and the Low Dispersion Survey Spectrograph 3 (LDSS3) on the 6.5-m Magellan Baade and Clay telescopes at Las Campanas Observatory, and KeplerCam on the 1.2-m telescope at Fred Lawrence Whipple Observatory (FLWO). All images were reduced using pyraf to apply bias subtraction and flat-fielding. Photometry was measured using a custom wrapper for daophot, using stars in the field from PanSTARRS Data Release 1 (Flewelling et al., 2016) to determine the point-spread function (PSF) and photometric zeropoint of each image. We downloaded Pan-STARRS1 DR1 images (Flewelling et al., 2016) as templates for the field and convolved and subtracted them from the images using the hotpants algorithm (Becker, 2015) to isolate the transient, before measuring its flux with the PSF model.
We also observed AT2017eqx in with the 1-m Swope Telescope at Las Campanas Observatory. The data were reduced using the photpipe photometry and difference imaging pipeline (Rest et al., 2005; Kilpatrick et al., 2018). photpipe is a flexible software package that performs optimal bias-subtraction and flat-fielding, image stitching, astrometry, and photometry using dophot (Schechter et al., 1993). We again subtracted PS1 reference images using hotpants. Final photometry was performed on the difference images using dophot.
We obtained further images on 2017-08-16 with the low-resolution imaging spectrograph (LRIS) on the Keck-I 10-m telescope on Mauna Kea, Hawaii. Observations were performed in the blue and red channels simultaneously with the filters and filters and the D560 dichroic, and reduced using photpipe. For our photometric calibration, we used secondary calibrators in each image with magnitudes derived from SDSS standard stars transformed to the BVRI system (Bilir et al., 2011; Alam et al., 2015). Difference imaging was performed using PS1 -band images for the - and -band images, -band images for the -band images, and -band for the -band images.
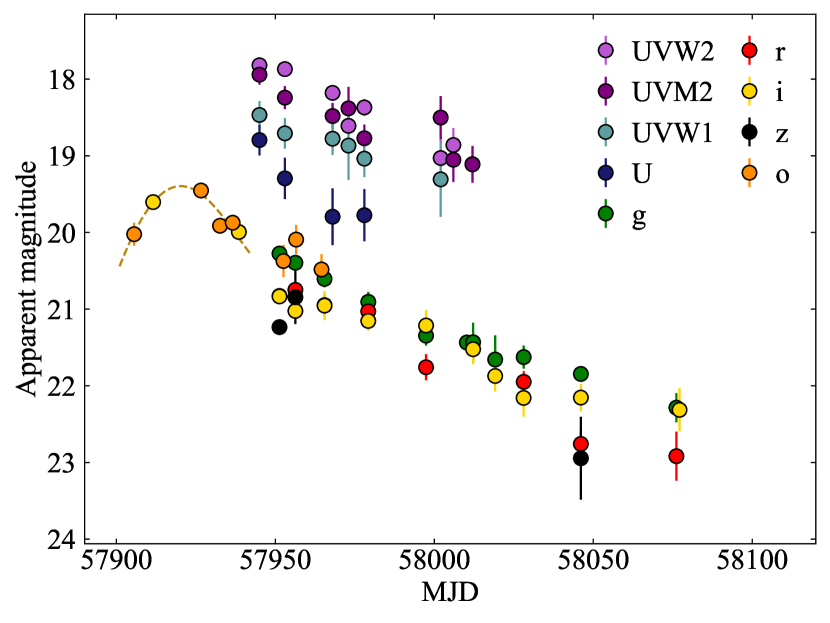
Imaging in the UV was obtained using the UV-Optical Telscope (UVOT) on board the Neil Gehrels Swift observatory. We downloaded the data from the Swift public archive and extracted light curves in the UVW2, UVM2, UVW1 and U filters following the procedures outlined by Brown et al. (2009), using a 5” aperture. The magnitudes are calibrated in Vegamags in the Swift photometric system (Breeveld et al., 2011). No reference images were available in the UV, so we estimated the host galaxy contribution using our best-fit spectral energy distribution (SED) model (section 6). The galaxy flux in each UVOT filter was determined by applying the s3 synthetic photometry package (Inserra et al., 2018) to the SED model; this was then subtracted from the UVOT measurements of AT2017eqx. Our optical and UV photometry is shown in Figure 2 and listed in Table 1.
Finally, we checked for variability in public data from the Wide-field Infrared Survey Explorer (WISE; Wright et al., 2010). The latest data release includes detections in the W1 and W2 bands. These are consistent with the historical magnitudes of the host galaxy. If there is significant dust in the nucleus of this galaxy, future WISE data may show an infrared echo over the next few years (Jiang et al., 2016a).
3.2 Spectroscopy
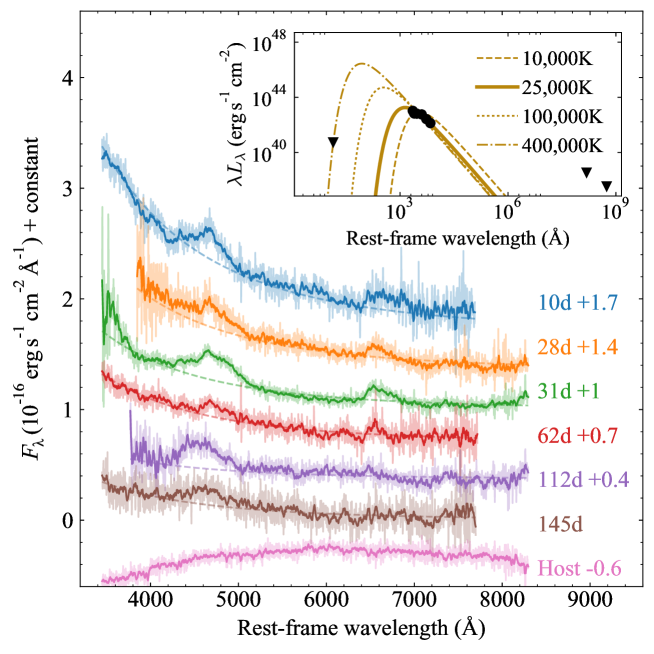
We obtained six epochs of spectroscopy between 2017-06-28 and 2017-11-26 using LDSS3, IMACS, and the BlueChannel spectrograph on the 6.5-m MMT telescope (Schmidt et al., 1989). Spectra were reduced in pyraf, including bias subtraction, flat-fielding, wavelength calibration using arc lamps, and flux calibration using standard stars observed on the same nights. We obtained one additional spectrum on 2018-08-06 using Binospec on MMT. This was reduced using a dedicated pipeline. The final spectrum shows no evidence of TDE features, and we therefore consider it a pure host galaxy spectrum. All spectra were scaled to contemporaneous photometry (interpolated were necessary) and telluric features removed using model fits. We corrected for extinction using the Galactic dust maps of Schlafly & Finkbeiner (2011), and assumed negligible extinction in the transient host galaxy. Host-subtracted spectra are plotted in Figure 3; a log of spectra is provided in Table 2.
3.3 Radio observations
We observed AT2017eqx using the Karl G. Jansky Very Large Array (VLA) in C configuration on 2017-07-14 and 2017-08-22 (Program ID: 16B-318; PI: Alexander). Each observation lasted one hour and was split between C and K bands (central frequencies 6.0 GHz and 21.7 GHz). We reduced the data using the VLA CASA Calibration Pipeline (CASA version 4.7.2) and imaged the data using standard CASA routines (McMullin et al., 2007). Both observations used 3C48 as the flux calibrator and J2232+1143 as the phase calibrator.
.
No significant radio emission was detected in either epoch. We therefore combined the epochs to derive deeper limits on the radio flux, at a mean phase of 55 days after discovery. The 6 GHz limit corresponds to erg s-1at the distance of AT2017eqx. All limits are listed in Table 3. AT2017eqx has one of the deepest radio limits among TDEs, particularly at this phase from disruption (Figure 4). Only iPTF16fnl (Blagorodnova et al., 2017) and AT2018zr (van Velzen et al., 2019) have deeper constraints.
The non-detection in the radio rules out a powerful jet similar to those associated with the relativistic TDEs Swift J1644+57 (Zauderer et al., 2011; Bloom et al., 2011; Burrows et al., 2011) and Swift J2058+05 (Cenko et al., 2012b). However, most TDEs are not bright in the radio. Simulations by Mimica et al. (2015) suggested that this cannot be explained solely by beaming effects, implying that jetted TDEs are intrinsically rare. ASASSN-14li was detectable at radio wavelengths due to its proximity (90 Mpc), with a peak luminosity 3-4 orders of magnitude lower than the Swift events. This modest radio emission was interpreted as a weak jet (van Velzen et al., 2016) or a wide-angle non-relativistic outflow (Alexander et al., 2016). A similar outflow was also detected in XMMLS1 J0740-85 (Alexander et al., 2017), another very nearby TDE (at 75 Mpc). Despite the much greater distance to AT2017eqx (520 Mpc), our VLA limits are sufficiently deep to rule out emission at 6 GHz in excess of that seen in ASASSN-14li, though slightly fainter emission comparable to XMMSL1 J0740-85 is still permitted.
Future observations at similar sensitivity may determine if AT2017eqx could have launched an off-axis jet that later spreads into our line of sight. The off-axis TDE jet resolved in Arp 299-B AT1 by Mattila et al. (2018) is an example of such a system. Regardless, our limit is among the deepest observational constraints on a non-relativistic outflow during the first months after disruption for any TDE to date.
3.4 X-ray observations
Initial X-ray data was obtained using the X-ray Telescope (XRT) onboard Swift. Analysis of 5.7 ks of data collected between 2017-07-11 and 2017-07-24 revealed no significant flux in the 0.3-10 keV range. We carried out deeper observations using the Chandra X-ray Observatory with 10 ks integrations on 2017-08-16 and 2019-01-04 (Programs 20625, 21437; PI: Nicholl, Berger), again resulting in non-detections. We also checked for archival imaging before the optical flare to rule out previous AGN activity. This field was observed by XMM-Newton on 2015-05-20 (Observation ID: 076247020). We analysed the image using the online XMM-Newton Science Archive tools. No source is detected at the position of the host galaxy.
For all epochs, we assume a power law spectral model with , and a Milky Way hydrogen column density of cm-2 along this line of sight, in order to convert count rates to fluxes over the range 0.3-10 keV. We verified that our results are only weakly dependent on our choice of model, and we derive similar constraints if we instead assume a blackbody SED with a temperature of 0.1 keV. The limiting count rates and fluxes are given in Table 4.
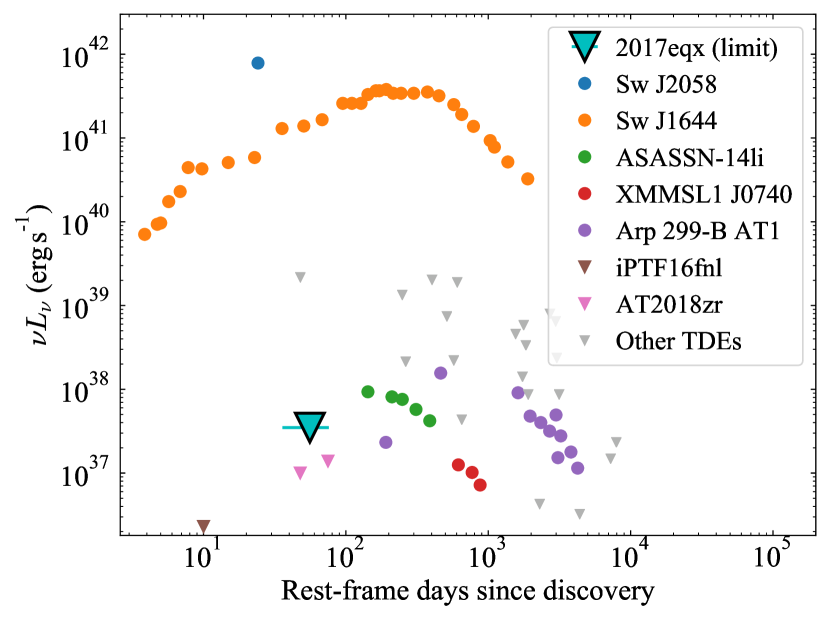
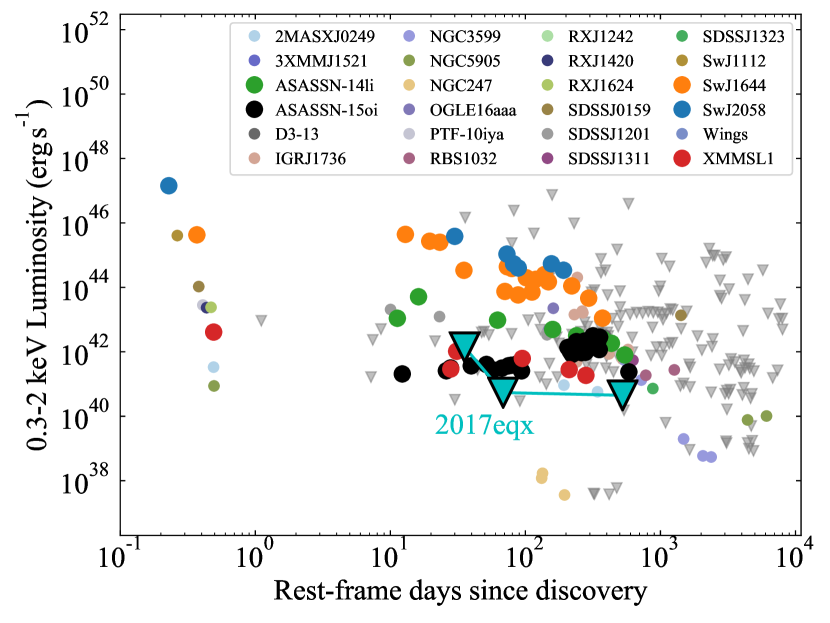
Our limits from Chandra imply an X-ray/optical ratio . TDEs with optical and X-ray detections have generally exhibited X-ray/optical ratios . For some TDEs, the ratio can be much greater. These are generally relativistic TDEs, though XMMSL1 J074008.2-853927 (Saxton et al., 2017) appears to be an example of a TDE with a thermal component that also exhibited a large X-ray/optical ratio. However, many TDEs have X-ray non-detections that imply a ratio (Auchettl et al., 2017). AT2017eqx falls firmly in this category. Compared to other TDEs which have exhibited strong X-rays, e.g. ASASSN-14li (Miller et al., 2015; Brown et al., 2017), ASASSN-15oi (Holoien et al., 2016b; Gezari et al., 2017; Holoien et al., 2018a), and Swift J1644+57 (Levan et al., 2011, 2016), the X-ray emission from AT2017eqx is at least an order of magnitude less than that observed in those events (Figure 5).
4 Photometric analysis
4.1 Bolometric luminosity and temperature
We determine the bolometric luminosity of AT2017eqx using the following procedure, implemented via superbol (Nicholl, 2018). We first interpolate or extrapolate all light curves to a common set of observation times, defined by having an observation in or bands, using low (first- or second-) order polynomial fits. At each epoch, we integrate the spectral luminosity over all bands, and fit blackbody curves to estimate the flux falling outside of the UV-optical wavelength range. These fits also allow us to constrain the temperature and radius of the emitting material.
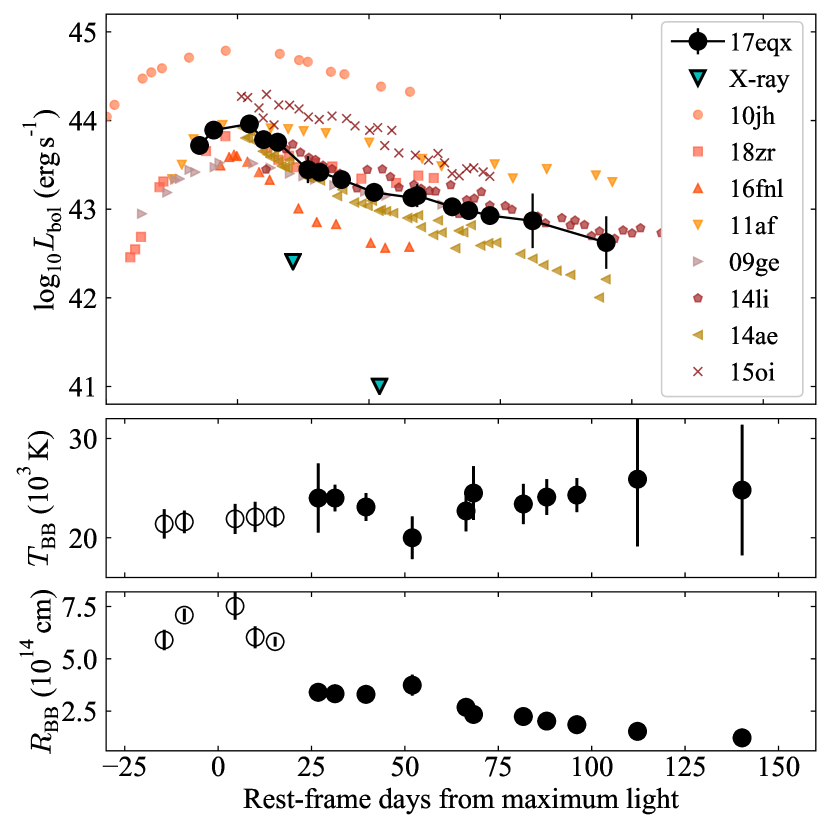
The bolometric light curve and blackbody parameters are shown in Figure 6. The best-fitting blackbody temperature is K and shows no significant evolution in time within the errors. Visually there may be a slight rise, though this is sensitive to extrapolating the UV photometry. The blackbody radius decreases from cm to cm. AT2017eqx peaks at a luminosity erg s-1 (with a solid lower limit of erg s-1 in the observed bands), and emits a total of erg over the duration of our observations. The luminosity and light curve shape is typical of optical TDEs.
4.2 TDE model fit
We fit a physical TDE model to the observed UV and optical photometry using mosfit: the Modular Open Source Fitter for Transients (Guillochon et al., 2018). This is a semi-analytic code employing a range of modules that can be linked together to produce model light curves of astronomical transients, and determine the best fitting model parameters through Bayesian analysis. The TDE model and associated modules in mosfit are described in detail by Mockler et al. (2019). The method is based on an older code, tdefit (Guillochon et al., 2014), and uses a combination of scaling relations and interpolations between the output of numerical TDE simulations to determine the luminosity.
The model has ten free parameters: the masses of the star and SMBH; the impact parameter (determining whether a disruption is full or partial); the efficiency of converting fallback energy into radiation; two parameters controlling the relationship between the luminosity and radius; the time of disruption relative to first detection; a viscous timescale over which the accretion disk forms; the extinction (column density) in the host galaxy; and a white-noise term parameterising any unaccounted-for variance.
To sample the parameter space we used the affine-invariant ensemble method (Goodman & Weare, 2010; Foreman-Mackey et al., 2013) as implemented in mosfit. We ran the Markov Chain with 100 walkers for 50,000 iterations, checking for convergence by ensuring that the Potential Scale Reduction Factor was at the end of the run (Brooks & Gelman, 1998). We assume the same priors as used by Mockler et al. (2019), with the exception of the time of disruption. Given that we have only one or two data points weakly constraining the rise-time of AT2017eqx, we run two fits: one where we allow the disruption to occur up to 168 days before first detection (corresponding to the time of the last ATLAS non-detection); and one where we restrict disruption to within 30 days before detection, to force a better fit to the first ATLAS detection.
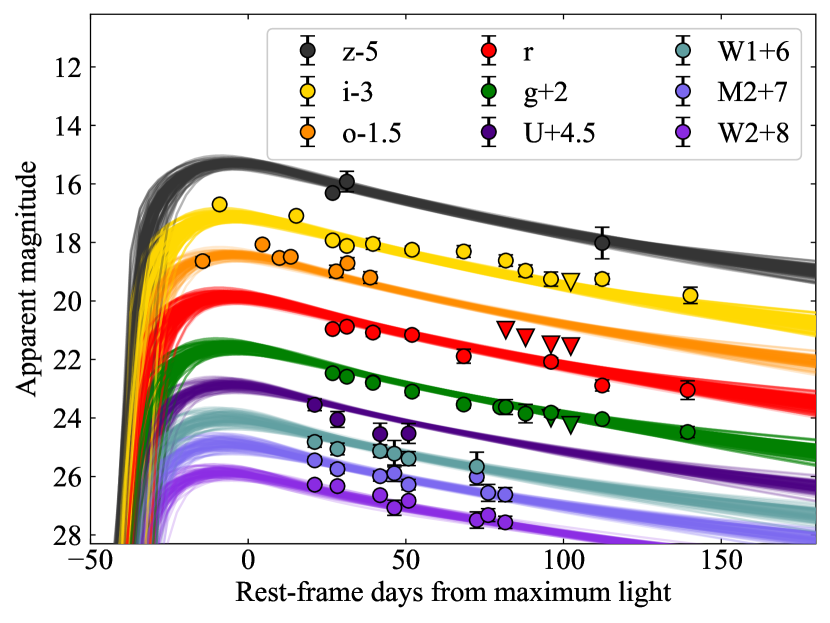
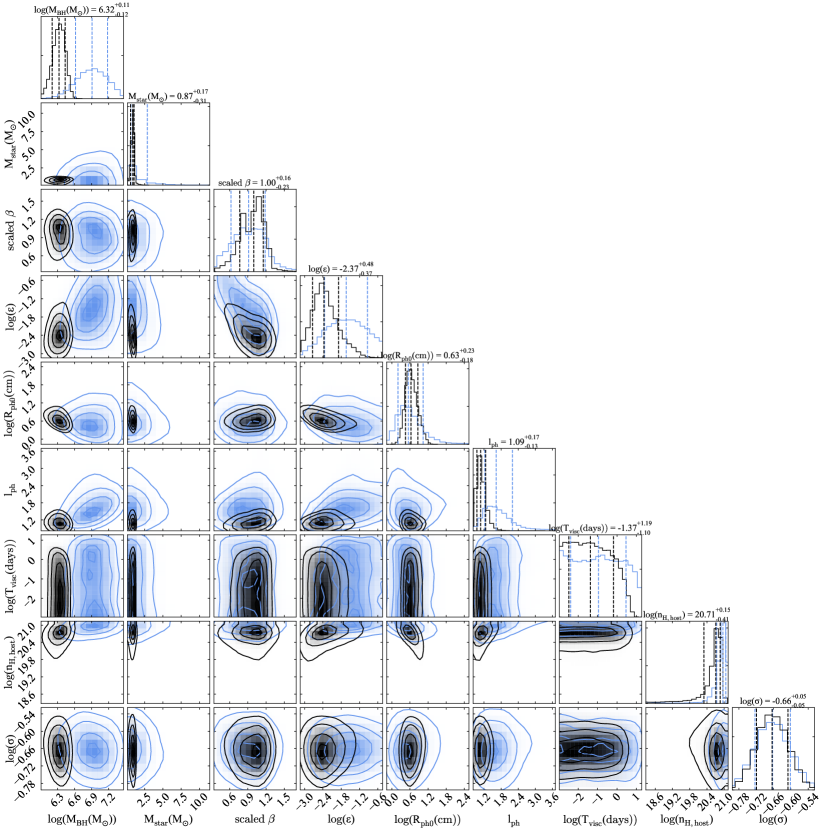
The model light curves for the latter case are shown in Figure 7, and the posteriors of the parameters for both fits are shown as a corner plot in Figure 8. These posteriors are overall similar, with narrower constraints in the case with the stronger prior on disruption time, though some posteriors show shifts in the median of up to between the fits.
The posteriors point to the full disruption (i.e. scaled impact parameter ) of a M⊙ star. The SMBH mass is more sensitive to the assumed rise time, with in the more general case, falling to when the rise time is constrained to 30 days. The TDE peak luminosity ( erg s-1) corresponds to 10-40% of the Eddington luminosity for this SMBH mass range. The model employs a power-law photospheric radius, ; the best fit has , i.e. the radius of the emitting region is directly proportional to the luminosity.
The best-fit viscous time is always much shorter than the rise time, indicating that the emission has not been delayed by a long circularisation process. This requires either that an accretion disk forms promptly after disruption or that the optical luminosity instead arises from stream-stream collisions (Mockler et al., 2019). Assuming that the energy is released close to the innermost stable circular orbit of a M⊙ SMBH, the implied blackbody temperature is K, which is in some tension with the temperature range ruled out by our X-ray non-detections, K (Figure 3, inset). Thus in an accretion-powered model, the disk emission would have to be downgraded to a cooler spectrum by a reprocessing layer.
5 Spectroscopic analysis
5.1 Line identification
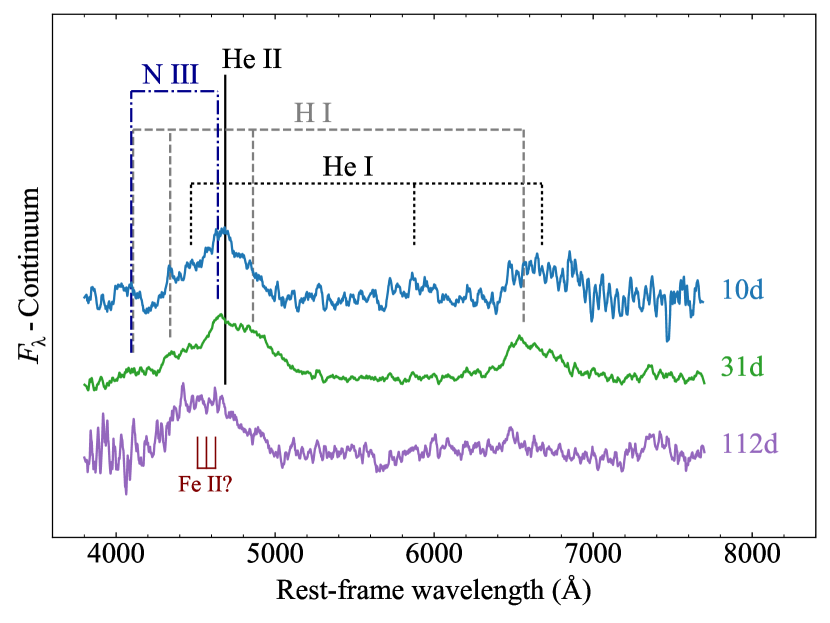
As shown in the previous section, the overall blue continuum in the spectrum shows little change over time. To analyse the evolution in our spectra, we therefore first remove this continuum using fifth-order polynomial fits (e.g. Hung et al., 2017). We excise from the fit any regions within Å ( km s-1) of the rest wavelengths of H, H and He II 4686 – typically the dominant features in optical TDE spectra. Figure 9 shows examples of the smoothed TDE spectra after subtraction of the continua, with line features marked.
The early spectra exhibit two strong broad emission lines, along with some weaker features. The strongest lines peak close to the rest wavelengths of H and He II , with several features matching the locations of the other Balmer lines. The presence of both He II and H I in the spectrum would qualify AT2017eqx as a transitional event between so-called ‘H-rich’ and ‘He-rich’ TDEs, following the continuum identified by Arcavi et al. (2014). However, later spectra, days after maximum, look markedly different. The hydrogen lines have largely disappeared, leaving only a strong emission line around He II . AT2017eqx therefore offers direct evidence that disruption of a hydrogen-rich star (required by the early spectra) can form a spectrum with no visible hydrogen. We will return to this critical point in section 5.3.
There is some indication of neutral He I lines in the spectrum, which could help to explain asymmetries apparent in the line profiles. A red shoulder in the early-time H profile could be due to He I , while a blue shoulder in He II could be contamination from He I . The earliest spectrum shows a potential He I , which might support this interpretation, though He I lines do not appear to be present at later times (see section 5.2).
While early studies of TDE optical spectra primarily identified emission from hydrogen and helium, several authors have recently found evidence for metal lines such as N III and O III, attributed to the Bowen flourescence mechanism (Blagorodnova et al., 2019; Leloudas et al., 2019)111Lines from other ionisation states of oxygen, nitrogen and carbon have been found in the UV (Cenko et al., 2016; Brown et al., 2018).. This occurs when the transition in recombining He II emits a photon that happens to resonate with a far-UV transition in O III, which in turn produces a photon that resonates with N III (Bowen, 1935). Optical photons are also produced in this cascade, which (unlike the far-UV photons) can escape to the observer. We mark the positions of N III lines on Figure 9 (the O III Bowen lines are at Å). N III 4100 falls too close to H for a firm identification. However, N III (or possibly C III ) does appear to be present in the early spectra of AT2017eqx, manifesting as a bump just bluewards of the centre of the broad He II peak. This is similar to the profile seen in TDEs iPTF15af (Blagorodnova et al., 2019) and AT2018dyb/ASASSN-18pg (Leloudas et al., 2019). This supports the claim by Leloudas et al. (2019) that such features may be common in TDEs.
The He II line appears shifted to bluer wavelengths in the later spectra. The shift is too large to be explained by blending with N III ; furthermore, the N III 4100 line is not strong like that seen in AT2018dyb, indicating that Bowen features are unlikely to dominate the blend. It is possible that there is a contribution from Fe II, which we also mark on the figure. This was recently identified by Wevers et al. (2019b) in the spectrum of AT2018fyk/ASASSN-18ul. In that case the appearance of the line, thought to originate from dense gas close to an accretion disk, was associated with X-ray emission and a plateau in the optical and UV light curves. Other TDEs have exhibited narrow Fe II emission, likely from pre-existing broad-line regions around the SMBH (Blanchard et al., 2017), but their spectra were dominated by multi-component Balmer emission. We see none of these properties in the case of AT2017eqx, and therefore cannot identify Fe II.
5.2 Line profiles and velocities
We analyse the line profiles quantitatively by means of Gaussian fits. There are several important caveats to note: blending between broad overlapping lines complicates their observed profiles. The fits are also sensitive to the choice of continuum, which we defined using a fifth-order polynomial fit. Finally, the profile of even an isolated line is not necessarily Gaussian – lines may have a large electron-scattering optical depth, and outflows can induce asymmetries (Roth & Kasen, 2018). Nevertheless, we proceed with Gaussian fits as a simplified means to determine line centres and widths, following other studies in the literature (Arcavi et al., 2014; Blagorodnova et al., 2017; Hung et al., 2017).
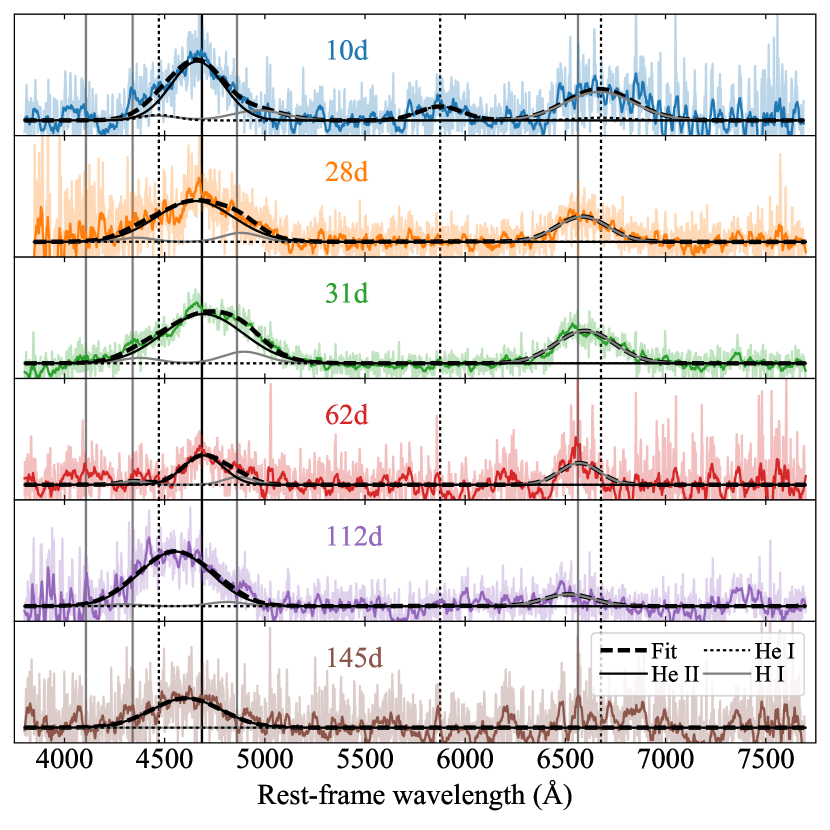
The most difficult issue to deal with is the effect of blending. We account for this by fitting the entirety of each continuum-subtracted spectrum simultaneously (Figure 10) with a model that includes H I (), He II (4686 Å) and He I (4471, 5876, 6678 Å). We neglect the Bowen fluorescence lines (N III and C III) as these are almost completely degenerate with He II at the observed line widths, and we do not see a strong N III line to suggest that the Bowen mechanism dominates line formation in this region, as seen in AT2018dyb (Leloudas et al., 2019). We therefore estimate that the Bowen lines account for no more than of the measured flux in this linr blend.
For each line we allow the centroid offset (red/blueshift), velocity width and luminosity to vary, but fix lines from the same ion to have the same offset and width. To further reduce the number of free parameters, we fix the ratios between lines from a given ion. For the Balmer lines we assume Case B recombination (Osterbrock & Ferland, 2006), which predicts H/H and H/H. Our analysis is not sensitive to the precise ratios here, and we obtain essentially the same results for any reasonable choices, though we get poor fits at early times if H/H. For He I, we use the model ratios from (Benjamin et al., 1999), which show little sensitivity to temperature or density: , . This leaves a total of 9 free parameters. We fit to the spectra using the Optimize routine in scipy.
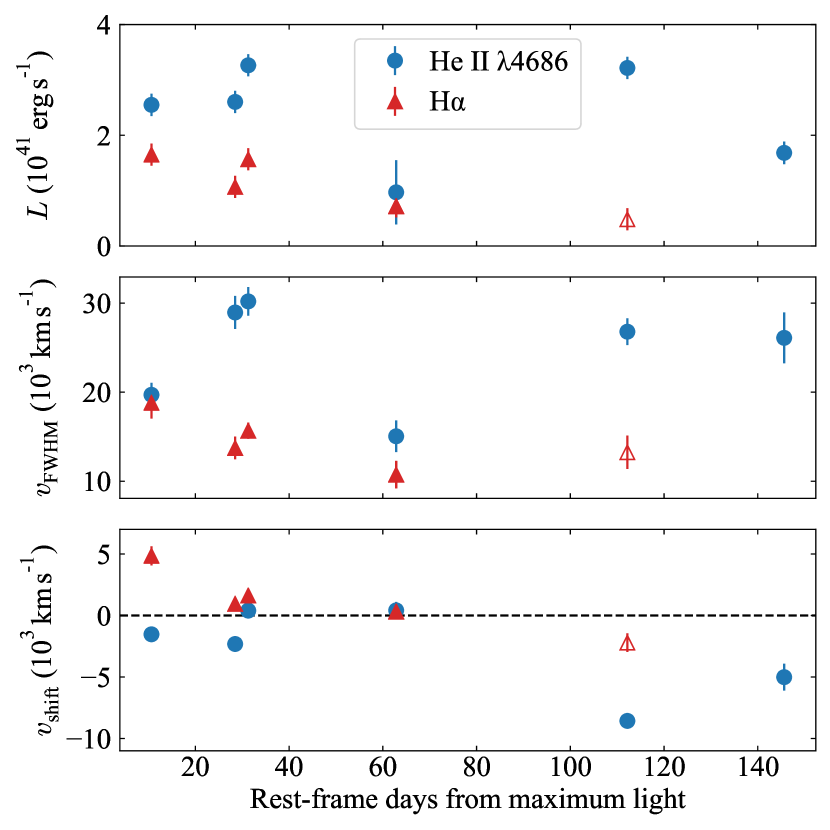
We show the fits in Figure 10 and plot the derived luminosities, velocity widths and shifts of H and He II in Figure 11 (He I contributes significantly only in the earliest spectrum). He II exhibits a fairly flat luminosity with time, while H fades by at least a factor 5. We therefore determine an initial ratio He II / H, but a markedly different ratio after 100 days of He II / H. We measure an anomalously low He II luminosity in the 62 day spectrum, for which we cannot rule out an issue due to the low signal-to-noise ratio of the data.
At early times, lines are centred close to their rest wavelengths, but we find a substantial shift in the He II line at late times (after H fades) measuring a maximum blueshift of km s-1 at 112 days. We find a smaller but still significant blueshift of km s-1 at 145 days, but these data are noisier. Such shifts are too large to be explained by the un-modelled Bowen lines (N III, C III), which are offset from He II only by 3000 km s-1.
5.3 Interpretation of the line evolution
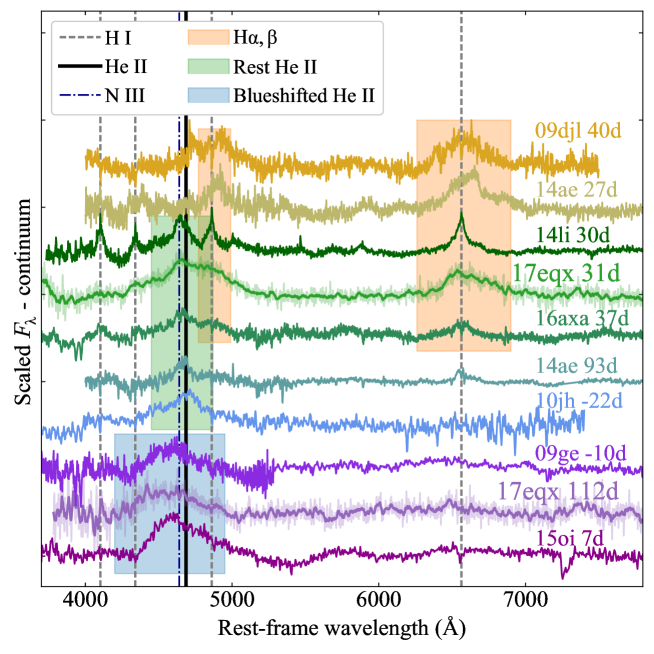
The spectroscopic evolution of AT2017eqx described in the previous sections can be summarised in two distinct phases: at early times, it is strong in H I and He II, with lines centred close to zero velocity. At later times, beyond 60-100 days, the spectrum is dominated by a single broad feature close to He II but with a blueshift of up to km s-1. Both of these morphologies have been observed in previous TDEs, but AT2017eqx is unique among the TDE sample to date in showing both a strongly evolving He II/H ratio and a late-onset blueshift.
Given the surprising spectroscopic evolution in AT2017eqx, we compare to literature TDEs in Figure 12. We include H-strong TDEs PTF09djl (Arcavi et al., 2014) and ASASSN-14ae (Holoien et al., 2014), the H/He-strong ASASSN-14li (Holoien et al., 2016a) and iPTF16axa (Hung et al., 2017), and the He-strong PS1-10jh (Gezari et al., 2012), PTF09ge (Arcavi et al., 2014) and ASASSN-15oi (Holoien et al., 2016b); the latter latter two events show a significant blueshift in their He II line profiles. While AT2017eqx falls neatly into the H/He-strong group around the time of maximum, the late-time spectrum is a close match to the He-strong events, including the blueshift in He II.
The transition in AT2017eqx from a H-strong to H-poor spectrum confirms theoretical arguments that the difference between H-strong and He-strong TDE spectra is due to physical conditions rather than the composition of the disrupted star (Guillochon et al., 2014; Roth et al., 2016). The fact that AT2017eqx changes its spectral morphology on a relatively short timescale indicates that line formation is likely very sensitive to the precise configuration of the system.
Early models of TDE spectra suggested that large He II/H ratios could be explained as a consequence of near-complete hydrogen ionization throughout the stellar debris (Guillochon et al., 2014). Such a situation implies that as the ionizing flux from the inner disk fades, hydrogen lines (and He I 5876) could become apparent later in the TDE evolution – the opposite of what we observe in AT2017eqx. However, Roth et al. (2016) argued that under more realistic TDE conditions, wavelength-dependent optical depth is the most important factor in determining line strengths. Their radiative transfer calculations showed that – all else being equal – a more compact envelope gives a larger He II/H ratio, because H is self-absorbed at most radii whereas He II is thermalised at greater depth and therefore emitted over a greater volume. Thus the transition from a H-strong to He-strong spectrum can potentially be explained if there is a contraction of the envelope towards the SMBH.
A contracting envelope is consistent with the observed decrease in luminosity at constant temperature222A reduction in photospheric radius is also possible even in outflowing material, if the density and ionization are decreasing as in a supernova, but this is generally accompanied by a decreasing temperature. Moreover, a lower density should favour H production, as photons emitted from greater depths could escape without destruction by self-absorption. (Figure 6). Moreover, our results from modelling the photometry with blackbody fits and mosfit indicated a photosphere that grows and shrinks in direct proportion to the luminosity. In the time between maximum light and the disappearance of the hydrogen lines, the luminosity (and therefore radius) decrease by roughly an order of magnitude, which could account for the change in the line ratios (Roth et al., 2016).
Equally important is the blueshift in He II. Blending with other lines such as He I or the Bowen lines may make a contribution, but these lines are not sufficiently blue to account for the size of the shift. One species that does emit at approximately the right wavelength is Fe II. Wevers et al. (2019b) identified these lines in AT2018fyk, and argued that they could also account for the apparently blueshifted He II line profile in TDEs like ASASSN-15oi. While we cannot rule out an Fe II contribution in AT2017eqx, these lines are thought to originate from dense gas close to a newly-formed accretion disk, and so would seem to be inconsistent with the lack of X-ray emission or other disk signatures in AT2017eqx. If a disk was visible, another way to induce a blueshift is Doppler boosting of the blue (approaching) side. We disfavour this for two reasons: first, if the optical depth is low enough to reveal the disk, we would expect to see H, as in other events with disk-like line profiles (Arcavi et al., 2014; Holoien et al., 2018b). Second, the disk should be hotter than the envelope, but we see no clear increase in temperature, nor the onset of X-ray emission.
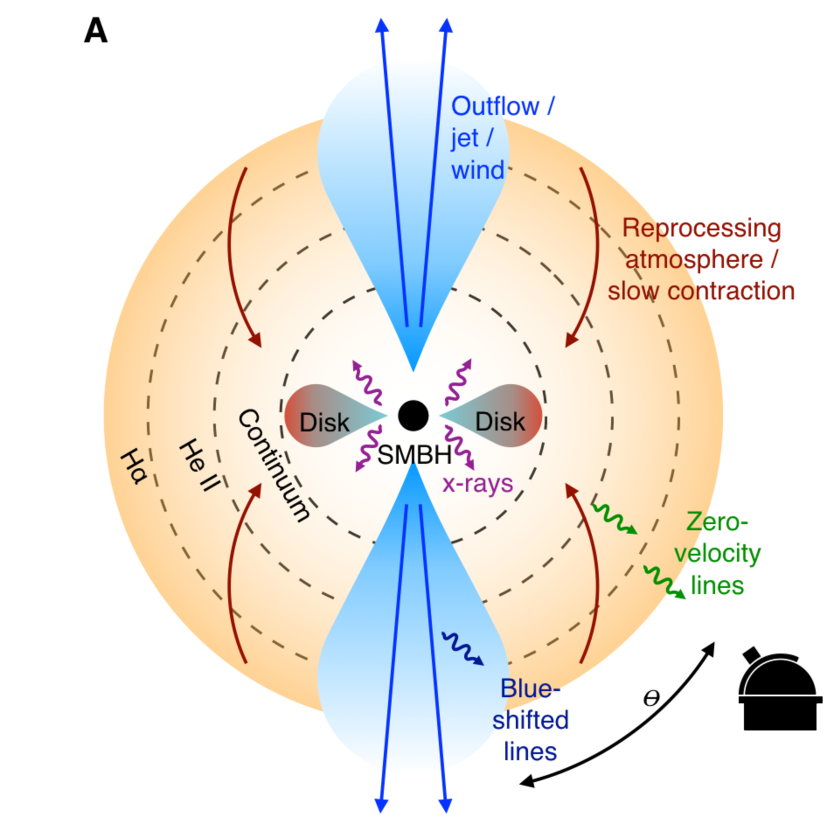
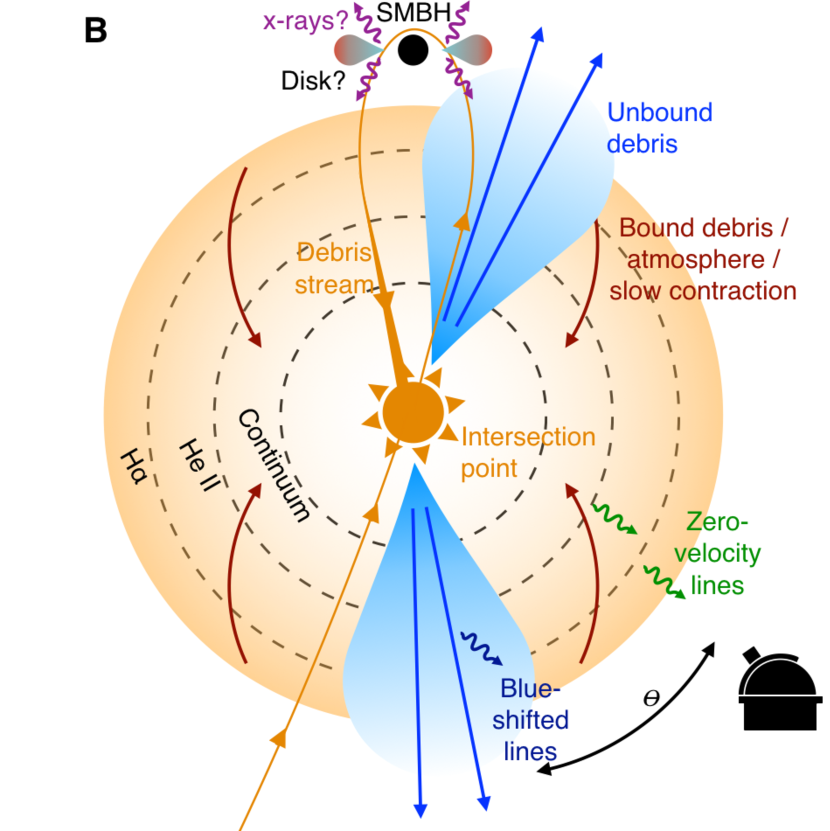
Roth & Kasen (2018) explained the blueshifted profiles in TDEs as evidence for electron-scattered line emission in an outflowing gas. Yet we have previously shown that the increasing He II/H ratio indicated a net inflow of material. Therefore to account for the full spectroscopic evolution of AT2017eqx requires both inflowing and outflowing gas, along with an appropriate geometry. We show a schematic of such a model in Figure 13.
In this scenario, the luminosity is generated in a small region, either from an accretion disk or at the intersection point between colliding debris streams. Initially, the observer sees (reprocessed) emission from a quasi-static atmosphere of bound debris (Jiang et al., 2016b). Its extent, – cm, is roughly proportional to the luminosity from the TDE engine. Following Roth et al. (2016), the dominant emission lines depend on the extent and optical depth of this layer. Lines from this region are broadened by electron scattering, but centered at their rest-frame wavelength.
Above and below the plane of the disk, or parallel to the streams, an outflow forms – either from a disk wind (Metzger & Stone, 2016), or material on unbound trajectories (Jiang et al., 2016b). This produces emission lines with a net velocity shift (Roth & Kasen, 2018). The crucial point is that whether the observer sees outflowing gas depends on whether their line of sight is obstructed by the envelope. But even for obstructed sight lines, outflows can eventually be revealed as they expand or the envelope contracts. Applying this to AT2017eqx, as the atmosphere shrinks and suppresses the H I emission, we are exposed to more of the outflowing material, causing the blueshift of He II. Thus this model naturally accounts for why an evolving He II/H ratio is associated with a late-onset blueshift.
5.4 Implications
Our model for AT2017eqx suggests that for TDEs more generally, viewing angle may be the primary determinant as to whether we see inflowing or outflowing gas, the radial extent of which is important in setting the line ratios. Interpreting the spectroscopic diversity of TDEs as a manifestation of viewing similar sources from different angles evokes the unified model for active galactic nuclei (Antonucci, 1993), in which the diverse observational properties of AGN depend on our sight-line towards any associated jet, torus or broad/narrow-line regions. The term ‘unified model’ has recently been applied to TDEs by Dai et al. (2018), who showed using simulations how the diversity of observed TDE X-ray/optical ratios, temperatures and jets may vary as a function of viewing angle. While our interpretation of AT2017eqx and other TDEs has been developed independently, and applies primarily to the spectral lines, here we discuss how our model complements that work towards a unified model of TDEs.
In the accretion-powered paradigm, Dai et al. (2018) find that X-rays only escape for viewing angles close to the pole. In our model, such sight-lines are associated with blueshifted emission in the early spectra (or possibly disk profiles for very small angles). If most TDEs are powered by accretion, there should exist a correlation between blueshifted line profiles and detectable X-ray emission. In the case of stream-stream collisions, material may still ultimately accrete onto the SMBH and produce X-rays, but because the optical flare occurs off-center, we would expect no correlation between X-rays and blueshifted lines. Correlating the X-ray and optical properties of TDEs can therefore be used to test our proposed model, and possibly provide a way to determine whether most TDEs are powered by accretion or stream-stream collisions (see also Pasham et al., 2017).
There are several complications to this picture, such as the non-spherical geometry of real TDEs, and the fact that powerful outflows can also produce X-rays (at least in some relativistic TDEs). Moreover, some TDEs show two light curve maxima, or a far-UV excess several years after disruption, which may indicate both accretion and stream collisions are at work (Leloudas et al., 2016; Wevers et al., 2019b; van Velzen et al., 2018). Searching for this correlation will therefore require large statistical samples of TDEs, but these will be provided soon by current and next-generation surveys.
5.5 Application to other TDEs
The schematic shown in Figure 13 implies three possible scenarios for a typical TDE spectrum:
-
1.
The TDE is viewed approximately parallel to the disk (A) or orbital plane (B). An observer sees only reprocessed optical radiation from the envelope, with lines centered close to zero velocity. The ratio of He II/H depends on the optical depth in this material, which may evolve as the debris expands or contracts in response to heating from below.
-
2.
The TDE is viewed perpendicular to the disk (A) or orbital plane (B). This observer can see outflowing material, and spectral lines will have a net blueshift. If the power source is accretion onto the SMBH, and the outflow carves a cavity in the envelope, this could also be observed as an X-ray TDE.
-
3.
The TDE is viewed at an intermediate angle. This observer will most likely see only the envelope initially, but if this layer contracts, the outflow on the near side can be revealed leading to blue-shifted emission lines. X-rays may not become visible until much later. This scenario may explain the spectroscopic evolution seen in AT2017eqx.
Here we consider some other TDEs within this context. Spectra have been obtained from the Open TDE Catalog (Guillochon et al., 2017) and Weizmann Interactive Supernova Data Repository (WISeREP) (Yaron & Gal-Yam, 2012).
PS1-10jh, one of the earliest optical TDEs, showed only He II lines, but in this case without a blueshift even at 250 days. No X-rays were detected despite deep observations. Our model naturally accounts for this, as even if an accretion disk did form promptly, it may never become visible due to an approximately side-on viewing angle through the atmosphere ( in Figure 13), in agreement with other studies (Dai et al., 2018).
ASASSN-14ae (Holoien et al., 2014; Brown et al., 2016) initially shows only hydrogen lines in its spectrum, but it gradually develops a He II line over time, while H becomes weaker. By 93 days, He II is stronger than H. Thus ASASSN-14ae evolves from a H-strong to a mixed H/He spectrum, as shown in Figure 12, analogous to how AT2017eqx evolves from a H/He to a He-strong spectrum. Therefore this is another event consistent with a contracting envelope. ASASSN-14ae did not exhibit X-ray emission.
iPTF16fnl showed H I and He II in its early spectra (Blagorodnova et al., 2017; Brown et al., 2018), centered close to their rest-frame wavelengths, and the X-ray/optical ratio was constrained to be (consistent with background fluctuations; Auchettl et al., 2017; Blagorodnova et al., 2017). Along with these similarities to AT2017eqx, this event may also show a comparable evolution in the He II / H ratio, indicating the atmosphere could be contracting in a similar manner. However, no blueshifts are observed, suggesting a viewing angle closer to side-on.
ASASSN-15oi showed blueshifted He II around maximum light (Figure 12), and X-ray emission that gradually increased in time as the optical light faded (Holoien et al., 2016b; Gezari et al., 2017; Holoien et al., 2018a). In our model, seeing the blueshifted emission at early times implies a viewing angle close to the direction of the outflow, so if a disk had formed promptly we may have expected that this event would be X-ray bright from the beginning, rather than slowly increasing over a year. Thus if our proposed geometry applies to ASASSN-15oi, this could support the interpretation Gezari et al. (2017): that the X-rays were a sign of gradual disk formation, and that the earlier optical emission was therefore collisional.
ASASSN-14li is one of the best-studied H- and He-strong TDEs (Holoien et al., 2016a; Brown et al., 2017). The optical lines in this event are consistent with their rest-frame wavelengths (though He II may show a slight offset due to blending with N III; Leloudas et al. 2019). This event was also detected in X-rays and radio, with X-ray absorption lines and radio luminosity corresponding to a velocity of up to (van Velzen et al., 2016; Alexander et al., 2016; Kara et al., 2018). However, other X-ray and UV lines are seen at much lower velocities, of a few hundred km s-1 (Miller et al., 2015; Cenko et al., 2016), implying material with a range of velocities. Based on cross-correlating the temporal evolution of the emission in the X-ray, optical and radio regimes, Pasham et al. (2017) and Pasham & van Velzen (2018) argue that the X-rays are produced by an accretion disk that modulates the radio jet, while the optical emission comes from a stream intersection region further away. In the context of our model, seeing early-time X-ray emission with only low-velocity spectral lines would appear to be possible only in case B, supporting the collsional picture preferred by Pasham & van Velzen (2018).
Overall, it appears that the limited sample of optical TDEs can be accommodated within a picture like that presented in Figure 13: PS1-10jh, ASASSN-14ae, and iPTF16fnl are consistent with either accretion or stream collisions, but ASASSN-15oi and ASASSN-14li seem to favour the latter. However, to consistently explain the X-ray and optical properties together likely requires a combination of both processes on different timescales. This may make it difficult to identify the suggested correlation between X-ray emission and blueshifts until much larger TDE samples are available.
6 Host galaxy
A surprisingly large fraction of TDEs have been found in a specific class of quiescent Balmer-strong absorption galaxies (Arcavi et al., 2014; French et al., 2016; Graur et al., 2018; Law-Smith et al., 2017), defined spectroscopically by the presence of Balmer lines in absorption and a lack of nebular emission lines. This combination signifies that star formation was likely significant up to Gyr ago but has now largely ceased, leaving behind A type stars that dominate the stellar light (whereas the ionizing O and B stars have already died).
From our host galaxy spectrum, we measure a Lick index (the equivalent width of H using line and continuum bandpasses defined by Worthey & Ottaviani 1997) H Å. We also find that H is visible only in absorption, with an equivalent width of 3.1 Å. This combination satisfies the cut used by French et al. (2016), encapsulating 75% of TDE hosts known at the time, and only 2% of SDSS galaxies. Using the largest TDE sample to date, a more recent study by Graur et al. (2018) found that the fraction of such host galaxies among optical TDEs is , which is still a significant overabundance. The host of AT2017eqx adds to this over-representation of Balmer-strong absorption galaxies in the TDE host population.
The galaxy is also detected in a number of sky surveys with public catalogs. We retrieved magnitudes from SDSS DR14 (Abolfathi et al., 2018), magnitudes from PanSTARRS DR1 (Flewelling et al., 2016), and the magnitude from WISE (Wright et al., 2010), and fit the resultant host SED using prospector (Leja et al., 2017) to derive physical parameters such as stellar mass and star-formation rate. The code includes the effects of stellar and nebular emission, metallicity, dust reprocessing, and a non-parametric star-formation history, within a nested sampling framework.
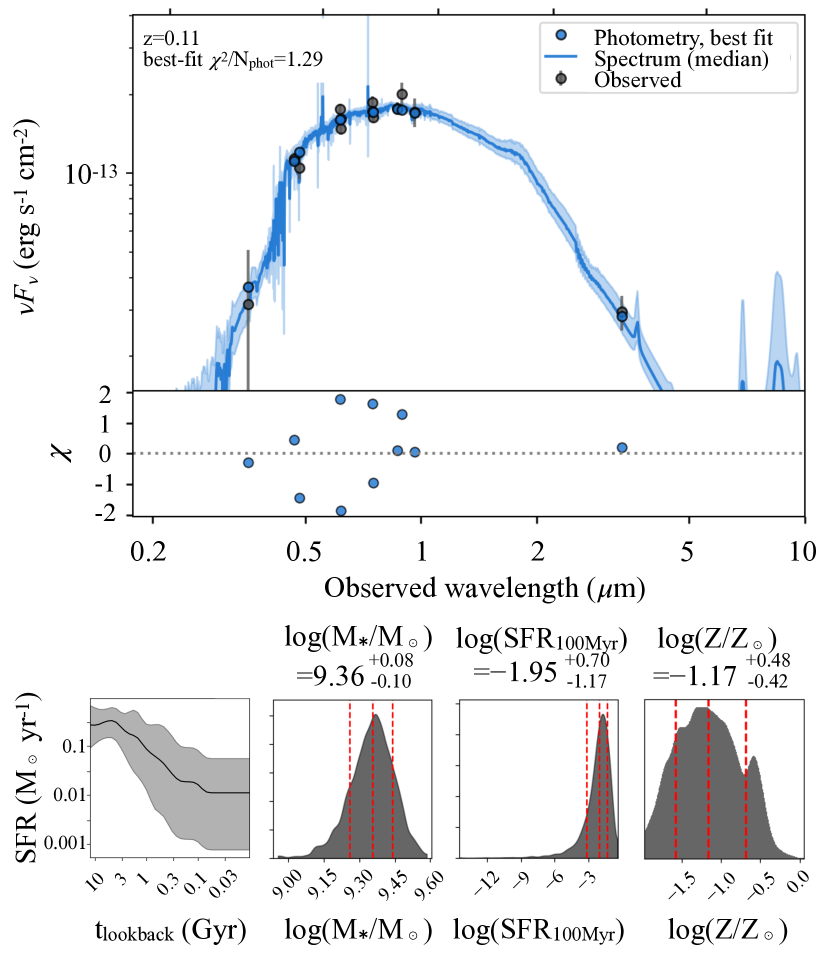
The galaxy SED and prospector fitting results are shown in Figure 14. A small offset is visible between the SDSS and PS1 photometry, but the model well captures the SED shape. We find a stellar mass , with low star-formation rate and metallicity. The star-formation history is of particular interest: this drops by an order of magnitude over the past Gyr, consistent with expectations for the galaxy spectral type. Using the scaling relation between bulge stellar mass and SMBH mass from Kormendy & Ho (2013), and assuming that for an elliptical galaxy, we estimate a black hole mass of , consistent with the results of fitting the TDE light curve.
The SMBH mass we infer for AT2017eqx is typical for optical TDE host galaxies, M⊙, as measured from stellar velocity dispersions by Wevers et al. (2019a). The same study found that X-ray selected TDEs have a flatter distribution in and typically show a smaller emitting region, consistent with an accretion disk rather than an inflated atmosphere. This may indicate that the dominant emission source can vary depending on the SMBH mass.
The host of AT2017eqx has a lower stellar mass and star-formation rate (SFR) than any of the galaxies studied by Law-Smith et al. (2017), with the possible exception of the host of RBS 1032 (Maksym et al., 2014), whose origin as a TDE has been questioned (Ghosh et al., 2006). Typical TDE hosts have a SFR that is dex below the star-forming main sequence for a given mass. The host of AT2017eqx is similar, though with a slightly larger offset of dex. This is consistent with the positions of other quiescent, Balmer strong galaxies (French et al., 2016).
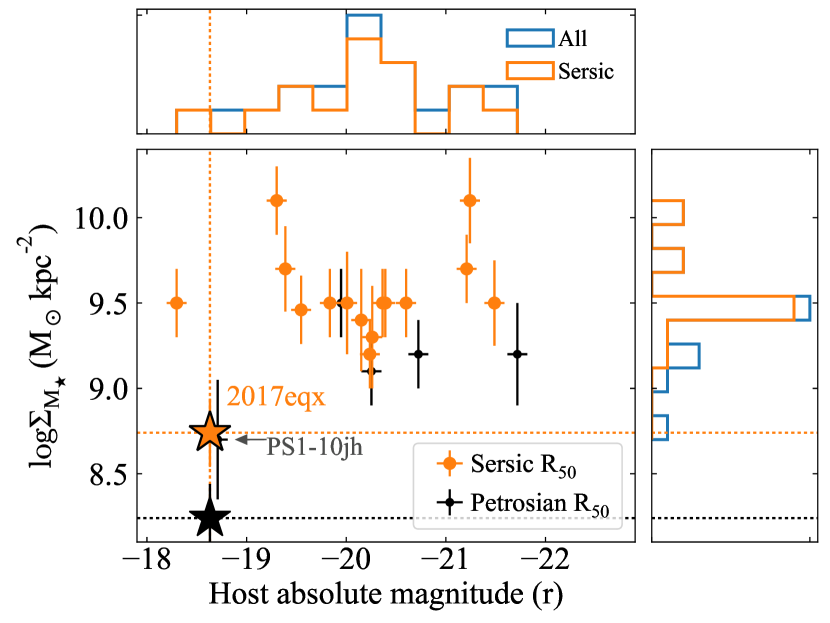
TDE host galaxies also tend to have centrally-concentrated mass distributions (Graur et al., 2018; Law-Smith et al., 2017), with an average Sérsic index of , significantly higher than typical galaxies in the same mass range (Law-Smith et al., 2017). We retrieved an -band image of the host of AT2017eqx from PanSTARRS DR1, and fit the light profile using galfit (Peng et al., 2002). We find an excellent fit with a Sérsic index of only 0.7 (Figure 15), indicating a less sharply-peaked light distribution than typical TDE hosts.
Graur et al. (2018) showed that TDE hosts generally have a stellar mass surface density , which is consistent with typical quiescent galaxies, but high for star-forming TDE hosts. This can be interpreted as evidence for a high density of stars around the central SMBH, which could naturally lead to a higher rate of TDEs (Graur et al., 2018), as earlier proposed by (Stone & Metzger, 2016; Stone & van Velzen, 2016). For consistency with that study, we recalculate the stellar mass of the AT2017eqx host galaxy by fitting only the SDSS magnitudes, using lephare (Arnouts et al., 1999; Ilbert et al., 2009). We find , consistent with our results from prospector. To convert mass into surface density, we use the half-light radius from our Sérsic fit: kpc, giving a surface density .
We plot this compared to other TDE hosts in Figure 15. AT2017eqx resides in one of the faintest galaxies for known TDEs, and has an unusually low surface mass density. Only PS1-10jh has a host with comparable . However, this galaxy had a Petrosian half-light radius (from SDSS), rather than Sérsic. Taking the Petrosian radius of the AT2017eqx host from SDSS, and applying the conversion (Graur et al., 2018), we find an even lower stellar surface mass density of , significantly offset from other TDE hosts.
The low surface mass density compared to other TDE hosts is consistent with the lower Sérsic index. The surface mass density is also low compared to average quiescent galaxies, but is typical for star-forming galaxies in the volume-weighted sample from Graur et al. (2018). Taking their empirical relation between TDE rate and , we find that of TDEs are expected to occur in a galaxy with this surface density. We therefore conclude that although the host of AT2017eqx is somewhat unusual for TDEs, it is not overwhelmingly improbable to find a TDE in such a galaxy.
7 Conclusions
We have presented an in-depth study of a new TDE, AT2017eqx, discovered by the PanSTARRS Survey for Transients and ATLAS. We followed up this event with optical photometry and spectroscopy, UV photometry from Swift, X-ray imaging and Chandra and radio observations with the VLA. The SED maintains a roughly constant colour temperature of K for at least 150 days.
Non-detections in the radio indicate that AT2017eqx did not launch a relativistic jet, and constrain the luminosity of any slower outflow to at most the level seen in ASASSN-14li. Our X-ray limits are among the deepest for any TDE to date. If an accretion disk formed promptly after the disruption, the system would have to remain optically thick to X-rays for at least 500 days.
Modelling of the UV and optical light curve with mosfit suggests that AT2017eqx resulted from the complete disruption of a solar-mass star by a black hole of M⊙, with no significant viscous delay, similar to other UV-optical TDEs (Mockler et al., 2019). This SMBH mass is consistent with the observed properties of the host galaxy, with SED fitting indicating a host stellar mass M⊙. The inferred star-formation history, and analysis of a galaxy spectrum, show that this is yet another Balmer-strong absorption galaxy hosting a TDE. However, it is one of the least massive TDE hosts to date, and the stellar mass surface density is relatively low compared to typical TDE hosts (Graur et al., 2018).
The most important new results come from the spectroscopic evolution of AT2017eqx. In the first months following the light curve maximum, the spectrum shows broad emission lines from He II and the Balmer series, with some evidence for N III Bowen flourescence (Blagorodnova et al., 2019), and He I in the earliest spectrum. The H I and He II lines initially have widths of km s-1, but are centered close to their rest-frame wavelengths. This resembles other TDEs such as ASASSN-14li, iPTF16axa and AT2018dyb. However, between 60-100 days after maximum, the H I lines disappear, while He II develops a blueshift of -8000 km s-1, resembling He-strong TDEs such as PTF09ge and ASASSN-15oi. Such a stark transition has not been seen in TDEs before, and it confirms theoretical arguments that a lack of H I lines in the spectrum of a TDE does not indicate a low abundance of hydrogen in the disrupted star.
We propose that the evolution can be explained if the debris around AT2017eqx consist of a quasi-spherical envelope, and a relatively narrow outflow from a disk wind or unbound debris. Viewing from an intermediate angle (i.e. neither parallel nor perpendicular to the outflow), we initially see emission lines of H I and He II from the envelope at zero velocity. As this layer contracts, either due to simple fallback or in response to decreasing radiation pressure, the increasing optical depth suppresses hydrogen emission. At the same time, we see more of the outflow, which produces the observed blueshift in the He II line at late times. The picture we have proposed for AT2017eqx is compatible with many TDEs from the current available samples, though these are limited in size. It has recently been shown that many TDEs exhibit outflow signatures in their UV spectra (Hung et al., 2019). Future work should determine whether it can also be applied other TDEs with featureless spectra or absorption lines (Cenko et al., 2012a; Chornock et al., 2014; Leloudas et al., 2016; Blanchard et al., 2017), or with disk-like line profiles (Holoien et al., 2018b).
Furthermore, determining whether our model applies to both X-ray weak and strong TDEs will crucial to understanding TDE physics and geometry. We suggest that searching for a correlation between X-rays and blueshifted spectral lines in TDEs is a promising avenue to distinguish between reprocessed accretion power and stream-stream collisions as the dominant power source. However, this picture quickly becomes more complicated if many collision-powered optical TDEs also form X-ray accretion disks on relatively short timescales. Identifying such a correlation between X-ray and optical properties will therefore require a much larger statistical sample, but this can soon be provided by the many ongoing and planned sky surveys such as ASASSN, ATLAS, PanSTARRS, ZTF and LSST.
Acknowledgements
We thank an anonymous referee for many helpful comments that improved this paper. Thanks to Yuri Beletsky for IMACS observing, Jabran Zahid for help with the galaxy analysis, Jorge Anais, Jaime Vargas, Abdo Campillay and Nahir Muñoz Elgueta for Swope observing, and Dave Coulter for writing the Swope scheduling software. We also thank Joel Aycock, Percy Gomez, and Yen-Chen Pan for assistance with Keck/LRIS observations. M.N. is supported by a Royal Astronomical Society Research Fellowship. The Berger Time-Domain Group is supported in part by NSF grant AST-1714498 and NASA grant NNX15AE50G. We acknowledge Chandra Award 20700239. K.D.A. acknowledges NASA Hubble Fellowship grant HST-HF2-51403.001. ATLAS acknowledges NASA grants NN12AR55G, 80NSSC18K0284, and 80NSSC18K1575. S.J.S. acknowledges STFC Grants ST/P000312/1 and ST/N002520/1. O.G. and J.L. are supported by NSF Astronomy and Astrophysics Fellowships under awards AST-1602595 and AST-1701487. The UCSC team is supported in part by NASA grant NNG17PX03C, NSF grant AST-1518052, the Gordon & Betty Moore Foundation, the Heising-Simons Foundation, and by a fellowship from the David and Lucile Packard Foundation to R.J.F. Data were obtained via the Swift archive, the Smithsonian Astrophysical Observatory OIR Data Center, the MMT Observatory of the Smithsonian Institution and the University of Arizona, and Las Campanas Observatory. NRAO is a facility of the NSF operated by Associated Universities, Inc. ATLAS products are made possible by the University of Hawaii, Queen’s University Belfast, the Space Telescope Science Institute, and the South African Astronomical Observatory. ome of the data presented herein were obtained at the W. M. Keck Observatory, which is operated as a scientific partnership among the California Institute of Technology, the University of California, and NASA; the observatory was made possible by the generous financial support of the W. M. Keck Foundation. The authors wish to recognize and acknowledge the very significant cultural role and reverence that the summit of Mauna Kea has always had within the indigenous Hawaiian community. We are most fortunate to have the opportunity to conduct observations from this mountain.
References
- Abolfathi et al. (2018) Abolfathi B., et al., 2018, ApJS, 235, 42
- Alam et al. (2015) Alam S., et al., 2015, ApJS, 219, 12
- Alexander et al. (2016) Alexander K. D., Berger E., Guillochon J., Zauderer B. A., Williams P. K. G., 2016, ApJ, 819, L25
- Alexander et al. (2017) Alexander K. D., Wieringa M. H., Berger E., Saxton R. D., Komossa S., 2017, ApJ, 837, 153
- Antonucci (1993) Antonucci R., 1993, ARA&A, 31, 473
- Arcavi et al. (2014) Arcavi I., et al., 2014, ApJ, 793, 38
- Arnouts et al. (1999) Arnouts S., Cristiani S., Moscardini L., Matarrese S., Lucchin F., Fontana A., Giallongo E., 1999, MNRAS, 310, 540
- Auchettl et al. (2017) Auchettl K., Guillochon J., Ramirez-Ruiz E., 2017, ApJ, 838, 149
- Becker (2015) Becker A., 2015, HOTPANTS: High Order Transform of PSF ANd Template Subtraction, Astrophysics Source Code Library (ascl:1504.004)
- Benjamin et al. (1999) Benjamin R. A., Skillman E. D., Smiths D. P., 1999, ApJ, 514, 307
- Berger et al. (2012) Berger E., Zauderer A., Pooley G. G., Soderberg A. M., Sari R., Brunthaler A., Bietenholz M. F., 2012, ApJ, 748, 36
- Bilir et al. (2011) Bilir S., Karaali S., Ak S., daǧtekin N. D., Önal Ö., Yaz E., Coşkunoǧlu B., Cabrera-Lavers A., 2011, MNRAS, 417, 2230
- Blagorodnova et al. (2017) Blagorodnova N., et al., 2017, ApJ, 844, 46
- Blagorodnova et al. (2019) Blagorodnova N., et al., 2019, ApJ, 873, 92
- Blanchard et al. (2017) Blanchard P. K., et al., 2017, ApJ, 843, 106
- Bloom et al. (2011) Bloom J. S., et al., 2011, Science, 333, 203
- Bowen (1935) Bowen I. S., 1935, ApJ, 81, 1
- Bower et al. (2013) Bower G. C., Metzger B. D., Cenko S. B., Silverman J. M., Bloom J. S., 2013, ApJ, 763, 84
- Breeveld et al. (2011) Breeveld A. A., Landsman W., Holland S. T., Roming P., Kuin N. P. M., Page M. J., 2011, in McEnery J. E., Racusin J. L., Gehrels N., eds, American Institute of Physics Conference Series Vol. 1358, American Institute of Physics Conference Series. pp 373–376 (arXiv:1102.4717), doi:10.1063/1.3621807
- Brooks & Gelman (1998) Brooks S. P., Gelman A., 1998, Journal of computational and graphical statistics, 7, 434
- Brown et al. (2009) Brown P. J., et al., 2009, AJ, 137, 4517
- Brown et al. (2016) Brown J. S., Shappee B. J., Holoien T. W. S., Stanek K. Z., Kochanek C. S., Prieto J. L., 2016, MNRAS, 462, 3993
- Brown et al. (2017) Brown J. S., Holoien T. W. S., Auchettl K., Stanek K. Z., Kochanek C. S., Shappee B. J., Prieto J. L., Grupe D., 2017, MNRAS, 466, 4904
- Brown et al. (2018) Brown J. S., et al., 2018, MNRAS, 473, 1130
- Burrows et al. (2011) Burrows D. N., et al., 2011, Nature, 476, 421
- Cenko et al. (2012a) Cenko S. B., et al., 2012a, MNRAS, 420, 2684
- Cenko et al. (2012b) Cenko S. B., et al., 2012b, ApJ, 753, 77
- Cenko et al. (2016) Cenko S. B., et al., 2016, ApJ, 818, L32
- Chambers et al. (2016) Chambers K. C., et al., 2016, arXiv e-prints, p. arXiv:1612.05560
- Chornock et al. (2014) Chornock R., et al., 2014, ApJ, 780, 44
- Dai et al. (2018) Dai L., McKinney J. C., Roth N., Ramirez-Ruiz E., Miller M. C., 2018, ApJ, 859, L20
- Dressler et al. (2011) Dressler A., et al., 2011, PASP, 123, 288
- Eftekhari et al. (2018) Eftekhari T., Berger E., Zauderer B. A., Margutti R., Alexander K. D., 2018, ApJ, 854, 86
- Flewelling et al. (2016) Flewelling H. A., et al., 2016, arXiv e-prints, 1612.05243
- Foreman-Mackey et al. (2013) Foreman-Mackey D., Hogg D. W., Lang D., Goodman J., 2013, PASP, 125, 306
- French & Zabludoff (2018) French K. D., Zabludoff A. I., 2018, ApJ, 868, 99
- French et al. (2016) French K. D., Arcavi I., Zabludoff A., 2016, ApJ, 818, L21
- Gezari et al. (2012) Gezari S., et al., 2012, Nature, 485, 217
- Gezari et al. (2017) Gezari S., Cenko S. B., Arcavi I., 2017, ApJ, 851, L47
- Ghosh et al. (2006) Ghosh K. K., Suleymanov V., Bikmaev I., Shimansky S., Sakhibullin N., 2006, MNRAS, 371, 1587
- Goodman & Weare (2010) Goodman J., Weare J., 2010, Communications in applied mathematics and computational science, 5, 65
- Graur et al. (2018) Graur O., French K. D., Zahid H. J., Guillochon J., Mandel K. S., Auchettl K., Zabludoff A. I., 2018, ApJ, 853, 39
- Guillochon et al. (2014) Guillochon J., Manukian H., Ramirez-Ruiz E., 2014, ApJ, 783, 23
- Guillochon et al. (2017) Guillochon J., Parrent J., Kelley L. Z., Margutti R., 2017, ApJ, 835, 64
- Guillochon et al. (2018) Guillochon J., Nicholl M., Villar V. A., Mockler B., Narayan G., Mandel K. S., Berger E., Williams P. K. G., 2018, ApJS, 236, 6
- Hills (1975) Hills J. G., 1975, Nature, 254, 295
- Holoien et al. (2014) Holoien T. W.-S., et al., 2014, MNRAS, 445, 3263
- Holoien et al. (2016a) Holoien T. W.-S., et al., 2016a, MNRAS, 455, 2918
- Holoien et al. (2016b) Holoien T. W.-S., et al., 2016b, MNRAS, 463, 3813
- Holoien et al. (2018a) Holoien T. W. S., Brown J. S., Auchettl K., Kochanek C. S., Prieto J. L., Shappee B. J., Van Saders J., 2018a, MNRAS, 480, 5689
- Holoien et al. (2018b) Holoien T. W.-S., et al., 2018b, arXiv e-prints, 1808.02890
- Hung et al. (2017) Hung T., et al., 2017, ApJ, 842, 29
- Hung et al. (2019) Hung T., et al., 2019, arXiv e-prints, p. arXiv:1903.05637
- Ilbert et al. (2009) Ilbert O., et al., 2009, ApJ, 690, 1236
- Inserra et al. (2018) Inserra C., et al., 2018, MNRAS, 475, 1046
- Jiang et al. (2016a) Jiang N., Dou L., Wang T., Yang C., Lyu J., Zhou H., 2016a, ApJ, 828, L14
- Jiang et al. (2016b) Jiang Y.-F., Guillochon J., Loeb A., 2016b, ApJ, 830, 125
- Kankare et al. (2017) Kankare E., et al., 2017, Nature Astronomy, 1, 865
- Kara et al. (2018) Kara E., Dai L., Reynolds C. S., Kallman T., 2018, MNRAS, 474, 3593
- Kilpatrick et al. (2018) Kilpatrick C. D., et al., 2018, MNRAS, 473, 4805
- Kochanek (1994) Kochanek C. S., 1994, ApJ, 422, 508
- Komossa (2002) Komossa S., 2002, in Schielicke R. E., ed., Reviews in Modern Astronomy Vol. 15, Reviews in Modern Astronomy. p. 27 (arXiv:astro-ph/0209007)
- Kormendy & Ho (2013) Kormendy J., Ho L. C., 2013, ARA&A, 51, 511
- Law-Smith et al. (2017) Law-Smith J., Ramirez-Ruiz E., Ellison S. L., Foley R. J., 2017, ApJ, 850, 22
- Leja et al. (2017) Leja J., Johnson B. D., Conroy C., van Dokkum P. G., Byler N., 2017, ApJ, 837, 170
- Leloudas et al. (2016) Leloudas G., et al., 2016, Nature Astronomy, 1, 0002
- Leloudas et al. (2019) Leloudas G., et al., 2019, arXiv e-prints, 1903.03120
- Levan et al. (2011) Levan A. J., et al., 2011, Science, 333, 199
- Levan et al. (2016) Levan A. J., et al., 2016, ApJ, 819, 51
- Lodato (2012) Lodato G., 2012, in European Physical Journal Web of Conferences. p. 01001 (arXiv:1211.6109), doi:10.1051/epjconf/20123901001
- Maksym et al. (2014) Maksym W. P., Lin D., Irwin J. A., 2014, ApJ, 792, L29
- Mattila et al. (2018) Mattila S., et al., 2018, Science, 361, 482
- McMullin et al. (2007) McMullin J. P., Waters B., Schiebel D., Young W., Golap K., 2007, in Shaw R. A., Hill F., Bell D. J., eds, Astronomical Society of the Pacific Conference Series Vol. 376, Astronomical Data Analysis Software and Systems XVI. p. 127
- Metzger & Stone (2016) Metzger B. D., Stone N. C., 2016, MNRAS, pp 948–966
- Miller et al. (2015) Miller J. M., et al., 2015, Nature, 526, 542
- Mimica et al. (2015) Mimica P., Giannios D., Metzger B. D., Aloy M. A., 2015, MNRAS, 450, 2824
- Mockler et al. (2019) Mockler B., Guillochon J., Ramirez-Ruiz E., 2019, ApJ, 872, 151
- Nicholl (2018) Nicholl M., 2018, RNAAS, 2, 230
- Osterbrock & Ferland (2006) Osterbrock D. E., Ferland G. J., 2006, Astrophysics of gaseous nebulae and active galactic nuclei
- Pasham & van Velzen (2018) Pasham D. R., van Velzen S., 2018, ApJ, 856, 1
- Pasham et al. (2017) Pasham D. R., Cenko S. B., Sadowski A., Guillochon J., Stone N. C., van Velzen S., Cannizzo J. K., 2017, ApJ, 837, L30
- Peng et al. (2002) Peng C. Y., Ho L. C., Impey C. D., Rix H.-W., 2002, AJ, 124, 266
- Piran et al. (2015) Piran T., Svirski G., Krolik J., Cheng R. M., Shiokawa H., 2015, ApJ, 806, 164
- Rest et al. (2005) Rest A., et al., 2005, ApJ, 634, 1103
- Roth & Kasen (2018) Roth N., Kasen D., 2018, ApJ, 855, 54
- Roth et al. (2016) Roth N., Kasen D., Guillochon J., Ramirez-Ruiz E., 2016, ApJ, 827, 3
- Saxton et al. (2017) Saxton R. D., Read A. M., Komossa S., Lira P., Alexander K. D., Wieringa M. H., 2017, A&A, 598, A29
- Schechter et al. (1993) Schechter P. L., Mateo M., Saha A., 1993, PASP, 105, 1342
- Schlafly & Finkbeiner (2011) Schlafly E. F., Finkbeiner D. P., 2011, ApJ, 737, 103
- Schmidt et al. (1989) Schmidt G. D., Weymann R. J., Foltz C. B., 1989, PASP, 101, 713
- Stalder et al. (2017) Stalder B., et al., 2017, ApJ, 850, 149
- Stone & Metzger (2016) Stone N. C., Metzger B. D., 2016, MNRAS, 455, 859
- Stone & van Velzen (2016) Stone N. C., van Velzen S., 2016, ApJ, 825, L14
- Tonry et al. (2018) Tonry J. L., et al., 2018, PASP, 130, 064505
- Wevers et al. (2017) Wevers T., van Velzen S., Jonker P. G., Stone N. C., Hung T., Onori F., Gezari S., Blagorodnova N., 2017, MNRAS, 471, 1694
- Wevers et al. (2019a) Wevers T., Stone N. C., van Velzen S., Jonker P. G., Hung T., Auchettl K., Gezari S., Onori F., 2019a, arXiv e-prints, 1902.04077
- Wevers et al. (2019b) Wevers T., et al., 2019b, arXiv e-prints, 1903.12203
- Worthey & Ottaviani (1997) Worthey G., Ottaviani D. L., 1997, ApJS, 111, 377
- Wright et al. (2010) Wright E. L., et al., 2010, AJ, 140, 1868
- Wyrzykowski et al. (2017) Wyrzykowski Ł., et al., 2017, MNRAS, 465, L114
- Yaron & Gal-Yam (2012) Yaron O., Gal-Yam A., 2012, PASP, 124, 668
- Zauderer et al. (2011) Zauderer B. A., et al., 2011, Nature, 476, 425
- van Velzen (2018) van Velzen S., 2018, ApJ, 852, 72
- van Velzen et al. (2011) van Velzen S., et al., 2011, ApJ, 741, 73
- van Velzen et al. (2013) van Velzen S., Frail D. A., Körding E., Falcke H., 2013, A&A, 552, A5
- van Velzen et al. (2016) van Velzen S., et al., 2016, Science, 351, 62
- van Velzen et al. (2018) van Velzen S., Stone N. C., Metzger B. D., Gezari S., Brown T. M., Fruchter A. S., 2018, arXiv e-prints,
- van Velzen et al. (2019) van Velzen S., et al., 2019, ApJ, 872, 198
| MJD | Phase (d) | Magnitude | Error | Band | Telescope | MJD | Phase (d) | Magnitude | Error | Band | Telescope |
|---|---|---|---|---|---|---|---|---|---|---|---|
| 57905.6 | -14.5 | 20.14 | 0.18 | o | ATLAS | 57978 | 50.9 | 20.03 | 0.34 | U | Swift/UVOT |
| 57911.6 | -9.1 | 19.7 | 0.04 | i | PS1 | 57978 | 50.9 | 19.39 | 0.24 | W1 | Swift/UVOT |
| 57926.6 | 4.5 | 19.57 | 0.14 | o | ATLAS | 57978 | 50.9 | 19.28 | 0.18 | M2 | Swift/UVOT |
| 57932.6 | 9.9 | 19.99 | 0.12 | o | ATLAS | 57978 | 50.9 | 18.83 | 0.11 | W2 | Swift/UVOT |
| 57936.6 | 13.5 | 20.03 | 0.14 | o | ATLAS | 57979.2 | 52 | 21.1 | 0.13 | g | Swope |
| 57938.5 | 15.3 | 20.09 | 0.03 | i | PS1 | 57979.2 | 52 | 21.16 | 0.14 | r | Swope |
| 57945 | 21.1 | 19.05 | 0.2 | U | Swift/UVOT | 57979.2 | 52 | 21.25 | 0.13 | i | Swope |
| 57945 | 21.1 | 18.82 | 0.18 | W1 | Swift/UVOT | 57981.4 | 53.9 | 20.71 | 0.21 | B | Keck/LRIS |
| 57945 | 21.1 | 18.45 | 0.13 | M2 | Swift/UVOT | 57981.5 | 53.9 | 20.76 | 0.21 | V | Keck/LRIS |
| 57945 | 21.1 | 18.28 | 0.09 | W2 | Swift/UVOT | 57981.4 | 53.9 | 20.82 | 0.19 | R | Keck/LRIS |
| 57951.3 | 26.8 | 20.47 | 0.05 | g | Magellan/IMACS | 57981.5 | 53.9 | 21.01 | 0.18 | I | Keck/LRIS |
| 57951.3 | 26.8 | 20.96 | 0.04 | r | Magellan/IMACS | 57997.4 | 68.4 | 21.54 | 0.13 | g | FLWO48/Kepcam |
| 57951.3 | 26.8 | 20.93 | 0.05 | i | Magellan/IMACS | 57997.4 | 68.4 | 21.89 | 0.24 | r | FLWO48/Kepcam |
| 57951.3 | 26.8 | 21.31 | 0.05 | z | Magellan/IMACS | 57997.4 | 68.4 | 21.31 | 0.2 | i | FLWO48/Kepcam |
| 57952.6 | 27.9 | 20.49 | 0.23 | o | ATLAS | 58002 | 72.5 | 19.66 | 0.49 | W1 | Swift/UVOT |
| 57953 | 28.3 | 19.55 | 0.27 | U | Swift/UVOT | 58002 | 72.5 | 19.01 | 0.28 | M2 | Swift/UVOT |
| 57953 | 28.3 | 19.06 | 0.2 | W1 | Swift/UVOT | 58002 | 72.5 | 19.49 | 0.28 | W2 | Swift/UVOT |
| 57953 | 28.3 | 18.75 | 0.15 | M2 | Swift/UVOT | 58006 | 76.1 | 19.56 | 0.29 | M2 | Swift/UVOT |
| 57953 | 28.3 | 18.33 | 0.09 | W2 | Swift/UVOT | 58006 | 76.1 | 19.32 | 0.22 | W2 | Swift/UVOT |
| 57956.3 | 31.3 | 20.59 | 0.04 | g | Magellan/LDSS | 58010.2 | 79.9 | 21.63 | 0.09 | g | FLWO48/Kepcam |
| 57956.3 | 31.3 | 20.88 | 0.08 | r | Magellan/LDSS | 58012 | 81.5 | 19.62 | 0.24 | M2 | Swift/UVOT |
| 57956.3 | 31.3 | 21.12 | 0.11 | i | Magellan/LDSS | 58012 | 81.5 | 19.57 | 0.21 | W2 | Swift/UVOT |
| 57956.3 | 31.3 | 20.92 | 0.35 | z | Magellan/LDSS | 58012.2 | 81.7 | 21.63 | 0.26 | g | Swope |
| 57956.5 | 31.5 | 20.21 | 0.21 | o | ATLAS | 58012.2 | 81.7 | 21.00 | r | Swope | |
| 57964.5 | 38.7 | 20.7 | 0.22 | o | ATLAS | 58012.2 | 81.7 | 21.62 | 0.2 | i | Swope |
| 57965.5 | 39.6 | 20.78 | 0.13 | g | FLWO48/Kepcam | 58019.1 | 87.9 | 21.85 | 0.32 | g | Swope |
| 57965.5 | 39.6 | 20.8 | 0.11 | g | FLWO48/Kepcam | 58019.1 | 87.9 | 21.26 | r | Swope | |
| 57965.5 | 39.6 | 21.08 | 0.14 | r | FLWO48/Kepcam | 58019.1 | 87.9 | 21.97 | 0.2 | i | Swope |
| 57965.5 | 39.6 | 21.05 | 0.19 | i | FLWO48/Kepcam | 58028.1 | 96.1 | 21.82 | 0.15 | g | FLWO48/Kepcam |
| 57968 | 41.8 | 20.05 | 0.37 | U | Swift/UVOT | 58028.1 | 96.1 | 22.08 | 0.14 | r | FLWO48/Kepcam |
| 57968 | 41.8 | 19.13 | 0.21 | W1 | Swift/UVOT | 58028.1 | 96.1 | 22.01 | g | Swope | |
| 57968 | 41.8 | 18.99 | 0.17 | M2 | Swift/UVOT | 58028.1 | 96.1 | 21.50 | r | Swope | |
| 57968 | 41.8 | 18.64 | 0.1 | W2 | Swift/UVOT | 58028.1 | 96.1 | 22.25 | 0.24 | i | Swope |
| 57973 | 46.4 | 19.22 | 0.45 | W1 | Swift/UVOT | 58035.1 | 102.4 | 22.25 | g | Swope | |
| 57973 | 46.4 | 18.89 | 0.28 | M2 | Swift/UVOT | 58035.1 | 102.4 | 21.56 | r | Swope | |
| 57973 | 46.4 | 19.07 | 0.26 | W2 | Swift/UVOT | 58035.1 | 102.4 | 22.36 | i | Swope |
Note: ATLAS photometry has been shifted by mag to match the colours inferred from spectroscopy
| MJD | Phase (d) | Telescope | Instrument | Grating | Exposure (s) | Airmass |
|---|---|---|---|---|---|---|
| 57933.4 | 10 | MMT | Blue Channel | 300GPM | 900 | 1.1 |
| 57953.2 | 28 | Magellan | IMACS | G300-17.5 | 1500 | 2.1 |
| 57956.3 | 31 | Magellan | LDSS3c | VPH-all | 31200 | 1.5 |
| 57991.3 | 62 | MMT | Blue Channel | 300GPM | 1800 | 1.1 |
| 58046.0 | 112 | Magellan | IMACS | G300-17.5 | 41200 | 1.5 |
| 58083.1 | 145 | MMT | Blue Channel | 300GPM | 31200 | 1.1 |
| 58277.4 | 321 | MMT | Binospec | 270 | 1800 | 1.3 |
| MJD | Phase (d) | Frequency (GHz) | Image RMS (Jy) | Flux (Jy) |
|---|---|---|---|---|
| 57948.5 | 25 | 6.0 | 9.0 | |
| 57948.5 | 25 | 21.7 | 27.0 | |
| 57987.5 | 61 | 6.0 | 8.8 | |
| 57987.5 | 61 | 21.7 | 25.0 | |
| Combined | 43 | 6.0 | 6.0 | |
| Combined | 43 | 21.7 | 17.0 |
| MJD | Phase | Telescope | Instrument | Duration | Count rate | 0.3-10 keV flux |
|---|---|---|---|---|---|---|
| (d) | (ks) | (s-1) | (erg s-1 cm) | |||
| 57162.5 | XMM | MOS-1 | 14.1 | |||
| 57951.5 | 27 | Swift | XRT | 5.7 | ||
| 57981.5 | 54 | Chandra | ACIS-S | 10 | ||
| 58487.5 | 510 | Chandra | ACIS-S | 10 |