Constraints on a Putative Planet Sculpting the V4046 Sagittarii Circumbinary Disk
Abstract
We analyze the highest-resolution millimeter continuum and near-infrared (NIR) scattered-light images presented to date of the circumbinary disk orbiting V4046 Sgr, a 20 Myr old actively accreting, close binary T Tauri star system located a mere 72.4 pc from Earth. We observed the disk with the Atacama Large Millimeter/submillimeter Array (ALMA) at 870 during Cycle 4, and we analyze these data in conjunction with archival NIR (H band) polarimetric images obtained with SPHERE/IRDIS on the ESO Very Large Telescope. At 0.3′′ (20 au) resolution, the 870 image reveals a marginally resolved ring that peaks at 32 au and has an extension of 90 au. We infer a lower limit on dust mass of 60.0 M⊕ within the 870 ring, and confirm that the ring is well aligned with the larger-scale gaseous disk. A second, inner dust ring is also tentatively detected in the ALMA observations; its position appears coincident with the inner (14 au radius) ring detected in scattered light. Using synthetic 870 and H-band images obtained from disk-planet interaction simulations, we attempt to constrain the mass of the putative planet orbiting at 20 au. Our trials suggest that a circumbinary Jovian-mass planet may be responsible for generating the dust ring and gap structures detected within the disk. We discuss the longevity of the gas-rich disk orbiting V4046 Sgr in the context of the binary nature of the system.
1 Introduction
Observations of circumstellar disks composed of cold dust and molecular gas around young ( 30 Myr) stellar objects provide crucial information about the formation of planets. Ideally, direct detections of newborn planets within such disks may provide fundamental constraints on planet formation theories. However, current observational tools are limited by a range of complicating factors such as contrast ratios and inner working angles, and, as a result, indirect detection methods are needed to predict when, where and how planets form. Observations with high spatial resolution can detect signposts of a forming planet, such as disk gaps (e.g Andrews et al., 2016) or spiral arms (e.g Benisty et al., 2015) resulting from planet-disk gravitational interactions. Comparing such structures with theoretical models of disk-planet interactions can provide essential parametrizations and characterizations of the formation and evolution of planetary systems (Fung & Dong, 2015; Dong & Fung, 2017).
Furthermore, most Sun-like stars form in binary or multiple systems (Duquennoy & Mayor, 1991), some of which will host circumbinary disks. The study of such disks is necessary to determine whether their conditions are conducive to the formation of circumbinary planets. Indeed, the lifetimes of circumbinary disks may exceed those of disks orbiting single stars (Alexander, 2012). The time available for the formation of a circumbinary planet, and its location of formation, should indicate the likely building mechanism, i.e., core accretion (Pollack et al., 1996) vs. gravitational instability (Boss, 1997).
The circumbinary, protoplanetary disk orbiting the nearby, actively accreting pre-main sequence binary system V4046 Sgr (Kastner et al., 2018, and references therein) offers the highly unusual opportunity to explore the observational signatures of circumbinary planet-disk interactions. The V4046 Sgr system lies at a mere 72.470.34 pc (Gaia Collaboration et al., 2018), and is a member of the Pictoris moving group (Zuckerman & Song, 2004), fixing its age at 233 Myr (Mamajek & Bell, 2014). The central binary consists of a nearly equal-mass pair of K-type stars with masses of 0.90 0.05 and 0.85 0.04 (Rosenfeld et al., 2012) in a tight and nearly circular orbit (P 2.4 d, 0.01; Stempels & Gahm, 2004). Rodriguez et al. (2010) and Rosenfeld et al. (2013) used Submillimeter Array (SMA) interferometry to establish that the V4046 Sgr binary system is surrounded by a massive (0.1 ), gas-rich circumbinary disk extending to 300 au. As delineated in the subarcsecond ALMA molecular line imaging study by Kastner et al. (2018), the molecular disk is characterized by extended, centrally peaked CO and HCN emission and a sequence of sharp and diffuse rings of emission from HC3N, CH3CN, DCN, DCO+, C2H, N2H+, and H2CO.
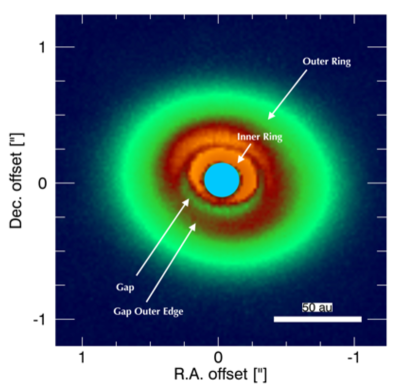
From analysis of SMA 1.3 mm continuum observations, Rosenfeld et al. (2013) reported a large inner hole of 30 au with the majority of the dust mass residing in a narrow ring centered at 37 au. Subsequent ALMA mm-wave imaging at 0.5′′ resolution has confirmed this result (Huang et al., 2017; Guzmán et al., 2017; Bergner et al., 2018; Kastner et al., 2018). Coronagraphic/polarimetric 3 au resolution Gemini Planet Imager (GPI) imaging of scattered light from dust grains revealed the presence of a double-ring structure in the dust distribution (Rapson et al., 2015a). The double-ring morphology presented an inner cavity 10 au in radius, a narrow ring with a peak flux at 14 au and a dust gap at 20 au, where the second ring begins and extends to 45 au. More recently, confirming the double-ring scattered light structure, Avenhaus et al. (2018) reported rings centered at 15 au and 27 au, on the basis of SPHERE/IRDIS polarimetric differential imaging in the J and H bands.
Near Infrared (NIR) polarized and millimeter observations serve as complementary probes of the surface structure and distribution of material in the midplane regions of a disk, allowing the identification of the “dust filtration” effect resulting from the pressure maximum outside a gap opened by a forming planet (Pinilla et al., 2012; Dong et al., 2012). Although considerable effort has been invested in generating high-fidelity simulations of NIR scattered-light and mm continuum observations (e.g. Debes et al., 2013; Dong et al., 2018), examples of attempts to model real disks in both wavelength regimes simultaneously remain few and far between (e.g. Baruteau et al., 2019).
In this paper, we present the results of simultaneous comparisons of SPHERE and ALMA data with detailed two-dimensional two fluid (gas + particle) hydrodynamical calculations coupled with three-dimensional Monte Carlo Radiative Transfer simulations (Dong et al., 2012, 2015), so as to explore the observational signatures of gaps possibly opened by a single planet in the V4046 Sgr circumbinary disk. This paper is organized as follows. In Section 2, we describe the observations and the data reduction process, while in Section 3, we present the main results. In Section 4, we describe the morphology and main features of V4046 Sgr detected by ALMA and SPHERE data. In Section 5, the disk model and Monte Carlo Radiative Transfer (MCRT) simulations are presented, followed by a discussion in Section 6. Section 7 summarizes our main results and conclusions.
2 OBSERVATIONS AND DATA REDUCTION
870 µm 1.65 µm
2.1 ALMA Observations
ALMA Band 7 (345 GHz) observations of V4046 Sgr were obtained on May 09, 2017 as part of the Cycle 4 program 2016.1.00315.S. The phase center of the observations is (J2000) = 18h 14m 10.47s ; (J2000) = -32o47 34.50. The array configuration was C40-5 with a longest baseline of 1.1 km. The correlator was set up with four spectral windows in dual polarization mode, centered at 330.616 GHz, 345.825 GHz, 344.031 GHz, and 332.531GHz, and the bandwidths used were 937.5, 468.8, 2000.0 and 2000.0 MHz, respectively. The total on-source integration time was 11.7 minutes. Analysis of the CO isotopologue emission covered by the first two (narrower) basebands at 330 and 345 GHz will be presented in a forthcoming paper (Ruiz-Rodriguez et al., in preparation). In this paper, we focus exclusively on the data obtained in the latter two (continuum mode) configurations.
The broadband (2 GHz baseband) 332 and 344 GHz visibility data analyzed here were edited, calibrated and imaged using the pipeline version r39732 in CASA 4.7.2. The quasar J1826-2924 was observed as phase calibrator, J1823-3454 was used as flux calibrator, while the quasar J1924-2914 was observed for bandpass calibration. We applied self-calibration with three rounds of phase calibration, and used the TCLEAN algorithm to image the data using two different Briggs weighting values. First, we set the Briggs weighting (robust) parameter to , to achieve a balance between resolution and sensitivity. The resulting rms was 0.10 mJy beam-1 within a bandwidth of 5.29 GHz and a synthesized beam of 0.29 0.17 at P.A. -79.7o. Second, we applied uniform weighting () to optimize the spatial resolution, resulting in a synthesized beam of 0.2 0.1 at P.A. -79.7o with rms of 0.18 mJy beam-1. The images were constructed on a 256 256 pixel grid with 20 mas pixel size. The two Briggs weighting values provide comparable integrated flux densities. For most of the analysis presented here, we consider the image reconstruction using , to prioritize signal-to-noise over spatial resolution. The image reconstruction is analyzed in Section 4.2.
2.2 SPHERE Observations
The archival H-band polarimetric images of V4046 Sgr presented in this work were obtained on March 13, 2016 with the ESO Very Large Telescope (VLT) SPHERE-IRDIS instrument using the N ALC YJH S coronagraph. Images were taken with the BBH filter in polarimetric differential imaging (PDI) mode with a total integration time of 3072 seconds. A complete description of these data was presented in Avenhaus et al. (2018).
The SPHERE data were reduced and analyzed using the EsoReflex pipeline (v. 2.8.5) and the SPHERE IRDIS workflow (v. 0.31.0) where data were collected, organized, and reduced to account for darks, flats, star centering and de-rotation. Polarimetric images were then further reduced following the procedure described in Avenhaus et al. (2014, 2018). The SPHERE instrument separates the beam into two orthogonal states, the so-called ordinary and extraordinary beams. A pre-correction for instrumental polarization was performed by normalizing the flux in the ordinary and extraordinary beams using the presumed unpolarized halo emission signature from the central star. We determine the halo ordinary and extraordinary flux ratio = (fo / fe) in an aperture with inner and outer radius of 47 and 72 pixels from the image center, respectively, and then multiply the extraordinary beam by ()1/2 and the ordinary beam by (-1/2.
We calculate the Stokes vectors following Avenhaus et al. (2014, 2018):
| (1) |
with
| (2) |
where the subscripts indicate the ordinary and extraordinary beams while the superscripts indicate the position of the half-wave plate angle. The Stokes Q and U are then determined by:
| (3) |
where the total intensity (I) is:
| (4) |
| (5) |
Assuming single scattering events, the light scattered from the disk should be linearly polarized in the azimuthal direction so we use the radial stokes parameters and :
| (6) |
| (7) |
| (8) |
where is the angle between up on the detector and a line from the star (at position , ) to a position on the detector. The offset angle optimizes the reduction to correct for potential misalignment of the of the half-wave plate or rotated polarization.
3 RESULTS
In this section, we present and analyze the ALMA and SPHERE data individually, to characterize the radial and azimuthal structure of the disk in continuum emission and in scattered light (respectively). First, we describe and quantify the ALMA 870 continuum data in terms of their main parameters (i.e. emission morphology, flux density, minimum dust mass; Sec. 3.1). Then we parameterize radial profiles extracted from the SPHERE H band data so as to estimate the sizes and locations of the gaps and rings observed in scattered light (Sec. 3.2).
3.1 Continuum Emission at 870
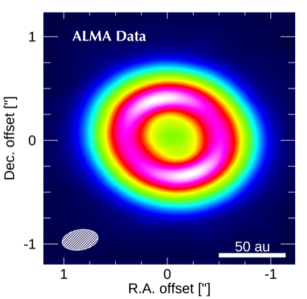
The ALMA Cycle 4 Band 7 image of the intermediate inclination V4046 Sgr circumbinary disk is displayed in the top left panel of Figure 1. The 870 continuum image reveals a well-defined ring with a large central hole. We measure the radius and width of this ring in two stages: first, obtain estimates of the inclination and the position angle (P.A.) of the ring, by fitting a surface brightness model in the visibility domain (Sec. 3.1.1); second, we use these parameters to deproject the ring and obtain its radius and width from Gaussian fitting of the resulting image plane radial profile (Sec. 3.1.2).
3.1.1 Inclination and P.A.
Considering that the dust continuum emission at 870 is resolved, and it is concentrated into a ring that shows an azimuthal uniformity in intensity, we estimated the inclination, position angle and continuum flux density by fitting an elliptical Gaussian directly to the visibility data. To that end, we used the CASA routine uvmodelfit (Martí-Vidal et al., 2014), which fits a single component source model (i.e., point-source, Gaussian, or disk) to the () visibility data.
This fit yields a disk inclination of 32.42∘ 0.07 and a P.A. of 74.33∘ 0.14. We verified the inclination by using only short baselines within the range 0–450 k (location of the null in the real part of the visibilities). In addition, we find an 870 continuum flux density of 876.30 0.51 mJy, where the uncertainty is the formal error resulting from the fit.
3.1.2 Radial Profiles
We used this best-fit inclination and P.A. (32.42∘ 0.07 and 74.33∘ 0.14, respectively) to deproject the ALMA and SPHERE images. We then extracted radial profiles from the deprojected images and performed Gaussian fitting, so as to characterize the properties of the flux maxima.
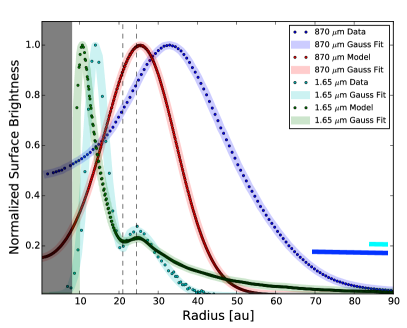
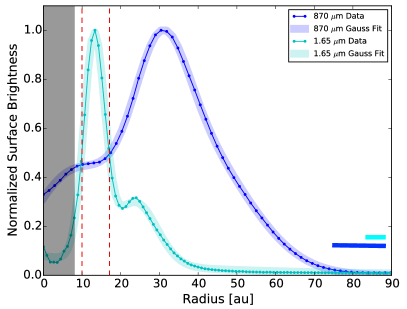
The radial profiles from the ALMA continuum images were azimuthally averaged, while the radial profiles from the SPHERE scattered-light images were obtained as the averages over wedges with opening angles of 20∘ oriented along the disk major axis (see Section 3.2). The resulting radial profiles and Gaussian fits are displayed in Figure 2. We achieved these fits with a superposition of an average of three Gaussians for every profile, where this number of components is required to account for the significant asymmetries in the profiles. The best-fit parameters are listed in Table 1. We find that, for the beam size of 20 au12 au (at 72.4 pc), the 870 continuum emission peaks at 32.30 0.14 au, with a FWHM of 37.30 2.74 au and outer radius of 90 au.
The comparison of ALMA and SPHERE continuum emission features and morphologies is described in more detail in Section 4.
| Parameter | ALMA | SPHERE | ||||||||
|---|---|---|---|---|---|---|---|---|---|---|
| Data | Model | Data | Model | |||||||
| 0.3 | 1.5 | 0.3 | 1.5 | |||||||
| Ring 1 | Ring 2 | Ring 1 | Ring 2 | Ring 1 | Ring 2 | |||||
| Radius [au] | 32.30 0.14 | 26.62 0.01 | 31.90 0.03 | 14.10 0.01 | 24.62 0.08 | 10.90 0.12 | 24.67 0.20 | 10.62 0.02 | 29.33 0.19 | |
| FWHM [au] | 37.30 2.74 | 23.94 0.01 | 24.43 0.03 | 6.65 0.08 | 3.70 0.01 | 6.26 0.60 | 4.75 0.09 | 5.13 0.43 | 11.20 0.33 | |
3.1.3 Disk Mass
In the optically thin emission regime, dust mass can be estimated from the measurement of the (sub-)millimeter continuum flux at a given frequency (Hildebrand, 1983). Specifically, assuming isothermal emission and the canonical interstellar medium (ISM) gas-to-dust ratio of 100 (Bohlin et al., 1978), the dust mass (Mdust) can be related to the integrated 870 flux, F870µm, via
| (9) |
where is the distance to the source, is the dust grain opacity (we adopt 0.02 at 870 with = 1.5; Beckwith et al. (1990)) and ) is the Planck function at a characteristic dust temperature (Tdust).
To estimate , we adopt the brightness temperature calculated from the peak flux per beam, K. From Eq. 9, we thereby obtain a dust mass of for the dust ring imaged by ALMA. If we instead adopt the expected equilibrium temperature expected for a dust ring located 30 au from the V4046 Sgr binary, K, the dust mass inferred from Eq. 9 would be a factor 2 smaller. However, the fact that the peak observed brightness temperature is within a factor two of the estimated equilibrium dust temperature indicates that the 870 m emission is likely optically thick. Hence, the estimate obtained from Eq. 9 assuming K most likely represents a lower limit on the dust mass within the ring imaged by ALMA.
3.2 Scattered Light at 1.65
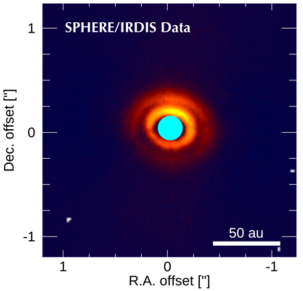
The top right panel of Figure 1 shows SPHERE imaging of the V4046 Sgr circumbinary disk, revealing two rings, a cavity and a gap in scattered light (Rapson et al., 2015a; Avenhaus et al., 2018). In the SPHERE images, as in previous GPI imaging (Rapson et al., 2015a), the surface brightness of the rings show an asymmetry between the northern and southern sides. This surface brightness asymmetry is most likely due to preferential forward scattering by the dust grains along the line-of-sight (e.g. Schneider et al., 2009). Hence, we confirm the conclusion of Rapson et al. (2015a) that the observed brightness asymmetry is an indication that the disk is tipped such that the northern side is closer to Earth.
Because the scattered-light asymmetry is confined to the minor axis of the (projected) disk, we averaged over wedges with opening angle of 20∘ along the disk major axis to generate radial profiles of the surface brightness (e.g. Dong & Fung, 2017). From the parametrization of the radial profiles (Section 3.1.2), we obtain an inner cavity radius of 9.8 au. This is well outside the inner working angle of the coronagraph ( 0.1” = 7.3 au at 72.4 pc). In addition, we determine that ring 1 (inner ring) and 2 (gap outer edge) are located at 14.10 0.01 and 24.62 0.08 au, respectively, from the central binary (Table 1), with an inter-ring gap width of 5 au. The ring peak locations determined by Avenhaus et al. (2018) are somewhat larger than determined here, because those authors scaled the surface brightness by r2 to remove the effects of a diluted stellar radiation field, and they analyzed azimuthally averaged surface brightness curves.
4 Morphology
4.1 ALMA vs. SPHERE Images: Main Features
An overlay of the ALMA and SPHERE images for V4046 Sgr is shown in Figure 3. The latter (NIR scattered light) observations trace micron-sized particles residing at the disk surface high above the midplane, while the former (millimeter continuum) observations are more sensitive to larger particles (100 ) near the midplane. Recent studies comparing scattered light and millimeter continuum data have revealed a wavelength dependency in the location of cavity and gap edges, wherein millimeter continuum observations trace larger cavities and gap edges than scattered light (e.g. Uyama et al., 2018; Hendler et al., 2018). This is the result of the close coupling between gas and micron-sized dust particles and the dearth of mm-sized dust within the cavities and gaps.
From the surface brightness profiles (see Figure 2 and Table 1), we deduce that the inner scattering wall of the ring traced by the 870 emission is located at a radius of 25 au from the central binary, while the intensity minimum between inner and outer rings is located at 20 au. We draw vertical lines in Figure 2 indicating the location of this gap and the outer gap edge, which corresponds to the inner scattering wall of the 870 continuum emission ring (see annotations in Figure 3).
In theory, the dust distribution near the disk surface follows a power law profile described by , where the disk scale height is modulated by a flaring index 0, an irradiated disk would have a typical value for the flaring parameter of 1.3 (Chiang & Goldreich, 1997). In their analysis of the SPHERE scattered light imaging, Avenhaus et al. (2018) obtained estimates of flaring indexes of 0.1 for ring 1 and 1.6 for ring 2. The latter is similar to the theoretical value, indicating a flared disk. This is surprising given the fact that at an age 20 Myr, one expects significant settling of material to the midplane. However, it is important to consider that the theoretical flaring index of 1.3 depends on temperature and assumes a uniform dust-to-gas ratio throughout the disk.
If the micron-sized grain population is well coupled to the gas, then there may exist a considerable small particle population in the disk of V4046 Sgr that potentially reaches to the outer edge of the molecular disk.
This is the case for TW Hya, where scattered light observations trace a significant population of small dust particles
out to at least 230 au (van Boekel et al., 2017). Indeed, it is possible that the relatively large flaring index of 1.6 found for the outer scattered-light ring of the V4046 Sgr disk indicates that the particles near the gap outer edge are well dispersed from the disk plane, where they can scatter starlight efficiently, while at radii larger than 60 au, the disk may become undetectable in scattered light due to self-shadowing and not necessarily because the disk lacks small grains at these radii. If self-shadowing explains the lack of surface brightness beyond 60 au, we would expect the disk surface to lie in a more expanded and flattened shape and, as noted, the small-grain disk may extend to, or even beyond, the gas disk detected in CO (i.e., to 300 au; Kastner et al., 2018).
4.2 An Inner Ring in the mm Continuum?
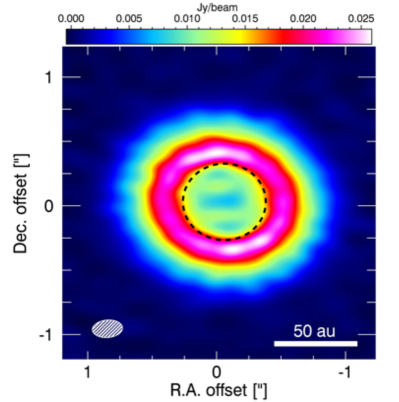
In Figure 4, we display the ALMA 870 continuum image generated with a Briggs parameter of , to optimize spatial resolution rather than sensitivity. From this image, we obtain an integrated flux over the elliptical region interior to the main ring (dashed ellipse in Figure 4) of 83.0 8.0 mJy (assuming a 10% flux calibration accuracy). This integrated flux can be ascribed to the marginally resolved structure(s) revealed by the ALMA millimeter continuum data within 20 au of the central binary.
This higher-resolution ALMA 870 continuum image provides an additional point of comparison with the SPHERE near-IR imaging. Figure 5 shows the normalized azimuthally averaged radial intensity profile extracted from the ALMA continuum image overlaid on the SPHERE H-band radial profile. Following the analysis described in Section 3.1.2, we fitted Gaussian functions to the surface brightness profile of the image obtained using . Perhaps not surprisingly, the resulting FWHM of the dominant Gaussian, 28.20 0.04 au, is significantly smaller than that obtained using (37 au; Table 1). More significantly, after increasing the resolution of the continuum image obtained from the ALMA data, the observed ring width (28 au) now more closely resembles the width of the outer ring obtained from the synthetic images (24 au; Table 1).
Interestingly, the radial profile obtained from the ALMA continuum image shows a distinct shoulder between 10 and 17 au, which closely corresponds to the position and width of the inner ring traced by the NIR data (Fig. 5). These spatially coincident features indicate that the inner ring includes a significant mass of mm-sized grains, in addition to the submicron-sized grains traced in scattered light.
5 MODELING V4046 Sgr
Our millimeter continuum image together with the scattered light image reveal a complex structure in the disk: an inner cavity surrounded by an inner ring, a dust gap, and an outer ring (Figures 1 and 3). The millimeter continuum image reveals a cavity and a bright outer ring with peak intensity at 32.30 0.14 au, while the scattered light image displays an inner cavity with a radius of 9 au, an inner ring located at 14.10 0.01 au, a gap at 20 au, and an outer ring coinciding with the inner edge of the mm continuum ring (Table 1). In the following, we explore the possibility that these features might be signposts of ongoing planet formation. Specifically, we investigate whether the gap at 20 au detected in the SPHERE scattered-light imaging and the ring/cavity structure imaged in the mm continuum by ALMA can be modeled in terms of interactions between the V4046 Sgr disk and a single planet. We note that the inner cavity in scattered light (and the associated inner ring at 14 au) is not included in our modeling. We only focus on the gap at 20 au, and investigate the hypothesis that it may be produced by a single planet.
5.1 Nominal Model
The models we employ are the results of the 2D two-fluid (gas + particle) hydrodynamic calculations of planet-disk interactions combined with 3D Monte Carlo radiative transfer (MCRT) simulations presented in Dong et al. (2015). In order to calculate the surface density distribution of the gas and dust, 2D (radial and azimuthal) two-fluid simulations were obtained using the FARGO code (Masset, 2000). The distributions of small and large grains are treated independently to generate the NIR and millimeter images. The model dust disk is primarily composed of small dust particles ( 0.02 to 1 ) containing silicate, graphite, and amorphous carbon grains (Kim & Martin, 1994), with an additional component of large dust particles ( 0.9 to 1 mm) containing 2/3 silicate (density 3.3 g cm-3) and 1/3 graphite (density 2.3 g cm-3). The surface brightness is calculated via the anisotropic scattering phase function developed by Henyey & Greenstein (1941), while the radiative equilibrium temperature stratification is calculated following the radiative equilibrium algorithm presented in Lucy (1999). To compute synthetic H-band (1.65 ) scattered light and 870 continuum images, the radiative transfer package HOCHUNK3D is utlized (Whitney et al., 2013). More details of the disk setup and optical properties can be found in Dong et al. (2012) and Dong et al. (2015).
5.2 Constraints on Putative Planet Mass
Since the width and depth of a gap that can be opened by a planet depend most sensitively on planet mass, if disk viscosity and scale height are fixed (e.g. Dong & Fung, 2017), the characteristic surface density profiles imposed on the disk for an ad hoc planet serve as a guide to narrow the range of potential planet masses. Such an approach was used to constrain the masses of putative planets forming in the disks orbiting TW Hya and LkHa 330 by Rapson et al. (2015b) and Uyama et al. (2018), respectively. In the present case, we used the library of fiducial hydrodynamical models presented in Dong et al. (2015) to explore a range of ad hoc planet masses, examining whether their surface brightness profiles accurately reproduce the parameters measured for the scattered light (SPHERE) and thermal emission (ALMA) images (Table 1). Based on these tests, we established that the NIR and mm-observations set the likely lower and upper planet mass bounds, respectively. We call such bounds Model 1 and Model 2.
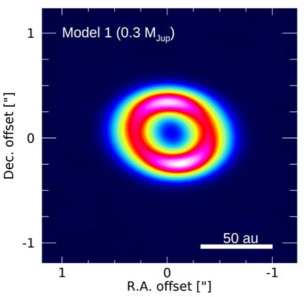
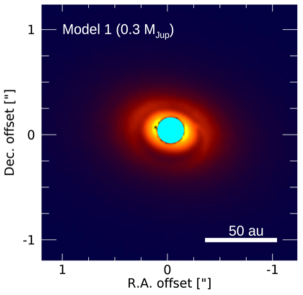
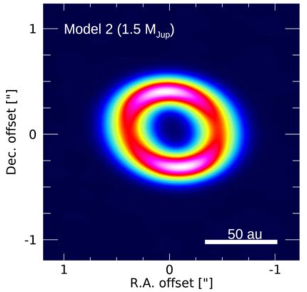
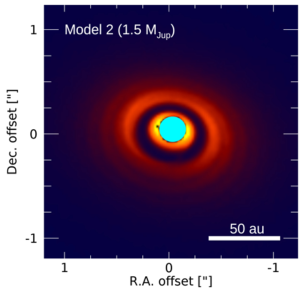
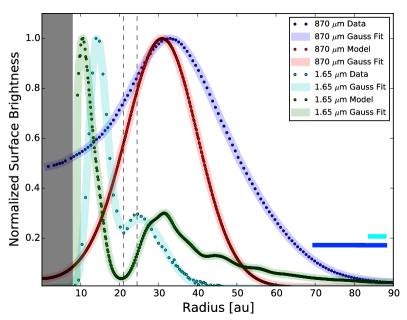
In these models, and all other models we explored, the radial location of the forming planet is fixed in a circular orbit at the location of the gap, i.e., 20 au. Because the separation of the two stellar components is only 0.041 au, the central source can be considered a single star of mass 1.75 M⊙ (Rosenfeld et al., 2012). We adopt the disk inclination of 32o deduced from modeling the continuum emission (Section 3.1.1). To compare the simulated images to the observations, we convolve the simulated H-band images with a Gaussian point-spread function to achieve 0.04” resolution ( 3.0 au at 72.4 pc), while the simulated ALMA images were produced by using simobserve and simanalyze tasks in CASA to generate images convolved with the output clean beam (0.29”0.17” beam, or 20 au12 au at 72.4 pc). The resulting synthetic images for Models 1 and 2 are shown in the middle and bottom panels of Figure 1, respectively. The corresponding radial profiles obtained from the deprojected synthetic images (extracted just as for the observations; see Section 3.1.2) are presented in the left (Model 1) and right (Model 2) panels of Figure 2, overlaid on the observed radial profiles.
Model 1, 0.3 MJup
A first inspection of the left panel of Figure 2 shows that, overall, the surface brightness profiles of the model disk structures resulting from interactions with a 0.3 MJup planet — i.e., the bright rings and cavity in the model — are comparable to the structures detected by SPHERE (scattered light) and ALMA (thermal emission). In particular, the gaps at 20 au have similarly shallow depths in the observed and synthetic scattered-light radial profiles, and the model well reproduces the radial position of the outer scattered-light ring. As stated before, the inner cavity and the 14 au ring in scattered light is beyond the scope of our modeling effort here.
On the other hand, the 870 continuum emission model generates a ring peaking at 27 au with a FWHM of 24 au, which differ significantly from the corresponding parameters characterizing the ALMA data (peak radius 32 au, FWHM 37 au). Given that the emission cavity and ring diameter imaged in thermal emission at mm wavelengths scale with planet mass (Dong et al., 2015), these discrepancies between the observed and Model 1 ALMA images indicate that the putative planet mass is somewhat larger than 0.3 MJup.
Model 2, 1.5 MJup
In Model 2, the dust rings and gap in the disk have been displaced radially, and as a result, the radii of the model and observed peak intensities of mm-wave thermal emission in the outer ring of the disk are in excellent agreement (Table 1).
In this model, as in Model 1, we find a width of 24 au for the mm-wave emission, meaning that although the larger planet mass has resulted in a larger inner cavity, the population of large grains is nevertheless still confined to a narrow ring. However, in the case of the synthetic scattered light image, the model gap at 20 au is wider and deeper than observed.
This wider and deeper gap reflects the fact that, in Model 2, the planet is massive enough to open a gap whose surface density is reduced by several orders of magnitude relative to that of the local disk.
6 Discussion
The semi-quantitative agreement between observations and models is encouraging (Figure 2 and Table 1); these comparisons suggest that the gap around 20 au in the system may be opened by a Jovian planet, and the two models may bracket the mass of this putative planet. We emphasize that the models are not fine tuned to fit the observations; instead, they are generic models with parameterized profiles, and only the mass of the planet is varied in our limited explorations. Additional fundamental disk parameters, such as the viscosity, the scale height, and the overall gas surface density are all known to affect the gap profile in the gas and in mm-sized grains (e.g. Fung et al., 2014); we have not explored the effects of varying these parameters in our modeling. In the following, we discuss specific aspects of (and some caveats to) the observational and modeling results described in the preceding sections, and their interpretation.
6.1 A Planetary Companion
In the MCRT images, the continuum millimeter synthetic images clearly reveal a cavity and a bright outer ring with peak intensities at 27 au and 32 au for 0.3 MJup and 1.5 MJup, respectively. This reflects the fact that, in our modeling, the peak intensities in the millimeter are at larger radii as planet mass increases. The difference in the location of the peak intensities is not due to a radiative transfer effect; instead, it can be attributed to the millimeter emission that linearly scales with the surface density of the large grains (1 mm). With our planet fixed in its orbit (i.e., 20 au) and with no variation in disk viscosity and scale height, the width of the cavity at millimeter wavelengths is determined mainly by planet mass, because the large grains are being trapped and piled up due to a gas pressure bump induced by the planetary companion (Pinilla et al., 2012).
Similarly, in the simulated H-band images, the planet carves out a gap whose width and depth increases with planet mass (Figures 1 and 2). Poor filtering of drifting dust explains the presence of micron-sized particles within and along the gap outer edge traced by the SPHERE data (Figures 1 and 2). This is because the pressure maximum induced by a planet of only 1 MJup located at 20 au cannot efficiently filter out micron-sized particles (1-10 ) at the outer edge of the planet gap. Such pressure peaks can slow down, but cannot completely stop the inward motion of the micron-sized particles (Pinilla et al., 2016).
Note that these simulations focus on reproducing observational signatures of a gap/cavity opened by a single planet fixed at 20 au and do not address possible signposts of multiple planets carving multiple gaps. It is also worth mentioning that the number of forming planets in the disk does not determine the number of gaps and instead, might be determined by the disk’s viscosity (e.g Bae et al., 2018). We caution that in these simulations, viscosity and scale height (small and big grains) are taken to be constant. The choice of the viscous parameter, together with planet mass, determines the depth of the gap; specifically, decreasing the viscosity deepens the gap (Dong & Fung, 2017). We leave explorations of the dependence of the inferred putative V4046 Sgr circumbinary planet mass on disk viscosity and other disk properties (e.g., vertical dust settling, radial gradients in dust grain composition) to future work.
6.2 Binarity, Disk Dispersal, and Disk Structure
6.2.1 Disk Lifetime
We estimate that the ring imaged in mm continuum emission by ALMA comprises at least 60 M⊕ of dust ( 3.1.1). Given the total (gasdust) mass inferred for the circumbinary disk (0.094 ; Rosenfeld et al., 2013), the disk most likely also includes a significant mass in smaller and larger dust particles that are undetectable in those data. In terms of this large disk gas mass, as well as its large molecular (CO) disk radius (300 au; Kastner et al., 2018), the V4046 Sgr disk stands as unique among members of the 20 Myr-old Pic Moving Group (Riviere-Marichalar et al., 2014). Indeed, among the four actively accreting, roughly solar-mass (K-type) star systems within 100 pc of the Sun that host long-lived yet gas-rich (protoplanetary) disks — the other three being TW Hya, T Cha, and MP Mus — V4046 Sgr hosts the most massive disk, even though it is by far the oldest of these four systems (Sacco et al., 2014). The V4046 Sgr disk is also the only circumbinary disk among these four nearby, long-lived protoplanetary disk systems.
Given this context, it is intriguing that the age of the V4046 Sgr system is similar to the dust clearing time in a circumbinary disk predicted by Alexander (2012). The simulations of the effects of binarity on disk photoevaporation in that work showed that the tidal torque effects generated by a binary star system may increase the lifetime of a circumbinary disk by a factor of 3 for binary orbital separations significantly smaller than the critical radius for disk photoevaporation.
A longer-lived disk could be a natural consequence of such tidal torques, in the case of V4046 Sgr. Also, Kastner et al. (2011) have speculated that the lifetime of the V4046 Sgr circumbinary disk might have been extended by past interactions with an (M-type) tertiary component that is now found at a separation of 12.5 kau from the central close binary system.
While the mechanism responsible for the apparent extended circumbinary disk lifetime is still unclear, it seems plausible that the close binary nature of V4046 Sgr may have increased the time available for the formation of a planet, thereby ultimately determining its properties. Planet formation relies on the availability of time and material to establish the formation of the first pebbles and planetesimals, but for circumbinary disks, these initial stages might be postponed. This scenario could explain the possible presence of a forming planet in a 20 Myr old multiple system. Additional millimeter observations and detailed modeling are necessary to constrain disk dispersion and planet formation timescales in circumbinary disks, given that 40 of the identified population of disks that are in the process of dispersion (i.e., transitional disks) are found in close binary systems (Ruíz-Rodríguez et al., 2016).
6.2.2 Binary - Disk Alignment
Tidal interactions at the inner edge of a circumbinary disk should force alignment of the disk plane and binary orbital plane on timescales shorter than that of disk dispersal (Bate, 2000; Foucart & Lai, 2013), unless the central binary is eccentric and there exist large initial binary-disk misalignments (e.g. Zanazzi & Lai, 2018). In the case of the (low-eccentricity) V4046 Sgr binary, such coplanarity had been previously inferred on the basis of stringent constraints on the gas disk and binary inclinations obtained from CO kinematics and optical spectroscopic measurements, respectively (Rosenfeld et al., 2012). The inclination we have inferred for the 870 m continuum emission ring, 32.42∘0.07∘ (Sec. 3.1.1), now provides additional evidence of coplanarity among the dust disk, molecular gas disk, and central binary orbit. The timescale with which this alignment was reached is 23 Myr (the age of V4046 Sgr), i.e., well before the complete dispersion of the disk gas and, evidently, well before the initiation of the formation of the putative Jovian planet whose mass we have constrained here. The V4046 Sgr system hence stands as very strong evidence that the orbits of Jovian planets that have been spawned within circumbinary disks should be well aligned with the orbital planes of their host binary stars.
Finally, we note that, according to tidal truncation theory (Artymowicz & Lubow, 1994), a close binary star with a nearly circular orbit may create a tidally-induced inner cavity in the protoplanetary disk at 2.2a (where a is semi-major axis). However, for V4046 Sgr, this implies a clear inner region of only 0.1 au, two orders of magnitude smaller than the inner cavity radius inferred from NIR observations.
7 Summary
We have presented 0.3 (20 au) resolution 870 ALMA Band-7 observations of the circumbinary disk orbiting the V4046 Sgr close binary system. We re-analyze archival polarimetric SPHERE/IRDIS (Avenhaus et al., 2018) data, as a point of comparison with these new ALMA observations. The combination of our new millimeter continuum image and the scattered-light imaging reveals the complex structure of V4046 Sgr’s circumbinary dust disk.
The millimeter continuum image reveal a cavity and a bright outer ring with peak intensity at 32 au and extent of 90 au, while the scattered light image displays an inner cavity with a radius of 9 au, an inner ring at 14 au, and an outer ring whose peak position (25 au) corresponds to the inner edge of the bright millimeter continuum emission ring.
From a fit of the ALMA visibility data to a simple surface brightness model, we find an inclination of 32.42∘ 0.07 for the bright 870 continuum ring, demonstrating that the large-grain dust ring, larger-scale circumbinary gas disk, and central binary system are all in close alignment.
From our 870 continuum flux density measurement of 880 40 mJy, we infer a lower limit on dust mass of 60.0 M⊕ ( 0.2 MJup). With the new ALMA observations, we also tentatively detected an inner ring located within 20 au of the central binary (Figures 4 and 5).
We suggest that the complex radial distribution of dust in the V4046 Sgr circumbinary disk may be produced by an embedded planet. To this end, we compared the combined ALMA+SPHERE observations with synthetic images generated from generic planet-disk interaction models published in Dong et al. (2015). The comparison shows that a planet-disk interaction model involving a 0.3 MJup planet at 20 au can reproduce the depth of the gap, as well as the peak and location of the second ring in the scattered light data, but somewhat underestimates the radius of the ring in the ALMA data. On the other hand, a model invoking a 1.5 MJup planet at the same location reproduces the location of the ring in the ALMA data, but greatly overestimates the width and depth of the gap in the scattered light data. These results hence suggest that the mass of the putative circumbinary planet orbiting V4046 Sgr at 20 au should lie within the range 0.3–1.5 MJup (Figures. 1 and 2). We note however, that the models we have employed here were not specifically designed to reproduce the V4046 Sgr disk. Furthermore, these models do not account for the inner ring and cavity in scattered light, which may be produced by additional planets inside 15 au.
We encourage additional detailed modeling of the V4046 Sgr disk, to further test this hypothesis. Specifically, the mass of the putative circumbinary planet orbiting V4046 Sgr can be further constrained by exploring the dependence of the inferred planet mass on disk properties such as viscosity, vertical dust settling, and dust grain composition. Higher resolution ALMA continuum imaging is also required to confirm the presence of the inner 15 au radius ring that is marginally detected and resolved in the image presented in Figure 4 . If confirmed, this inner ring may indicate the presence of a second circumbinary planet in the system, interior to 15 au. Regardless, the analysis presented here illustrates the unique insights into the formation and early evolution of circumbinary planets that can be obtained via studies of disks orbiting V4046 Sgr and other young binary systems.
We are grateful to an anonymous referee for constructive suggestions that improved our paper. This paper makes use of data from ALMA program ADS/JAO.ALMA No. 2016.1.00315.S. ALMA is a partnership of ESO (representing its member states), NSF (USA) and NINS (Japan), together with NRC (Canada), NSC and ASIAA (Taiwan), and KASI (Republic of Korea), in cooperation with the Republic of Chile. The Joint ALMA Observatory is operated by ESO, AUI/NRAO and NAOJ. The National Radio Astronomy Observatory is a facility of the National Science Foundation operated under cooperative agreement by Associated Universities, Inc. D.A.R. and J.H.K acknowledge support from NASA Exoplanets Program grant NNX16AB43G to Rochester Institute of Technology.
References
- Alexander (2012) Alexander, R. 2012, ApJ, 757, L29, doi: 10.1088/2041-8205/757/2/L29
- Andrews et al. (2016) Andrews, S. M., Wilner, D. J., Zhu, Z., et al. 2016, ApJ, 820, L40, doi: 10.3847/2041-8205/820/2/L40
- Artymowicz & Lubow (1994) Artymowicz, P., & Lubow, S. H. 1994, ApJ, 421, 651, doi: 10.1086/173679
- Avenhaus et al. (2014) Avenhaus, H., Quanz, S. P., Schmid, H. M., et al. 2014, ApJ, 781, 87, doi: 10.1088/0004-637X/781/2/87
- Avenhaus et al. (2018) Avenhaus, H., Quanz, S. P., Garufi, A., et al. 2018, ApJ, 863, 44, doi: 10.3847/1538-4357/aab846
- Bae et al. (2018) Bae, J., Pinilla, P., & Birnstiel, T. 2018, ArXiv e-prints. https://arxiv.org/abs/1808.09472
- Baruteau et al. (2019) Baruteau, C., Barraza, M., Pérez, S., et al. 2019, arXiv e-prints. https://arxiv.org/abs/1903.06537
- Bate (2000) Bate, M. R. 2000, MNRAS, 314, 33, doi: 10.1046/j.1365-8711.2000.03333.x
- Beckwith et al. (1990) Beckwith, S. V. W., Sargent, A. I., Chini, R. S., & Guesten, R. 1990, AJ, 99, 924, doi: 10.1086/115385
- Benisty et al. (2015) Benisty, M., Juhasz, A., Boccaletti, A., et al. 2015, A&A, 578, L6, doi: 10.1051/0004-6361/201526011
- Bergner et al. (2018) Bergner, J. B., Guzmán, V. G., Öberg, K. I., Loomis, R. A., & Pegues, J. 2018, ApJ, 857, 69, doi: 10.3847/1538-4357/aab664
- Bohlin et al. (1978) Bohlin, R. C., Savage, B. D., & Drake, J. F. 1978, ApJ, 224, 132, doi: 10.1086/156357
- Boss (1997) Boss, A. P. 1997, Science, 276, 1836, doi: 10.1126/science.276.5320.1836
- Chiang & Goldreich (1997) Chiang, E. I., & Goldreich, P. 1997, ApJ, 490, 368, doi: 10.1086/304869
- Debes et al. (2013) Debes, J. H., Jang-Condell, H., Weinberger, A. J., Roberge, A., & Schneider, G. 2013, ApJ, 771, 45, doi: 10.1088/0004-637X/771/1/45
- Dong & Fung (2017) Dong, R., & Fung, J. 2017, ApJ, 835, 146, doi: 10.3847/1538-4357/835/2/146
- Dong et al. (2018) Dong, R., Li, S., Chiang, E., & Li, H. 2018, ApJ, 866, 110, doi: 10.3847/1538-4357/aadadd
- Dong et al. (2015) Dong, R., Zhu, Z., & Whitney, B. 2015, ApJ, 809, 93, doi: 10.1088/0004-637X/809/1/93
- Dong et al. (2012) Dong, R., Rafikov, R., Zhu, Z., et al. 2012, ApJ, 750, 161, doi: 10.1088/0004-637X/750/2/161
- Duquennoy & Mayor (1991) Duquennoy, A., & Mayor, M. 1991, A&A, 248, 485
- Foucart & Lai (2013) Foucart, F., & Lai, D. 2013, ApJ, 764, 106, doi: 10.1088/0004-637X/764/1/106
- Fung & Dong (2015) Fung, J., & Dong, R. 2015, ApJ, 815, L21, doi: 10.1088/2041-8205/815/2/L21
- Fung et al. (2014) Fung, J., Shi, J.-M., & Chiang, E. 2014, ApJ, 782, 88, doi: 10.1088/0004-637X/782/2/88
- Gaia Collaboration et al. (2018) Gaia Collaboration, Brown, A. G. A., Vallenari, A., et al. 2018, ArXiv e-prints. https://arxiv.org/abs/1804.09365
- Guzmán et al. (2017) Guzmán, V. V., Öberg, K. I., Huang, J., Loomis, R., & Qi, C. 2017, ApJ, 836, 30, doi: 10.3847/1538-4357/836/1/30
- Hendler et al. (2018) Hendler, N. P., Pinilla, P., Pascucci, I., et al. 2018, MNRAS, 475, L62, doi: 10.1093/mnrasl/slx184
- Henyey & Greenstein (1941) Henyey, L. G., & Greenstein, J. L. 1941, ApJ, 93, 70, doi: 10.1086/144246
- Hildebrand (1983) Hildebrand, R. H. 1983, QJRAS, 24, 267
- Huang et al. (2017) Huang, J., Oberg, K. I., Chunhua, Q., Yuri, A., & Andrews, S. 2017, ApJ, 835, 231, doi: 10.1051/0004-6361:20034502
- Kastner et al. (2011) Kastner, J. H., Sacco, G. G., Montez, R., et al. 2011, ApJ, 740, L17, doi: 10.1088/2041-8205/740/1/L17
- Kastner et al. (2018) Kastner, J. H., Qi, C., Dickson-Vandervelde, D. A., et al. 2018, ArXiv e-prints. https://arxiv.org/abs/1806.10553
- Kim & Martin (1994) Kim, S.-H., & Martin, P. G. 1994, ApJ, 431, 783, doi: 10.1086/174529
- Lucy (1999) Lucy, L. B. 1999, A&A, 344, 282
- Mamajek & Bell (2014) Mamajek, E. E., & Bell, C. P. M. 2014, MNRAS, 445, 2169, doi: 10.1093/mnras/stu1894
- Martí-Vidal et al. (2014) Martí-Vidal, I., Vlemmings, W. H. T., Muller, S., & Casey, S. 2014, A&A, 563, A136, doi: 10.1051/0004-6361/201322633
- Masset (2000) Masset, F. 2000, A&AS, 141, 165, doi: 10.1051/aas:2000116
- Pinilla et al. (2012) Pinilla, P., Birnstiel, T., Ricci, L., et al. 2012, A&A, 538, A114, doi: 10.1051/0004-6361/201118204
- Pinilla et al. (2016) Pinilla, P., Klarmann, L., Birnstiel, T., et al. 2016, A&A, 585, A35, doi: 10.1051/0004-6361/201527131
- Pollack et al. (1996) Pollack, J. B., Hubickyj, O., Bodenheimer, P., et al. 1996, Icarus, 124, 62, doi: 10.1006/icar.1996.0190
- Rapson et al. (2015a) Rapson, V. A., Kastner, J. H., Andrews, S. M., et al. 2015a, ApJ, 803, L10, doi: 10.1088/2041-8205/803/1/L10
- Rapson et al. (2015b) Rapson, V. A., Kastner, J. H., Millar-Blanchaer, M. A., & Dong, R. 2015b, ApJ, 815, L26, doi: 10.1088/2041-8205/815/2/L26
- Riviere-Marichalar et al. (2014) Riviere-Marichalar, P., Barrado, D., Montesinos, B., et al. 2014, A&A, 565, A68, doi: 10.1051/0004-6361/201322901
- Rodriguez et al. (2010) Rodriguez, D. R., Kastner, J. H., Wilner, D., & Qi, C. 2010, ApJ, 720, 1684, doi: 10.1088/0004-637X/720/2/1684
- Rosenfeld et al. (2013) Rosenfeld, K. A., Andrews, S. M., Wilner, D. J., Kastner, J. H., & McClure, M. K. 2013, ApJ, 775, 136, doi: 10.1088/0004-637X/775/2/136
- Rosenfeld et al. (2012) Rosenfeld, K. A., Andrews, S. M., Wilner, D. J., & Stempels, H. C. 2012, ApJ, 759, 119, doi: 10.1088/0004-637X/759/2/119
- Ruíz-Rodríguez et al. (2016) Ruíz-Rodríguez, D., Ireland, M., Cieza, L., & Kraus, A. 2016, MNRAS, 463, 3829, doi: 10.1093/mnras/stw2297
- Sacco et al. (2014) Sacco, G. G., Kastner, J. H., Forveille, T., et al. 2014, A&A, 561, A42, doi: 10.1051/0004-6361/201322273
- Schneider et al. (2009) Schneider, G., Weinberger, A. J., Becklin, E. E., Debes, J. H., & Smith, B. A. 2009, AJ, 137, 53, doi: 10.1088/0004-6256/137/1/53
- Stempels & Gahm (2004) Stempels, H. C., & Gahm, G. F. 2004, A&A, 421, 1159, doi: 10.1051/0004-6361:20034502
- Uyama et al. (2018) Uyama, T., Hashimoto, J., Muto, T., et al. 2018, ArXiv e-prints. https://arxiv.org/abs/1804.05934
- van Boekel et al. (2017) van Boekel, R., Henning, T., Menu, J., et al. 2017, ApJ, 837, 132, doi: 10.3847/1538-4357/aa5d68
- Whitney et al. (2013) Whitney, B. A., Robitaille, T. P., Bjorkman, J. E., et al. 2013, ApJS, 207, 30, doi: 10.1088/0067-0049/207/2/30
- Zanazzi & Lai (2018) Zanazzi, J. J., & Lai, D. 2018, MNRAS, 473, 603, doi: 10.1093/mnras/stx2375
- Zuckerman & Song (2004) Zuckerman, B., & Song, I. 2004, ARA&A, 42, 685, doi: 10.1146/annurev.astro.42.053102.134111