Compact Scene Graphs for Layout Composition and Patch Retrieval
Abstract
Structured representations such as scene graphs serve as an efficient and compact representation that can be used for downstream rendering or retrieval tasks. However, existing efforts to generate realistic images from scene graphs perform poorly on scene composition for cluttered or complex scenes. We propose two contributions to improve the scene composition. First, we enhance the scene graph representation with heuristic-based relations, which add minimal storage overhead. Second, we use extreme points representation to supervise the learning of the scene composition network. These methods achieve significantly higher performance over existing work (69.0% vs 51.2% in relation score metric). We additionally demonstrate how scene graphs can be used to retrieve pose-constrained image patches that are semantically similar to the source query. Improving structured scene graph representations for rendering or retrieval is an important step towards realistic image generation.
1 Introduction
When we just need to communicate the semantic ’gist’ of an image, and not necessarily the pixels, structured representations such as scene graphs are a compact alternative. Applications include image synthesis or scene composition from scene graphs [8] and graph-based image patch retrieval.
For image synthesis, previous work has used representations such as class labels[15], captions [20], or latent dimensions [10]. However, these methods still struggle to generate realistic images across a broad vocabulary or for complex scene compositions. Natural language representations such as captions require overcoming their inherently linear ordering to infer relationships. Scene graphs help alleviate this limitation of captions by providing a structured description of complex scenes. They can compactly model attributes, spatial relationships and hierarchy of various objects in a scene. However, using scene graphs for image generation has its own challenges as evidenced by Johnson et al. [8]. While their approach yielded significantly improved images, it notably struggled with cluttered scenes or small objects.
Models such as Johnson et al. have two stages. The first stage uses the scene graph to generate a realistic scene layout, encoded as segmentation mask. The second stage uses the segmentation mask to synthesize realistic images. The second stage is well covered by existing work on image synthesis [5, 19, 18, 7, 6]. The key point of failure in existing methods is the first stage – generating realistic scene compositions.
To improve the ability to use compact scene graph representation for these tasks, in this paper we propose several improvements. We first improve the scene graph representation with heuristic-based relations. We employ a graph convolutional neural network to generate a scene layout that is compliant to the provided scene graph. Instead of regressing bounding boxes for each object in the scene, we regress the extreme points, which provide a tighter spatial bound compared to bounding boxes. By leveraging sparse shape information, these lightweight features allow us to efficiently retrieve the best matching candidate patches from an image database such as [4].
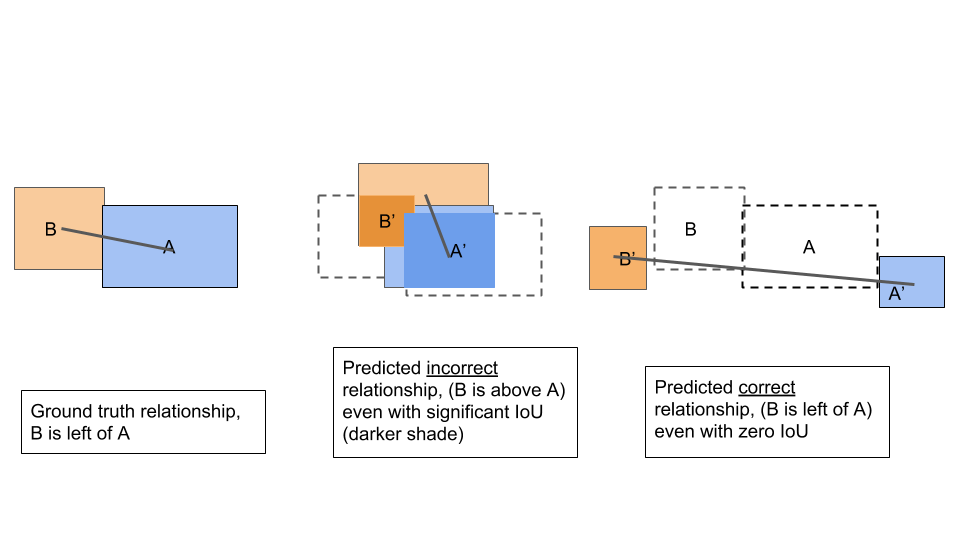
Further, since this is a relatively new task, we leverage an evaluation metric suited to evaluate our scene composition method: the relation score [22] which measures the compliance of the generated layout to the scene graph as shown in Figure 1. Using the COCO-stuff [4] dataset, we evaluate our proposed model on composing scene layouts and on patch retrieval. Our experiments show that our proposed method establishes a new state of the art in scene layout generation from scene graphs, outperforming Johnson et al. [8] qualitatively and quantitatively in layout prediction. Further, we are able to show the effectiveness of using extreme points to retrieve object patches which respect the scene graph. These improvements allow models to better leverage compact structured representations such as scene graphs. We leave the generation of images based on the predicted layout and retrieved patches for future work.
2 Related Work
Scene graphs provide a compact and structured description of complex scenes [1] and the semantic relationship between objects. Ways to leverage this representation have generally fallen into three categories: generating graphs from images, generating images from graphs, and using graphs for image retrieval. Generating scene graphs from images is relatively well studied task, with approaches ranging from augmenting RNNs [23] to re-purposing keypoint models [17] to embedding-based approachs [16].
Scene graphs have also been explored for image retrieval tasks [2, 9]. These methods aim to search for an entire image corresponding to the input scene graph and can not be used for retrieving patches to synthesize new composites. Image based patch retrieval methods have also been studied in [13] and [21]. Of note here is the work of Zhao et al. [24] who use a background image, class label and bounding box to query a database and retrieve the best matching patch to blend with the background image. While this method shows promising results, it needs the help of multiple input sources to find an appropriate match. Further, it is unclear if the method would scale efficiently when several objects are to be retrieved simultaneously.
Image generation from scene graphs is relatively new. Johnson et al. [8] extract objects and features from a scene graph with a graph convolutional neural network. A network then applies these features to predict a scene layout of objects, which are then used by a cascaded refinement network [5] to generate realistic images. While this is a novel end-to-end approach, it suffers from two major limitations. First, it performs poorly when the scene is very cluttered or has small objects. Second, the generating scene layouts are often non-sensical due to the sparsity in the scene graph representation.
Our approach improves on previous methods by applying heuristic data augmentation to add missing relations to the scene graph representation, and by using extreme point regression to improve the layout generation. Learning the extreme points allows us to generate tighter spatial bound for each object as compared to the bounding box [8]. While previous approaches have focused on using scene graphs to retreive images, here we focus on retrieving individual patches that are still compliant with the rest of the scene graph. In combination, this provides a solid foundation for compositing and blending methods to generate a high resolution realistic image from the retrieved patches.
3 Method
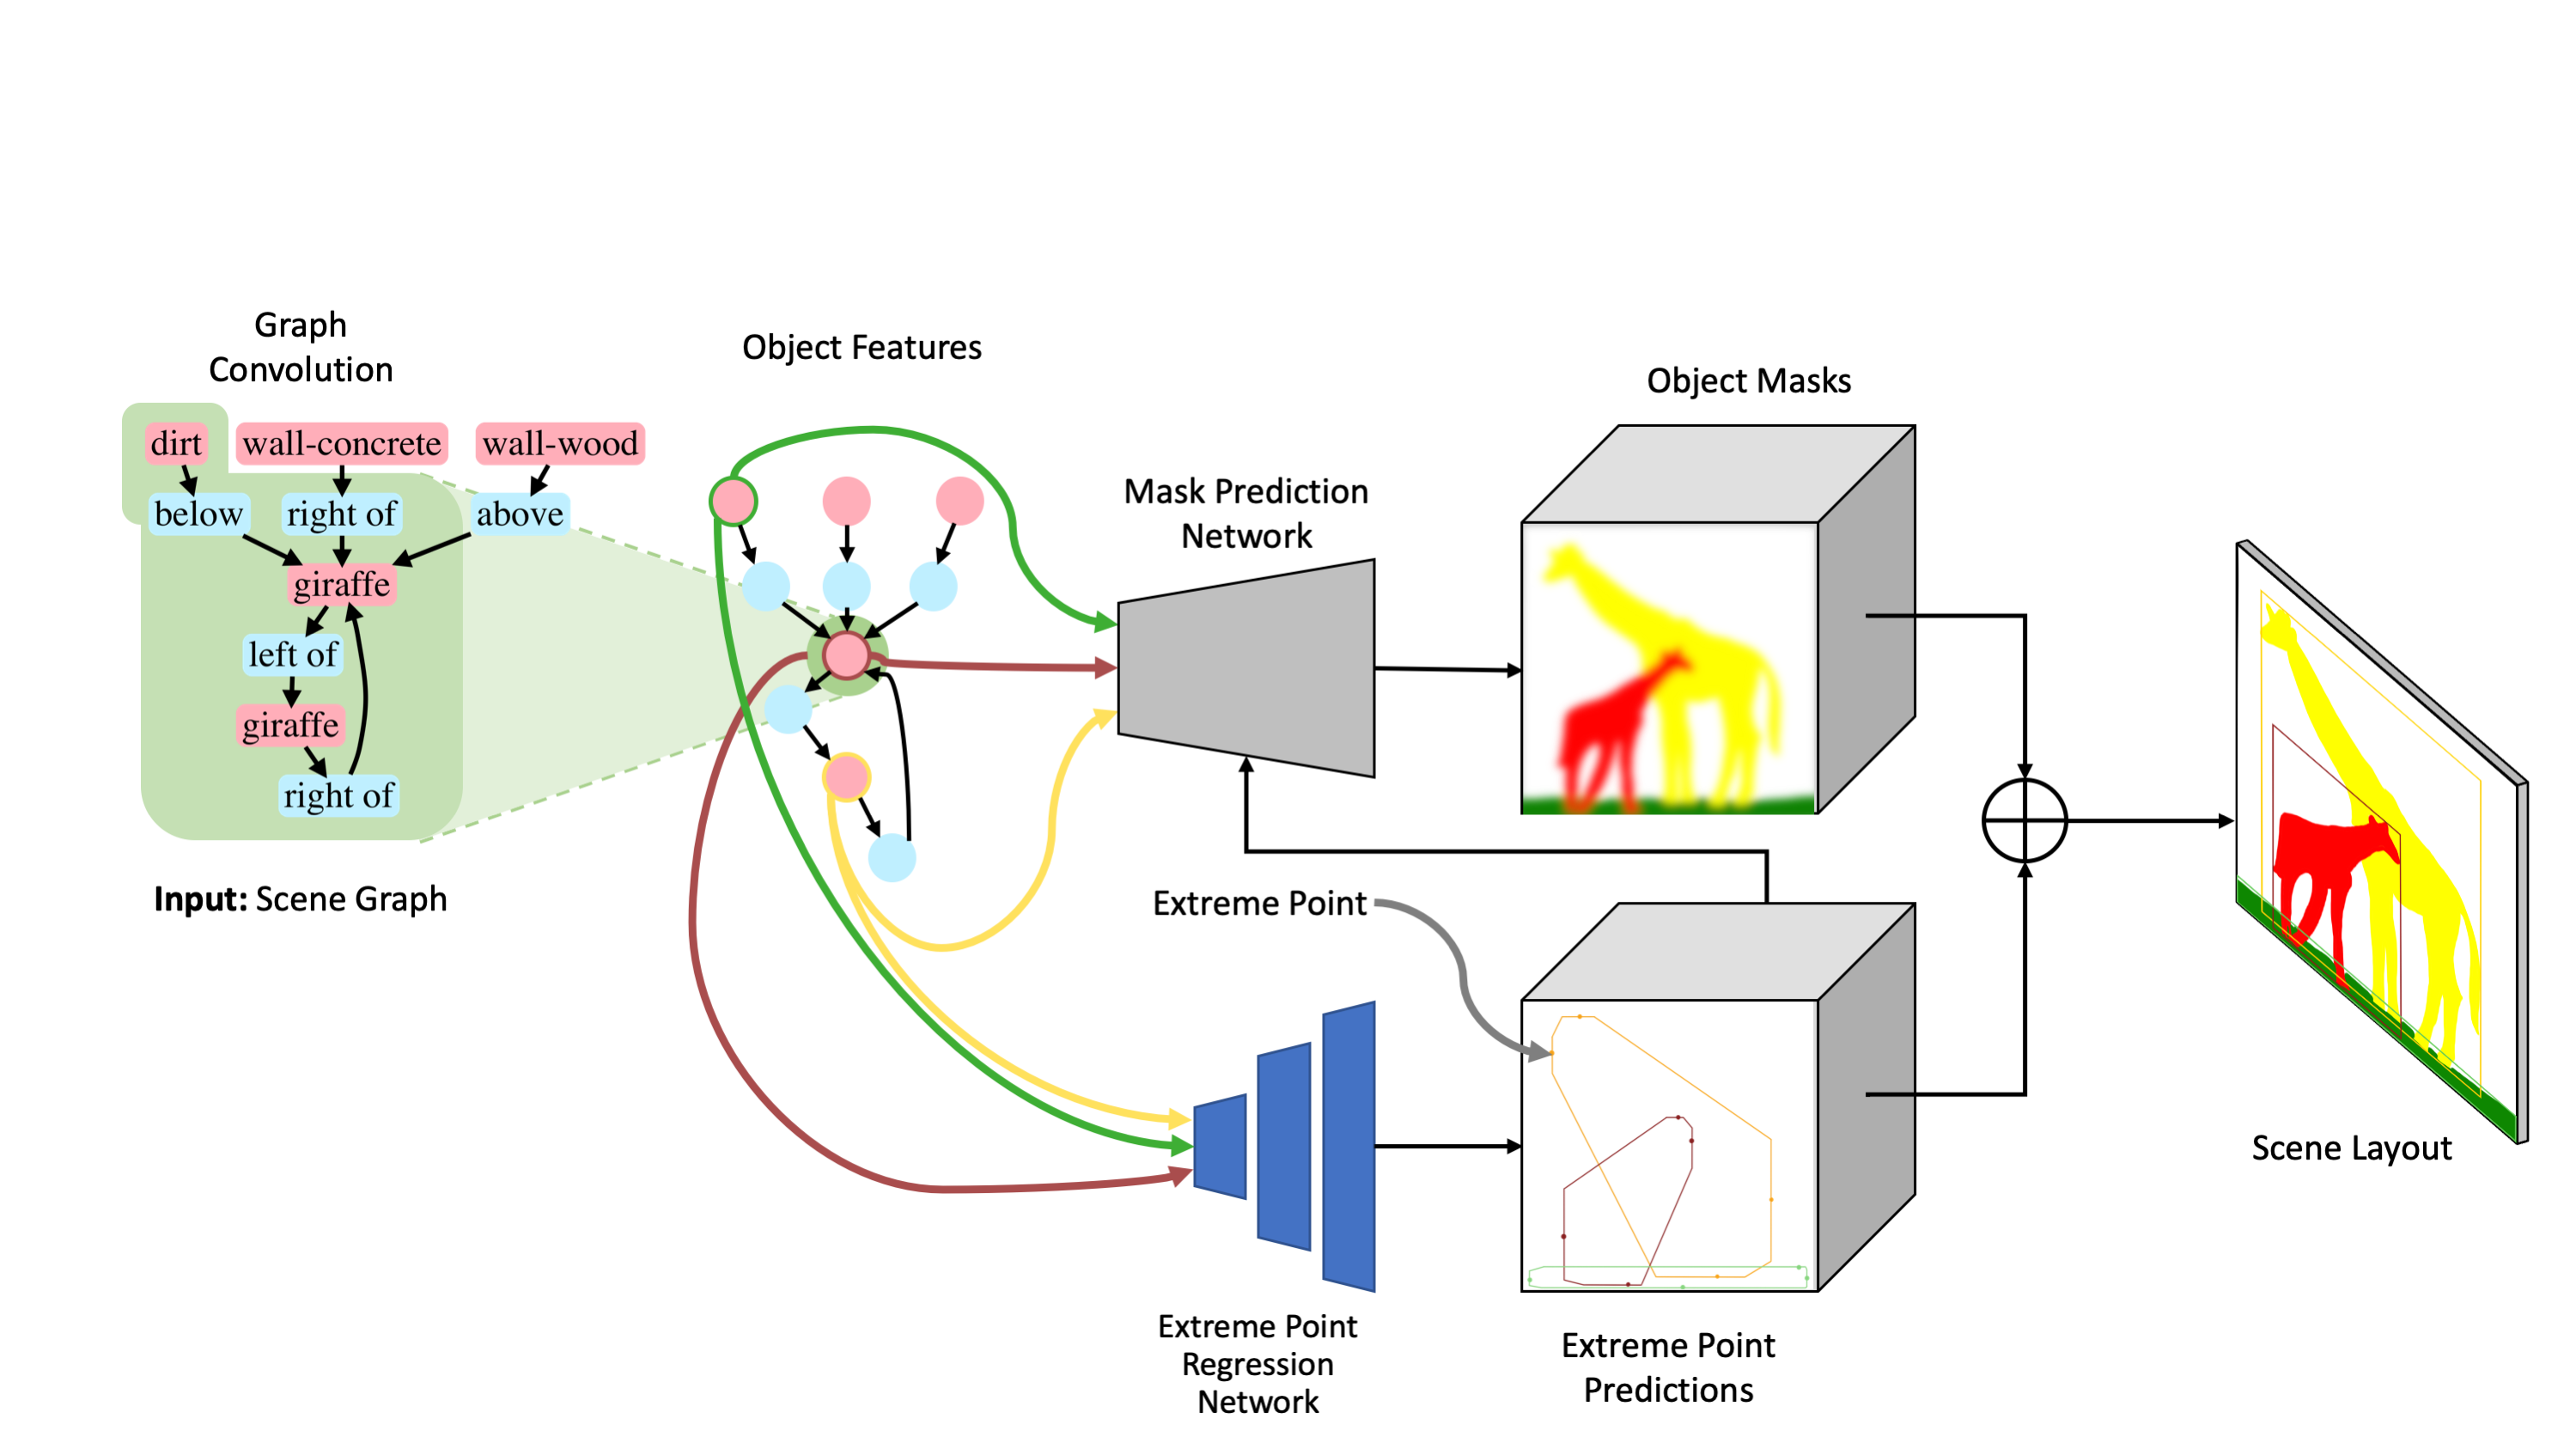
The overall pipeline of the layout generation framework is illustrated in figure 2. Given a scene graph consisting of objects and their relationships, our model constructs a realistic layout corresponding to the scene graph. Our framework is inspired by [8]. Briefly, the scene graph is converted into -dimensional object embedding vectors () from a Graph Convolution Neural Network (GCNN), which are then passed to a mask prediction network as well as an extreme point regression network. The extreme points generated thus are used to condition the mask prediction. For each object , we first achieve bounding box from its predicted extreme points. We then expand the object embedding vectors to shape , and warp it to the position of the bounding box using bilinear interpolation to give an object layout , where and are the output spatial layout dimensions. We sum all object layouts to obtain the scene layout . Finally, using the computed extreme points for each object, we retrieve individual patches which best respects the segmentation mask for that object. Each of these steps are described below in more detail.
Heuristic-based Data Augmentation
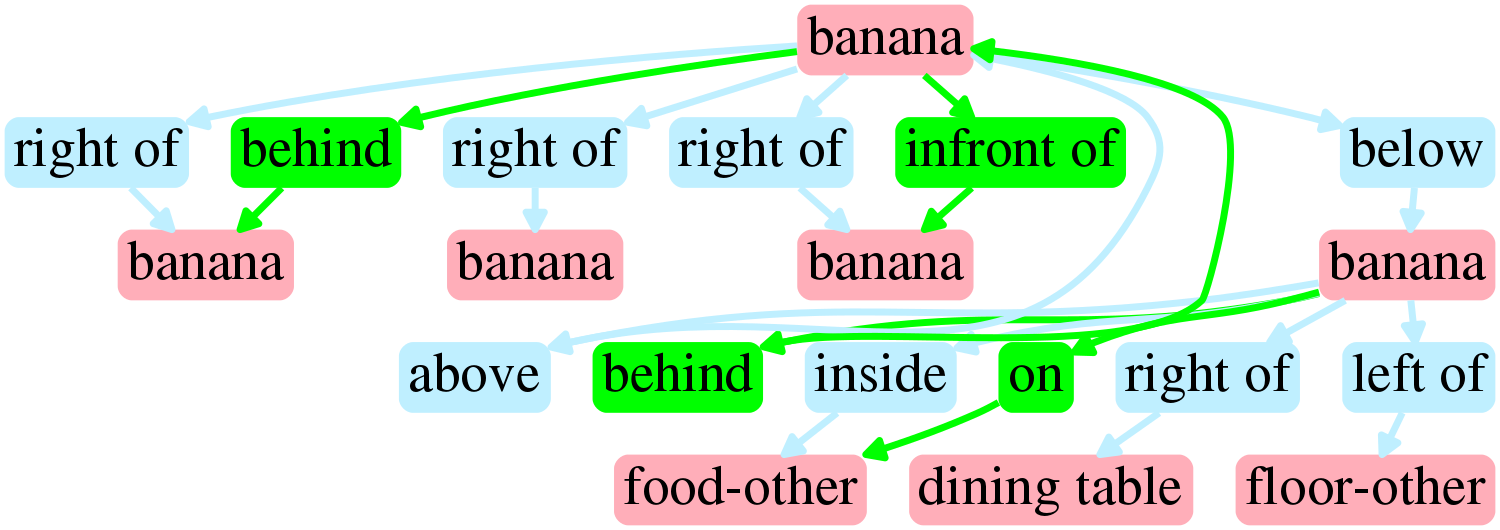
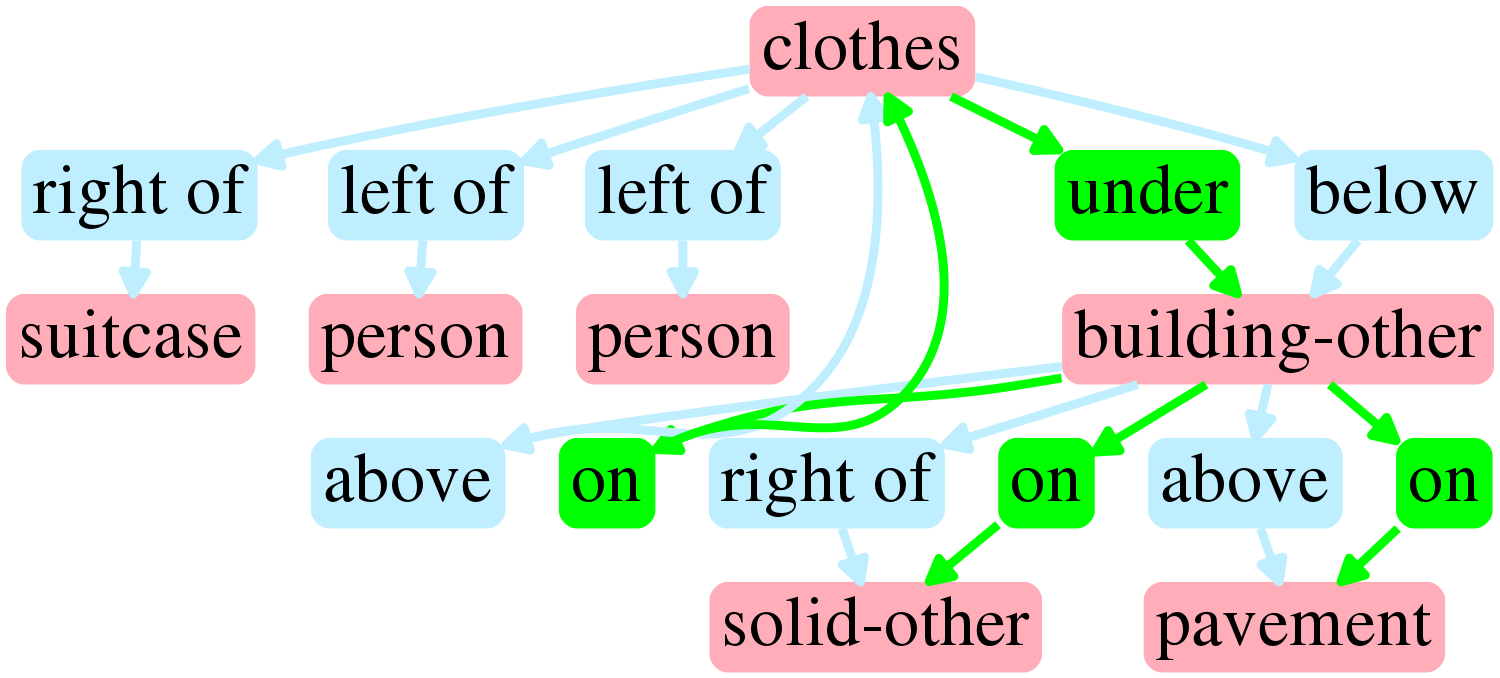
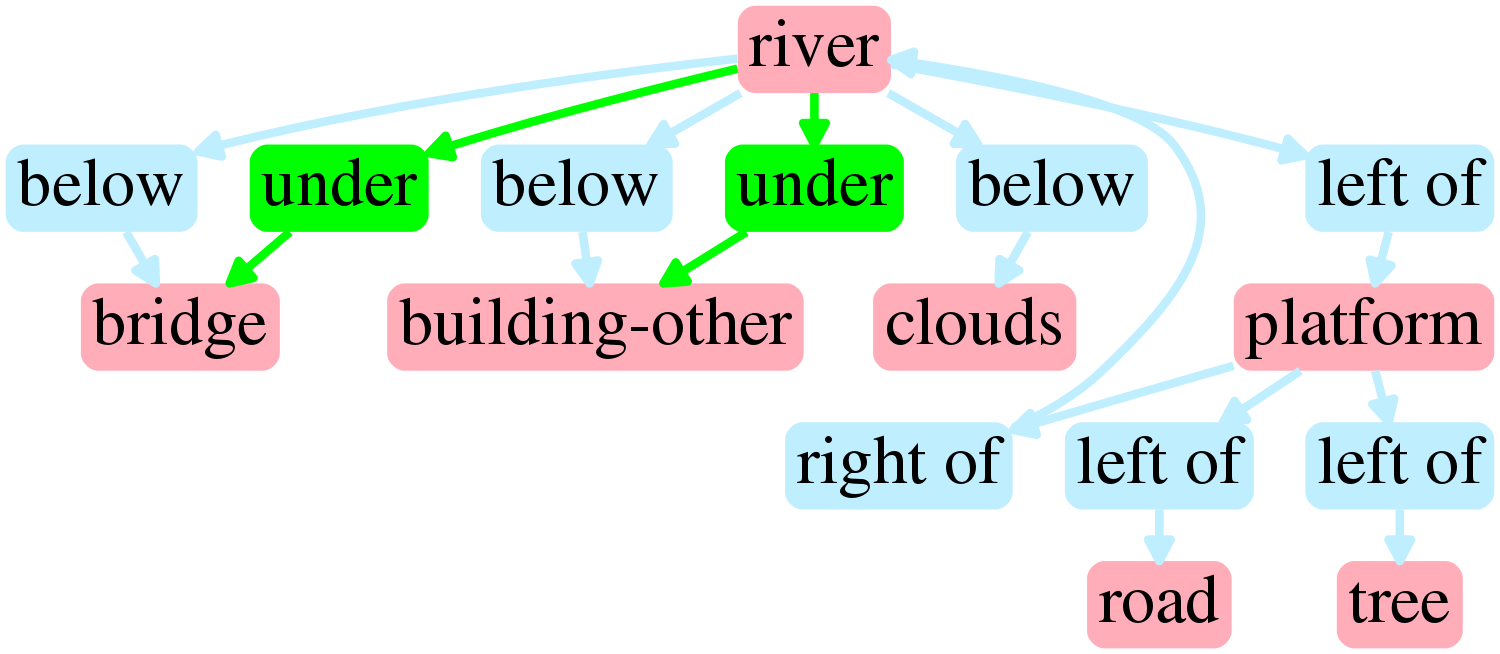
The scene graph representation, while compact, is often incomplete, leading to poor scene composition layouts. We used heuristics to augment the scene graph representation with new spatial relations that induce a richer learned representation as shown in Figure 3. We quasi-exhaustively determined the depth order between objects from observers’ viewpoint. For 2D images, determining this order is non-trivial. We utilize linear perspective based heuristics instead for augmenting spatial relationship vocabulary. We provide the details in the experiments section.

Extreme point supervision for representation learning
Extreme points proposed by Zhou et al. [25] have shown to be successful in a bottom-up object detection framework. They provide a compact way of representing the shape of an object. Per [25], given the bounding box of an object, an extreme point is a point such that no other point on the object lies further along one of the four cardinal directions: top, bottom, left, right (For example, , , , would be the four extreme points for the bounding box defined above). Extreme point prediction from scene graphs however, is more challenging since there are no visual features to leverage. We use an extreme point regression network which predicts extreme points with the aim of creating a layout that obeys the relationships described by the scene graph. Further, these points enable the construction of an octagon around each object in the layout which can then be used as a sparse shape representation for the object. Using this representation, and the object class, we can retrieve a set of matching patches which would best fit the segmentation mask for each object.
Network architecture
Specifically, our network consists of three components, a graph convolutional network, a mask prediction network and an extreme point regression network.
-
•
Graph Convolutional Network: In order to produce a scene layout, the input scene graph must first be transformed from the graph domain into a format which can be used by the mask prediction and extreme point regression networks. A graph convolutional network facilitates this transformation by processing the input scene graph and generating an embedding vector as its output. Like [8], our graph convolutional network has 5 layers with an input dimension of 128, and an output dimension of 128 with a hidden dimension of 512.
-
•
Extreme Point Regression Network: A key part of predicting a well defined layout is the ability to produce tight bounds on each object in the scene. For this, we use an extreme point regression network which consists of two fully connected layers with ReLU activation after the first layer. The network takes as input the final embedding vector produced for each object and instead of regressing 4 points corresponding to the bounding box of the object, regresses 10 points corresponding to the 4 extreme points of the object and the center of the object. These points are then used to condition the mask prediction.
-
•
Mask Prediction Network: For each object, the mask prediction network predicts a segmentation mask. It takes as input the final embedding vector for each object along with the extreme points which have been regressed for that object concatenated as a vector. The mask prediction network consists of a sequence of four sub-blocks, where each sub-block has a nearest neighbour upsampling step followed by batch normalization and a convolution layer with ReLU activation. Similar to [8], the network ends with a convolution layer and sigmoid activation. The output is a mask with each value of the mask in the range of .
Training
The layout generation network is trained to minimize the weighted sum of two losses:
-
•
Extreme point loss, penalizes the difference between the ground truth and predicted extreme point co-ordinates as where is a predicted extreme point and is the corresponding ground truth extreme point.
-
•
Mask loss, , penalizes differences between the ground truth and predicted masks with pixel-wise cross entropy.
The total loss is then computed as a weighted sum of the two losses above
(1) Here, and are weights applied to each loss term.
In our experiments, we found that using the Adam optimizer [12] with a learning rate of and of for a batch size of gave us optimal results. Further, we set to and to .
Shape-aware retrieval
In our patch retrieval task, the algorithm is tasked to return patches similar to the ground truth objects in the query scene graphs. Importantly, the retrieval algorithm only has access to the query scene graph, and not the associated ground truth image. With only the compact representation of the scene graph, it must use the scene graph context for the query. Our algorithm first predicts the extreme points of the object, then uses a metric on the extreme point octagon to retrieve similar patches in the training set. We measured performance as Intersection-over-Union (IoU) between the ground truth patch object mask and the retrieved patch object mask.
We benchmarked several retrieval algorithms: (1) bounding-box based retrieval, (2) our extreme points based retrieval, and (3) random retrieval.
4 Experiments
We train our model on the COCO-Stuff[4] dataset to generate scene layouts . In our experiments, we aim to show that the generated layouts look realistic and that they respect the objects and relationships of the input scene graph. We further show that our predicted extreme points can be used for shape aware object patch retrieval across common object categories. The following subsections elaborate on our dataset, as well as qualitative and quantitative results.
| Model | Relation Score | Avg IOU |
| Johnson et al. [8] | 51.2% | 45.9% |
| Johnson et al. [8]+ DA | 59.8% | 51.0% |
| EP + (Ours) | 69.0% | 51.6% |
4.1 Datasets
COCO: We performed experiments on the 2017 COCO-Stuff dataset [4], which augments a subset of the COCO dataset [14] with additional stuff categories. The dataset annotates train and val images with bounding boxes and segmentation masks for thing categories (people, cars, etc.) and stuff categories (sky, grass, etc.). Similar to [8], we used thing and stuff annotations to construct synthetic scene graphs based on the 2D image coordinates of the objects, encoding six mutually exclusive geometric relationships: ‘left’ ‘of’, ‘right of’, ‘above’, ‘below’, ‘inside’, and ‘surrounding’. We ignored objects covering less than 2% of the image, and used images with to objects.
In the augmentation process, we exploit the ‘thing’ (‘object‘) and ‘stuff’ annotations. We encode two heuristics based relationships: ‘behind’ and ‘in front of’ between two spatially overlapping ‘things’. Among overlapping ‘things’ A and B, A is ‘in front of’ B if the bottom boundary of A’s bounding box is closer to the image’s bottom edge. Additionally, ‘on’ and ‘under’ relationships between overlapping ‘thing’ and ‘stuff’ are imposed. A ‘thing’ is always ‘on’ the ‘stuff’ from viewer’s perspective. Figure 3 shows examples of between instances and between instance-stuff relationship augmentation.
4.2 Scene Layout Prediction Results
For COCO, we compare the predicted layout with the ground truth using both Intersection-over-Union (IoU) and Relation Score (Figure 1). It is to be noted that relation score is more suited metric than IOU for this task. By applying extreme point based supervision, data augmentation and location conditioned mask prediction, we significantly improve the performance of the model (Table 1) for both metrics. The extreme points annotations are extracted from the segmentation masks from objects classes. For stuff classes, we created trivial extreme points from the bounding box annotations.


| Retrieval Method | Top-1 IOU | Top-5 IOU |
| EP + | 54% | 64% |
| BB + | 44% | 57% |
| Random | 42% | 55% |
Figure 4 shows visual results. Ground truth images with octagonal masks around the extreme points show the tighter bound on objects comparing with that of bounding box. We show the scene layout from our model and Johnson et al. model respectively. Our model places objects better especially if there are missing directed edges between objects in the input scene graph.
4.3 Retrieval Database Description
We create a database of object patches extracted from the COCO training dataset for a pre-defined set of classes using the bounding box co-ordinates. For each of the object patches, we also include a set of normalized extreme points [25] which will be used for matching and patch retrieval. The number of patches for each object varies between 1051 and 15292 images. The list of selected categories and the number of object patches in each category are presented in Table 3.
| bear | bed | bench | bicycle | bird | boat | bottle | bus | car | cat | chair | cow | dining table | dog | elephant | fire hydrant | giraffe | horse | motorcycle | stop sign | surfboard | train | zebra |
| 1152 | 4048 | 4382 | 3012 | 2966 | 3614 | 3831 | 4278 | 8600 | 4366 | 15292 | 3540 | 12201 | 4230 | 3947 | 1180 | 4454 | 4197 | 5057 | 1051 | 2676 | 4126 | 3909 |
4.4 Experimental Results of Patch Retrieval
For every predicted object in the validation set, we use the extreme point based retrieval method to extract the top 5 matches from the retrieval database. A few examples of such retrievals across different categories are shown in Figure 5. Qualitatively, note that the shape and pose of the retrieved patches closely match the predicted octagons. Additionally, we measured the IoU between the ground truth object mask and the retrieved patch mask (Table 2), which demonstrates that our extreme point-based retrieval is more accurate than other approaches. The Top-1 score is the IoU computed using the best retrieval while the Top-5 score is the highest IoU among the 5 retrievals. The scores are averaged across the 23 categories for all the objects in the validation set.


5 Conclusion
While scene graphs are compact representations of images, methods that can accurately use this representation for tasks such as image rendering or patch retrieval are not well developed. We’ve introduced several new contributions, including heuristic-based data augmentation, and extreme-point supervision, that demonstrate improved performance in utilizing scene graphs for generating realistic scene layouts. We additionally use the extreme point prediction module as a way to perform patch retrieval with only the scene graph as input. As graph-based tasks increase in number and diversity [1], we expect our contributions to generalize to other graph-conditioned algorithms. Summarily, we hope to build upon our current results by leveraging recent progress in generating high-resolution photo-realistic images [11, 3].
References
- [1] P. W. Battaglia, J. B. Hamrick, V. Bapst, A. Sanchez-Gonzalez, V. Zambaldi, M. Malinowski, A. Tacchetti, D. Raposo, A. Santoro, R. Faulkner, C. Gulcehre, F. Song, A. Ballard, J. Gilmer, G. Dahl, A. Vaswani, K. Allen, C. Nash, V. Langston, C. Dyer, N. Heess, D. Wierstra, P. Kohli, M. Botvinick, O. Vinyals, Y. Li, and R. Pascanu. Relational inductive biases, deep learning, and graph networks, 2018.
- [2] E. Belilovsky, M. Blaschko, J. R. Kiros, R. Urtasun, and R. Zemel. Joint embeddings of scene graphs and images. ICLR w/s, 2017.
- [3] A. Brock, J. Donahue, and K. Simonyan. Large scale gan training for high fidelity natural image synthesis, 2018.
- [4] H. Caesar, J. Uijlings, and V. Ferrari. Coco-stuff: Thing and stuff classes in context. In CVPR, 2018.
- [5] Q. Chen and V. Koltun. Photographic image synthesis with cascaded refinement networks. 2017.
- [6] C. Gan, B. Gong, K. Liu, H. Su, and L. J. Guibas. Geometry guided convolutional neural networks for self-supervised video representation learning. In The IEEE Conference on Computer Vision and Pattern Recognition (CVPR), June 2018.
- [7] S. Hong, D. Yang, J. Choi, and H. Lee. Inferring semantic layout for hierarchical text-to-image synthesis. In Computer Vision and Pattern Recognition (CVPR), 2018.
- [8] J. Johnson, A. Gupta, and L. Fei-Fei. Image generation from scene graphs. CoRR, abs/1804.01622, 2018.
- [9] J. Johnson, R. Krishna, M. Stark, L. Li, D. A. Shamma, M. S. Bernstein, and L. Fei-Fei. Image retrieval using scene graphs. In 2015 IEEE Conference on Computer Vision and Pattern Recognition (CVPR), volume 00, pages 3668–3678, June 2015.
- [10] T. Karras, T. Aila, S. Laine, and J. Lehtinen. Progressive growing of gans for improved quality, stability, and variation. In ICLR, 2018.
- [11] T. Karras, T. Aila, S. Laine, and J. Lehtinen. Progressive growing of gans for improved quality, stability, and variation. In ICLR, 2018.
- [12] D. P. Kingma and J. Ba. Adam: A method for stochastic optimization. CoRR, abs/1412.6980, 2014.
- [13] J.-F. Lalonde, D. Hoiem, A. A. Efros, C. Rother, J. Winn, and A. Criminisi. Photo clip art. ACM Transactions on Graphics (SIGGRAPH 2007), 26(3):3, August 2007.
- [14] T.-Y. Lin, M. Maire, S. Belongie, J. Hays, P. Perona, D. Ramanan, P. Dollár, and C. L. Zitnick. Microsoft coco: Common objects in context. In European Conference on Computer Vision (ECCV), Zürich, 2014. Oral.
- [15] M. Mirza and S. Osindero. Conditional generative adversarial nets. CoRR, abs/1411.1784, 2014.
- [16] A. Newell and J. Deng. Pixels to graphs by associative embedding. In I. Guyon, U. V. Luxburg, S. Bengio, H. Wallach, R. Fergus, S. Vishwanathan, and R. Garnett, editors, Advances in Neural Information Processing Systems 30, pages 2171–2180. Curran Associates, Inc., 2017.
- [17] A. Newell, K. Yang, and J. Deng. Stacked hourglass networks for human pose estimation. In Computer Vision - ECCV 2016 - 14th European Conference, Amsterdam, The Netherlands, October 11-14, 2016, Proceedings, Part VIII, pages 483–499, 2016.
- [18] T. Park, M.-Y. Liu, T.-C. Wang, and J.-Y. Zhu. Semantic image synthesis with spatially-adaptive normalization. In Proceedings of the IEEE Conference on Computer Vision and Pattern Recognition, 2019.
- [19] X. Qi, Q. Chen, J. Jia, and V. Koltun. Semi-parametric image synthesis. In CVPR, pages 8808–8816. IEEE Computer Society, 2018.
- [20] S. Reed, Z. Akata, X. Yan, L. Logeswaran, B. Schiele, and H. Lee. Generative adversarial text to image synthesis. In M. F. Balcan and K. Q. Weinberger, editors, Proceedings of The 33rd International Conference on Machine Learning, volume 48 of Proceedings of Machine Learning Research, pages 1060–1069, New York, New York, USA, 20–22 Jun 2016. PMLR.
- [21] F. Tan, C. Bernier, B. Cohen, V. Ordonez, and C. Barnes. Where and who? automatic semantic-aware person composition. CoRR, abs/1706.01021, 2017.
- [22] S. Tripathi, A. Bhiwandiwalla, A. Bastidas, and H. Tang. Using scene graph context to improve image generation. CoRR, abs/1901.03762, 2019.
- [23] D. Xu, Y. Zhu, C. Choy, and L. Fei-Fei. Scene graph generation by iterative message passing. In Computer Vision and Pattern Recognition (CVPR), 2017.
- [24] H. Zhao, X. Shen, Z. Lin, K. Sunkavalli, B. Price, and J. Jia. Compositing-aware image search. In The European Conference on Computer Vision (ECCV), September 2018.
- [25] X. Zhou, J. Zhuo, and P. Krähenbühl. Bottom-up object detection by grouping extreme and center points. CoRR, abs/1901.08043, 2019.