Signatures of adatom effects in the quasiparticle spectrum of Li-doped graphene
Abstract
We study the spectral function and quasiparticle scattering in Li-decorated graphene (Li@graphene) with an atomistic -matrix formalism and uncover adatom-induced spectral effects which shed light on experimentally observed angle-resolved photoemission spectroscopy (ARPES) features. From transport studies, alkali adatoms are known to introduce charged-impurity scattering limiting the carrier mobility. Here, we demonstrate that Li adatoms furthermore give rise to a low-energy impurity band centered at the point which originates from the hybridization between the atomic 2s state of the Li adatoms and graphene ”surface” states. We show that the impurity band is strongly dependent on the concentration of Li adatoms, and aligns with the Li-induced Fermi level on the Dirac cone at % ( eV). Finally, we show that adatom-induced quasiparticle scattering increases dramatically at energies above close to the van Hove singularity in the graphene density of states (DOS), giving rise to a large linewidth broadening on the Dirac cone with a concomitant downshift and a characteristic kink in the conduction band. Our findings are highly relevant for future studies of ARPES, transport, and superconductivity in adatom-doped graphene.
Introduction.—Graphene decorated with metallic adatoms has emerged as an interesting platform for engineering graphene’s electronic properties and realizing novel electronic phases such as, e.g., the quantum spin Hall phase Weeks et al. (2011); Cresti et al. (2014); Santos et al. (2018) and superconductivity Uchoa and Castro Neto (2007); Profeta et al. (2012); Margine and Giustino (2014). In addition, doping with adatoms opens the opportunity to probe the electronic properties of graphene at high energies with, e.g., Fermi levels in excess of 1 eV in alkali-doped graphene Bianchi et al. (2010); McChesney et al. (2010); Siegel et al. (2011); Fedorov et al. (2014); Ludbrook et al. (2015); Khademi et al. (2016). However, metallic adatoms at the same time introduce charged-impurity scattering, thus limiting the transport in adatom-doped graphene Chen et al. (2008); Yan and Fuhrer (2011); Khademi et al. (2016); Chandni et al. (2015); Khademi et al. (2019).
The spectral properties of adatom-doped graphene have been studied with angle-resolved photoemission spectroscopy (ARPES) Damascelli et al. (2003) in several works Bostwick et al. (2007); Bianchi et al. (2010); McChesney et al. (2010); Siegel et al. (2011, 2013); Fedorov et al. (2014); Straßer et al. (2015); Ludbrook et al. (2015), demonstrating many-body effects such as, e.g., electron-electron and electron-phonon (el-ph) interactions Calandra and Mauri (2007a); Park et al. (2007); Tse and Das Sarma (2007); Hwang and Das Sarma (2008); Polini et al. (2008); Park et al. (2009), while the effect of adatom-induced impurity scattering Chen et al. (2008); Yan and Fuhrer (2011); Khademi et al. (2016); Chandni et al. (2015) in ARPES is not well understood Straßer et al. (2015). In addition, signatures of superconductivity have been observed in ARPES on Li-decorated graphene (Li@graphene) at Li concentrations corresponding to a Fermi level of eV Ludbrook et al. (2015). They appeared alongside a spectral feature at the point which in the ordered LiC6 structure Profeta et al. (2012) and alkali metal-graphite intercalation compounds Csányi et al. (2005); Calandra and Mauri (2005); Chapman et al. (2016) corresponds to a metal-atom dominated band predicted to promote superconductivity Profeta et al. (2012).
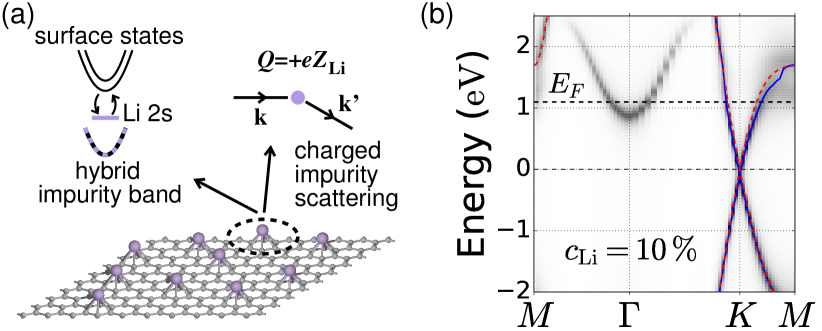
In this work, we study the spectral properties of disordered Li@graphene, i.e., graphene with a random configuration of Li adatoms as illustrated in Fig. 1(a), using an atomistic first-principles -matrix formalism based on a parameter-free description of the impurity potential Kaasbjerg et al. (2017); Kaasbjerg (2019). This allows for a detailed description of (i) the spectral -point feature including its hitherto unexplored concentration dependence as well as (ii) the renormalization and linewidth broadening of the bands due to adatom-induced quasiparticle (QP) scattering.
We find that in disordered Li@graphene, the -point feature corresponds to the hybrid impurity band shown in Fig. 1(b), which originates from the coupling between free-electron like ”surface” states localized in proximity to the graphene layer and the atomic Li 2s state as sketched in Fig. 1(a). The impurity band evolves downwards in energy from the position of the Li 2s state with increasing and aligns with the Fermi level on the Dirac cone at ( eV). In agreement with experiments Ludbrook et al. (2015), this suggests that conditions favorable for superconductivity may be realized in disordered Li@graphene at concentrations well below the concentration () in LiC6 Profeta et al. (2012).
We furthermore analyze the effect of adatom scattering on the Dirac cone states, and find that charged-impurity scattering dominates the linewidth broadening, while resonant scattering Basko (2008); Robinson et al. (2008); Wehling et al. (2010); Irmer et al. (2018) by the atomic Li 2s state is negligible. Near the point, the linewidth broadening in Fig. 1(b) increases dramatically due to strong charged-impurity scattering with a concomitant downshift and a kink in the QP band [Fig. 1(b) blue line]. Similar features have been observed at high Fermi energies in different types of metal atom-doped graphene McChesney et al. (2010); Bianchi et al. (2010); Fedorov et al. (2014); Link et al. (2019), and may yield an artificially high and anisotropic el-ph coupling if attributed entirely to el-ph scattering as pointed out in Refs. Park et al., 2008; Calandra and Mauri, 2007b. As we demonstrate, adatom-induced impurity scattering presents a nonnegligible ”intrinsic” contribution to the band renormalization in adatom-doped graphene.
Theory and methods.—For a random distribution of Li adatoms as illustrated in Fig. 1(a), the spectral properties probed in ARPES are given by the impurity-averaged Green’s function (GF). Here, we apply the atomistic density-functional theory (DFT)-based -matrix formalism described in Refs. Kaasbjerg et al., 2017; Kaasbjerg, 2019 to calculate the GF for disorderd Li@graphene.
The impurity-averaged Green’s function is given by the Dyson equation Mahan (2010); Bruus and Flensberg (2004)
| (1) |
where st Brillouin zone (BZ) and the carets indicate a matrix structure in the band index . Impurity effects enter via the self-energy , which modifies the pristine band structure of graphene described by the noninteracting Green’s function, . While is diagonal in the band index, the disorder self-energy in (1) is, in general, not diagonal and Eq. (1) must be solved by matrix inversion.
In the -matrix approximation Rammer (1998); Bruus and Flensberg (2004), the impurity self-energy is given by , where is the impurity concentration (impurities per unit cell), and denotes the -diagonal elements of the matrix. The matrix takes into account multiple scattering off the individual impurities, and is given by the integral equation
| (2) |
where are the impurity matrix elements. The -matrix self-energy is exact to leading order in the impurity concentration , and is therefore a good approximation for low impurity concentrations, i.e., .
In the following, we obtain the GF and spectral function of Li@graphene based on atomistic DFT (LCAO) calculations cal of the band structure and impurity matrix elements sampled in the full BZ using the atomistic method described in Refs. Kaasbjerg et al. (2017); Kaasbjerg (2019) (see Ref. Lu et al. (2019) for recent related developments).
Li-adatom impurity potential.—For the initial characterization of the Li adatoms, we have carried out standard DFT calculations cal , finding that the hollow site at the center of the hexagon of the graphene lattice is the favored adsorption site at a distance of above the graphene layer, and a net charge of donated to the graphene lattice per Li adatom (), consistent with previous works Chan et al. (2008); Wehling et al. (2009a).
In our DFT calculated impurity matrix elements cal , where is the Bloch state of the pristine system, the microscopic details of the graphene-Li interaction are encoded in the DFT Li-adatom impurity potential . For the sake of simplicity we here express it as
| (3) |
where the two dominant contributions come from (1) the Coulomb potential from the charged Li adatoms () which corresponds approximately to a screened point-charge potential given by in Fourier space where is the two-dimensional (2D) static dielectric function of graphene Hwang et al. (2007); scr , and (2) the atomic Li 2s state with energy which can be reduced to an effective potential described by the DFT pseudopotential Kaasbjerg (2019) (see, e.g., Refs Wehling et al., 2009b; Irmer et al., 2018 for tight-binding examples).
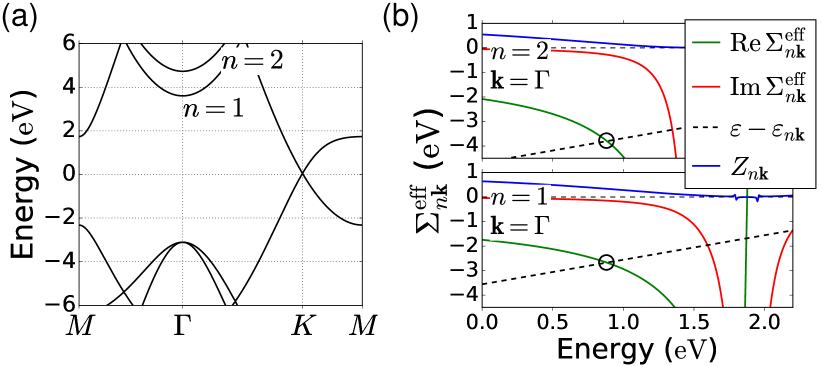
For an accurate description of the atomic 2s state in the matrix, we use a Bloch-state basis which describes both the graphene layer and the vacuum region where the Li atoms reside. In our DFT-LCAO based method, this is achieved by introducing socalled ”ghost” atoms in the surface region which enlarge the standard LCAO basis for graphene. In the graphene band structure shown in Fig. 2, this gives rise to the two -point centered parabolic bands (labeled ) located –5 eV above the Dirac point () which are absent in standard tight-binding and DFT-LCAO calculations Castro Neto et al. (2009); Papior et al. (2018). The two bands correspond to free-electron-like surface states located predominantly outside the graphene plane with, respectively, even () and odd () parity with respect to graphene’s mirror symmetry plane Papior et al. (2018), and they are instrumental for the occurrence of the impurity band in Fig. 1(b).
Li@graphene spectral function.—In Fig. 1(b) we show the calculated spectral function for , where is given by the imaginary part of the diagonal elements of the GF. The dashed horizontal line shows the Fermi level assuming a Li-induced carrier density of , where is the areal density of Li atoms, and zero residual doping often present experimentally Ludbrook et al. (2015). The spectral function exhibits two distinct features which are absent in the pristine band structure of graphene.
The first is the appearance of a prominent -centered parabolic impurity band which starts eV above the Dirac point and extends up to eV where it vanishes. As indicated by the Fermi level, this band is populated at the considered and is hence important for the electronic and transport properties of Li@graphene, including its potential superconducting state Ludbrook et al. (2015). The second feature is a pronounced renormalization and broadening of the conduction band near the point which is an indication of strong QP scattering.
As justified below, these features can be analyzed using a diagonal form of the impurity-averaged GF, . Thus, the renormalized QP bands follow from the solution to the QP equation . In the vicinity of , the spectral function takes the form
| (4) |
where the wave-function renormalization, or QP weight, is given by , and is the linewidth broadening due to impurity scattering.
Besides renormalization of the pristine band structure, impurities with resonant atomic levels may introduce new spectral features as is the case here. Such features stem from additional solutions to the QP equation, and the spectral function acquires an additional impurity component, , where well-defined QPs are assumed and is given by Eq. (4) with . By virtue of the sum rule , this results in a reduction of the QP weights of the pristine bands from their unperturbed value .
In the rest of the paper, we clarify the microscopic origin of the adatom-related features in Fig. 1(b) as well as their dependence on the concentration of Li adatoms.
Hybrid impurity band.—The origin of the -centered impurity band can be traced back to the coupling between the surface states in Fig. 2 and the atomic Li 2s state via the last term in Eq. (3). This introduces a pole in the matrix at the renormalized energy eV of the 2s state. At , the pole together with the broken mirror plane symmetry in Li@graphene gives rise to large diagonal and off-diagonal -matrix elements between the surface states sup , which dominate all other elements. To facilitate a simple analysis, we can thus approximate the GF in the surface-state subspace by the inverse of its subblock on the right-hand side of Eq. (1). The diagonal elements of the GF take the form , where the effective self-energy,
| (5) |
describes virtual transitions between the surface state and the Li 2s state either (i) directly (first term), or (ii) via the other surface state (second term).
With this form of the diagonal elements of the GF, the analysis in Eq. (4) applies. In Fig. 2(b) we show the real (green lines) and imaginary parts (red lines) of the diagonal elements of the effective self-energy, , together with the calculated QP weight (blue lines) and (black dashed). The intersection of the latter with (marked with circles) signifies the emergence of the -centered hybrid impurity band in Fig. 1(b). The QP weights at the point are, respectively, and , yielding a total QP weight of for the impurity band.
We have thus identified the spectral -point feature observed in ARPES Ludbrook et al. (2015) as a low-energy hybridized impurity band arising from the coherent coupling between the surface states and the Li 2s state as described by Eq. (5). In the periodic LiC6 structure, the analog of this band plays a pivotal role for the predicted superconductivity by enhancing the el-ph coupling at the Fermi level Profeta et al. (2012).
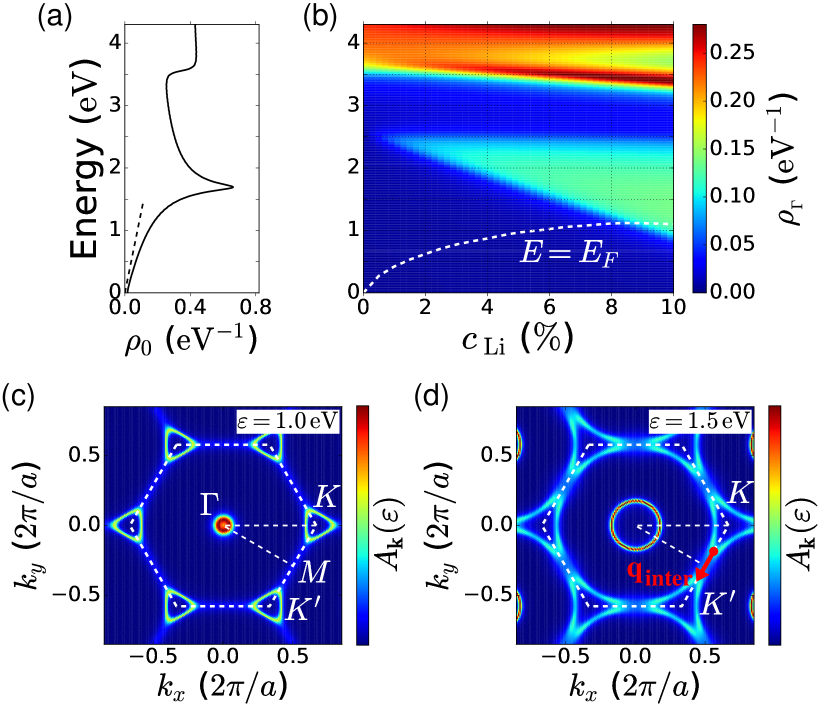
It is therefore interesting to investigate the concentration dependence of the impurity band and its alignment with the Fermi level in Li@graphene. In Figs. 3(a) and 3(b), we show the DOS (per unit cell) for, respectively, (i) pristine graphene (), and (ii) the -centered bands in Li@graphene () obtained by restricting the sum in the trace to a region around the point enclosing the relevant bands. The dashed line in Fig. 3(b) marks the position of the Fermi level corresponding to the Li-induced carrier density . In the Dirac model the Fermi energy scales as , whereas the Fermi energy in Fig. 3(b) deviates from this square-root dependence at high where it flattens out due to the population of the hybrid band and the nonlinear part of the Dirac cone. The figure illustrates the development of the hybrid impurity band which starts from the position of the Li 2s state and moves down towards the Dirac cone with increasing Li concentration. Interestingly, our calculations show that the hybrid impurity band aligns with the Fermi level on the Dirac cone at Li concentrations as low as ( eV) where the DOS of the impurity band and the Dirac-cone DOS are comparable. In the presence of a residual doping of graphene Ludbrook et al. (2015), this situation is realized at even lower .
Dirac-cone QP properties.—Finally, we consider the effect of adatom-induced QP scattering on the renormalization and linewidth broadening of the Dirac-cone bands in Fig. 1(b) and Figs. 3(c) and 3(d). As the self-energy on the Dirac cone is diagonal sup , the renormalized QP bands and linewidth broadening can be obtained as explained above and below Eq. (4).
In Fig. 4 we show the energy dependence of the linewidth broadening of the conduction band along the - and - paths for a fixed Li concentration of at which the impurity band is absent [cf. Fig. 3(a)]. For clarity, we have separated out the contributions from intravalley (left) and intervalley (right) scattering using the optical theorem sup ; Kaasbjerg (2019). At energies below eV, the intravalley rate exceeds the intervalley rate by far. This is consistent with charged-impurity scattering where intervalley scattering with is weak due to the dependence of the 2D Coulomb potential . We find no indications of resonant scattering Basko (2008); Robinson et al. (2008); Wehling et al. (2010); Irmer et al. (2018) which is suppressed by the remote energy of the Li 2s state as well as the invisibility of short-range impurity potentials due to adatoms in the hollow site Duffy et al. (2016); Ruiz-Tijerina and Dias da Silva (2016); Irmer et al. (2018). At higher energies, both the intra and intervalley rates increase dramatically and peak at the energy eV of the van Hove singularity (vHS) in the DOS in Fig. 3(a). Whereas the increasing DOS at the vHS is the main reason for the increasing intravalley rate, also the strong trigonal warping of the Dirac cones seen in Figs. 3(c) and 3(d) is important in order to explain the increase in the intervalley rate. As illustrated in Fig. 3(d), the trigonal warping reduces the intervalley scattering wave vector markedly and thereby enhances the scattering probability due to the dependence of Coulomb potential. This effect is most pronounced on the - path, where the reduction in the intervalley wave vector is strongest, and results in an anisotropic linewidth broadening also visible on the eV constant-energy contours in Fig. 3(d). In Figs. 3(c) and 3(d), , and scattering between the overlapping impurity band and Dirac cones may also contribute to the broadening. However, the narrow linewidth of the impurity band shows that this scattering channel is weak because of a small impurity matrix element between the spatially separated surface and Dirac-cone states. Dirac-cone QP scattering is thus not affected markedly by the impurity band.
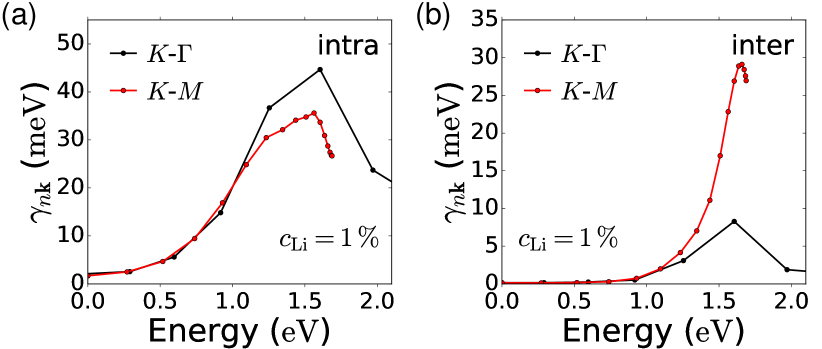
Interestingly, the strong peak in the linewidth broadening at the vHS is accompanied by a pronounced renormalization of the conduction band in the same energy range as demonstrated by the calculated QP band in Fig. 1(b) (solid blue line). Along the - path, the conduction band exhibits a pronounced downshift and a kink – meV below the vHS, resembling experimental ARPES features in highly adatom-doped McChesney et al. (2010); Fedorov et al. (2014) as well as intercalated Link et al. (2019) graphene. At high doping levels McChesney et al. (2010); Fedorov et al. (2014); Bianchi et al. (2010), this adatom-induced kink may interfere with el-ph related kinks located at the optical phonon energy meV below the Fermi level Calandra and Mauri (2007a); Park et al. (2007); Tse and Das Sarma (2007); Park et al. (2009), thus obscuring the analysis of the el-ph interaction Park et al. (2008); Calandra and Mauri (2007b) in the regime relevant for superconductivity.
Conclusions.—We have studied the spectral function and quasiparticle scattering in disordered Li-decorated graphene with an atomistic -matrix method. We demonstrated that (i) the experimentally observed low-energy spectral feature at the point Ludbrook et al. (2015) originates from a Li-dependent hybrid impurity band which aligns with the Li-induced Fermi level at , and (ii) Li-induced charged-impurity scattering produces a strong linewidth broadening and a concomitant downshift and kink in the conduction band in the vicinity of the van Hove singularity in the graphene DOS. Our findings are highly relevant for future studies of transport Chen et al. (2008); Yan and Fuhrer (2011); Khademi et al. (2016); Chandni et al. (2015) and ARPES McChesney et al. (2010); Fedorov et al. (2014); Link et al. (2019) as well as analyses of the el-ph interaction Park et al. (2008); Calandra and Mauri (2007b) and superconductivity Profeta et al. (2012); Ludbrook et al. (2015) in adatom-doped graphene.
Acknowledgements.
Acknowledgments.—We would like to thank T. Olsen, M. Brandbyge and J. A. Folk for fruitful discussions and comments. K.K. acknowledges support from the European Union’s Horizon 2020 research and innovation programme under the Marie Sklodowska-Curie Grant Agreement No. 713683 (COFUNDfellowsDTU). The Center for Nanostructured Graphene (CNG) is sponsored by the Danish National Research Foundation, Project DNRF103.References
- Weeks et al. (2011) C. Weeks, J. Hu, J. Alicea, M. Franz, and R. Wu, “Engineering a robust quantum spin Hall state in graphene via adatom deposition,” Phys. Rev. X 1, 021001 (2011).
- Cresti et al. (2014) A. Cresti, D. Van Tuan, D. Soriano, A. W. Cummings, and S. Roche, “Multiple quantum phases in graphene with enhanced spin-orbit coupling: From the quantum spin Hall regime to the spin Hall effect and a robust metallic state,” Phys. Rev. Lett. 113, 246603 (2014).
- Santos et al. (2018) F. J. Santos, D. A. Bahamon, R. B. Muniz, K. McKenna, E. V. Castro, J. Lischner, and A. Ferreira, “Impact of complex adatom-induced interactions on quantum spin Hall phases,” Phys. Rev. B 98, 081407(R) (2018).
- Uchoa and Castro Neto (2007) B. Uchoa and A. H. Castro Neto, “Superconducting states of pure and doped graphene,” Phys. Rev. Lett. 98, 146801 (2007).
- Profeta et al. (2012) G. Profeta, M. Calandra, and F. Mauri, “Phonon-mediated superconductivity in graphene by lithium deposition,” Nature Phys. 8, 131 (2012).
- Margine and Giustino (2014) E. R. Margine and F. Giustino, “Two-gap superconductivity in heavily -doped graphene: Ab initio Migdal-Eliashberg theory,” Phys. Rev. B 90, 014518 (2014).
- Bianchi et al. (2010) M. Bianchi, E. D. L. Rienks, S. Lizzit, A. Baraldi, R. Balog, L. Hornekær, and Ph. Hofmann, “Electron-phonon coupling in potassium-doped graphene: Angle-resolved photoemission spectroscopy,” Phys. Rev. B 81, 041403(R) (2010).
- McChesney et al. (2010) J. L. McChesney, A. Bostwick, T. Ohta, T. Seyller, K. Horn, J. González, and E. Rotenberg, “Extended van Hove singularity and superconducting instability in doped graphene,” Phys. Rev. Lett. 104, 136803 (2010).
- Siegel et al. (2011) D. A. Siegel, C.-H. Park, C. Hwang, J. Deslippe, A. V. Fedorov, S. G. Louie, and A. Lanzara, “Many-body interactions in quasi-freestanding graphene,” PNAS 108, 11365 (2011).
- Fedorov et al. (2014) A. V. Fedorov, N. I. Verbitskiy, D. Haberer, C. Struzzi, L. Petaccia, D. Usachov, O. Y. Vilkov, D. V. Vyalikh, J. Fink, M. Knupfer, B. Büchner, and A. Grüneis, “Observation of a universal donor-dependent vibrational mode in graphene,” Nature Commun. 5, 3257 (2014).
- Ludbrook et al. (2015) B. M. Ludbrook, G. Levy, P. Nigge, M. Zonno, M. Schneider, D. J. Dvorak, C. N. Veenstra, S. Zhdanovich, D. Wong, P. Dosanjh, C. Straßer, A. Stöhr, S. Forti, C. R. Ast, U. Starke, and A. Damascelli, “Evidence for superconductivity in Li-decorated monolayer graphene,” PNAS 112, 11795 (2015).
- Khademi et al. (2016) A. Khademi, E. Sajadi, P. Dosanjh, D. A. Bonn, J. A. Folk, A. Stöhr, U. Starke, and S. Forti, “Alkali doping of graphene: The crucial role of high-temperature annealing,” Phys. Rev. B 94, 201405(R) (2016).
- Chen et al. (2008) J.-H. Chen, C. Jang, S. Adam, M. S. Fuhrer, E. D. Williams, and M. Ishigami, “Charged-impurity scattering in graphene,” Nature Phys. 4, 377 (2008).
- Yan and Fuhrer (2011) J. Yan and M. S. Fuhrer, “Correlated charged impurity scattering in graphene,” Phys. Rev. Lett. 107, 206601 (2011).
- Chandni et al. (2015) U. Chandni, E. A. Henriksen, and J. P. Eisenstein, “Transport in indium-decorated graphene,” Phys. Rev. B 91, 245402 (2015).
- Khademi et al. (2019) A. Khademi, K. Kaasbjerg, P. Dosanjh, A. Stöhr, S. Forti, U. Starke, and J. A. Folk, “Weak localization measurements of electronic scattering rates in Li-doped epitaxial graphene,” Phys. Rev. B 100, 161405(R) (2019).
- Damascelli et al. (2003) A. Damascelli, Z. Hussain, and Z.-X. Shen, “Angle-resolved photoemission studies of the cuprate superconductors,” Rev. Mod. Phys. 75, 473 (2003).
- Bostwick et al. (2007) A. Bostwick, T. Ohta, T. Seyller, K. Horn, and E. Rotenberg, “Quasiparticle dynamics in graphene,” Nature Phys. 3, 36 (2007).
- Siegel et al. (2013) D. A. Siegel, W. Regan, A. V. Fedorov, A. Zettl, and Alessandra Lanzara, “Charge-carrier screening in single-layer graphene,” Phys. Rev. Lett. 110, 146802 (2013).
- Straßer et al. (2015) C. Straßer, B. M. Ludbrook, G. Levy, A. J. Macdonald, S. A. Burke, T. O. Wehling, K. Kern, A. Damascelli, and C. R. Ast, “Long-versus short-range scattering in doped epitaxial graphene,” Nano. Lett. 15, 2825 (2015).
- Calandra and Mauri (2007a) M. Calandra and F. Mauri, “Electron-phonon coupling and electron self-energy in electron-doped graphene: Calculation of angular-resolved photoemission spectra,” Phys. Rev. B 76, 205411 (2007a).
- Park et al. (2007) C. H. Park, F. Giustino, M. L. Cohen, and S. G. Louie, “Velocity renormalization and carrier lifetime in graphene from the electron-phonon interaction,” Phys. Rev. Lett. 99, 086804 (2007).
- Tse and Das Sarma (2007) W. K. Tse and S. Das Sarma, “Phonon-induced many-body renormalization of the electronic properties of graphene,” Phys. Rev. Lett. 99, 236802 (2007).
- Hwang and Das Sarma (2008) E. H. Hwang and S. Das Sarma, “Quasiparticle spectral function in doped graphene: Electron-electron interaction effects in ARPES,” Phys. Rev. B 77, 081412(R) (2008).
- Polini et al. (2008) M. Polini, R. Asgari, G. Borghi, Y. Barlas, T. Pereg-Barnea, and A. H. MacDonald, “Plasmons and the spectral function of graphene,” Phys. Rev. B 77, 081411(R) (2008).
- Park et al. (2009) C.-H. Park, F. Giustino, C. D. Spataru, M. L. Cohen, and S. G. Louie, “Angle-resolved photoemission spectra of graphene from first-principles calculations,” Nano. Lett. 9, 4234 (2009).
- Csányi et al. (2005) G. Csányi, P. B. Littlewood, A. H. Nevidomskyy, C. J. Pickard, and B. D. Simons, “The role of the interlayer state in the electronic structure of superconducting graphite intercalated compounds,” Nature Phys. 1, 42 (2005).
- Calandra and Mauri (2005) M. Calandra and F. Mauri, “Theoretical explanation of superconductivity in C6Ca,” Phys. Rev. Lett. 95, 237002 (2005).
- Chapman et al. (2016) J. Chapman, Y. Su, C. A. Howard, D. Kundys, A. N. Grigorenko, F. Guinea, A. K. Geim, I. V. Grigorieva, and R. R. Nair, “Superconductivity in Ca-doped graphene laminates,” Sci. Rep. 6, 23254 (2016).
- Kaasbjerg et al. (2017) K. Kaasbjerg, J. H. J. Martiny, T. Low, and A.-P. Jauho, “Symmetry-forbidden intervalley scattering by atomic defects in monolayer transition-metal dichalcogenides,” Phys. Rev. B 96, 241411(R) (2017).
- Kaasbjerg (2019) K. Kaasbjerg, “Atomistic -matrix theory of disordered 2D materials: bound states, spectral properties, quasiparticle scattering and transport,” (2019), arXiv:1911.00530.
- Basko (2008) D. M. Basko, “Resonant low-energy electron scattering on short-range impurities in graphene,” Phys. Rev. B 78, 115432 (2008).
- Robinson et al. (2008) J. P. Robinson, H. Schomerus, L. Oroszlány, and V. I. Fal’ko, “Adsorbate-limited conductivity of graphene,” Phys. Rev. Lett. 101, 196803 (2008).
- Wehling et al. (2010) T. O. Wehling, S. Yuan, A. I. Lichtenstein, A. K. Geim, and M. I. Katsnelson, “Resonant scattering by realistic impurities in graphene,” Phys. Rev. Lett. 105, 056802 (2010).
- Irmer et al. (2018) S. Irmer, D. Kochan, J. Lee, and J. Fabian, “Resonant scattering due to adatoms in graphene: Top, bridge, and hollow positions,” Phys. Rev. B 97, 075417 (2018).
- Link et al. (2019) S. Link, S. Forti, A. Stöhr, K. Küster, M. Rösner, D. Hirschmeier, C. Chen, J. Avila, M. C. Asensio, A. A. Zakharov, T. O. Wehling, A. I. Lichtenstein, M. I. Katsnelson, and U. Starke, “Introducing strong correlation effects into graphene by gadolinium intercalation,” Phys. Rev. B 100, 121407(R) (2019).
- Park et al. (2008) C.-H. Park, F. Giustino, J. L. McChesney, A. Bostwick, T. Ohta, E. Rotenberg, M. L. Cohen, and Steven G. Louie, “Van hove singularity and apparent anisotropy in the electron-phonon interaction in graphene,” Phys. Rev. B 77, 113410 (2008).
- Calandra and Mauri (2007b) M. Calandra and F. Mauri, “Electronic structure of heavily doped graphene: The role of foreign atom states,” Phys. Rev. B 76, 161406(R) (2007b).
- Mahan (2010) G. D. Mahan, Many-particle Physics, 3rd ed. (Springer, 2010).
- Bruus and Flensberg (2004) H. Bruus and K. Flensberg, Many-body Quantum Theory in Condensed Matter Physics (Oxford University Press, 2004).
- Rammer (1998) J. Rammer, Quantum Transport Theory (Perseus Books, 1998).
- (42) All DFT calculations have been performed with the electronic structure code GPAW Mortensen et al. (2005); Larsen et al. (2009); Enkovaara et al. (2010) within the projector augmented-wave method, using the LDA xc functional and a LCAO double-zeta polarized (DZP) basis set. The ground-state calculation of the optimized structure and Bloch functions was performed using a -point sampling of the BZ. The Li impurity potential was obtained using a supercell and a -point sampling. All calculations include 10 Å of vacuum between graphene and the cell boundaries in the vertical direction imposed with Dirichlet boundary conditions. The impurity matrix elements, -matrix self-energy and GF were obtained on a BZ grid, including the 12 lowest bands and using a numerical broadening of meV.
- Mortensen et al. (2005) J. J. Mortensen, L. B. Hansen, and K. W. Jacobsen, “Real-space grid implementation of the projector augmented wave method,” Phys. Rev. B 71, 035109 (2005).
- Larsen et al. (2009) A. H. Larsen, M. Vanin, J. J. Mortensen, K. S. Thygesen, and K. W. Jacobsen, “Localized atomic basis set in the projector augmented wave method,” Phys. Rev. B 80, 195112 (2009).
- Enkovaara et al. (2010) J. Enkovaara, C. Rostgaard, J. J. Mortensen, J. Chen, M. Dułak, L. Ferrighi, J. Gavnholt, C. Glinsvad, V. Haikola, and H. A. Hansen et al., “Electronic structure calculations with GPAW: a real-space implementation of the projector augmented-wave method,” J. Phys.: Cond. Matt. 22, 253202 (2010).
- Lu et al. (2019) I-Te Lu, J.-J. Zhou, and M. Bernardi, “Efficient ab initio calculations of electron-defect scattering and defect-limited carrier mobility,” Phys. Rev. Materials 3, 033804 (2019).
- Chan et al. (2008) K. T. Chan, J. B. Neaton, and M. L. Cohen, “First-principles study of metal adatom adsorption on graphene,” Phys. Rev. B 77, 235430 (2008).
- Wehling et al. (2009a) T. O. Wehling, M. I. Katsnelson, and A. I. Lichtenstein, “Impurities on graphene: Midgap states and migration barriers,” Phys. Rev. B 80, 085428 (2009a).
- Hwang et al. (2007) E. H. Hwang, S. Adam, and S. Das Sarma, “Carrier transport in two-dimensional graphene layers,” Phys. Rev. Lett. 98, 186806 (2007).
- (50) Here, screening of the impurity potential by the Li-induced carriers is accounted for in the supercell DFT calculation of the impurity potential corresponding to a Fermi energy of eV.
- Wehling et al. (2009b) T.O. Wehling, M.I. Katsnelson, and A.I. Lichtenstein, “Adsorbates on graphene: Impurity states and electron scattering,” Chem. Phys. Lett. 476, 125 (2009b).
- Papior et al. (2018) N. R. Papior, G. Calogero, and M. Brandbyge, “Simple and efficient LCAO basis sets for the diffuse states in carbon nanostructures,” J. Phys.: Cond. Matt. 30, 25LT01 (2018).
- Castro Neto et al. (2009) A. H. Castro Neto, F. Guinea, N. M. R. Peres, K. S. Novoselov, and A. K. Geim, “The electronic properties of graphene,” Rev. Mod. Phys. 81, 109 (2009).
- (54) Supplemental material which includes plots of the -matrix self-energy and details on the extraction of the intra- and intervalley contributions to the linewidth broadening using the optical theorem.
- Duffy et al. (2016) J. Duffy, J. Lawlor, C. Lewenkopf, and M. S. Ferreira, “Impurity invisibility in graphene: Symmetry guidelines for the design of efficient sensors,” Phys. Rev. B 94, 045417 (2016).
- Ruiz-Tijerina and Dias da Silva (2016) D. A. Ruiz-Tijerina and L. G. G. V. Dias da Silva, “Symmetry-protected coherent transport for diluted vacancies and adatoms in graphene,” Phys. Rev. B 94, 085425 (2016).
See pages 1 of supplementary See pages 2 of supplementary