Mathematical modeling of variability in intracellular signaling
Abstract
Cellular signaling is essential in information processing and decision making. Therefore, a variety of experimental approaches have been developed to study signaling on bulk and single-cell level. Single-cell measurements of signaling molecules demonstrated a substantial cell-to-cell variability, raising questions about its causes and mechanisms and about how cell populations cope with or exploit cellular heterogeneity. To gain insights from single-cell signaling data, analysis and modeling approaches have been introduced. This review discusses these modeling approaches, with a focus on recent advances in the development and calibration of mechanistic models. Additionally, it outlines current and future challenges.
Introduction
Cell-to-cell variability is omnipresent in biological systems and manifests itself even between genetically identical cells 1. Causes include epigenetic differences, the cellular microenvironment, differences in protein expression and asymmetric cell division 2, 3. This variability has been shown to influence and determine cellular decision making and has been studied in various contexts, including cancer drug resistance 4, pluripotency of stem cells 5 and microbial infection 6. Indeed, studies have indicated that biological systems have evolved to exploit cell-to-cell variability, for example, to enable gradual responses on the population level 7.
Sources of cell-to-cell variability are often categorized as intrinsic and extrinsic noise. Swain et al. 8 defined intrinsic noise as stochastic fluctuations occurring in the reaction of interest, and extrinsic noise as changes in processes influencing the reaction rates. Extrinsic noise is often assumed to be slow, resulting in stable differences between cells 9, 10, e.g., protein levels and reaction rates. When studying signaling pathways, the abundance of the involved biochemical species is assumed to be high enough to neglect intrinsic noise based on theory of stochastic processes 11.
To study variability in cellular signaling, measurements at the single-cell level are required. Experimental techniques comprise live-cell imaging using fluorescent markers 12, providing single-cell time-lapse data, or mass 13 and flow cytometry 14 for single-cell snapshot data (see Gaudet and Miller-Jensen 15 for a review on experimental techniques for single-cell signaling data). The data provide different types of information about the cells. Single-cell time-lapse data contain the trajectories of individual cells and are in this respect more informative than snapshot data. However, the number of measured cells and measured quantities is usually much lower.
The complexity of signal transduction often limits the intuitive interpretation of experimental data. Therefore, various data analysis and modeling approaches have been introduced. Contributions range from statistical and information theoretical approaches, e.g., to assess the population structure 16 and the efficiency of information processing 17, 18, to mechanistic modeling of cellular variability and the calibration of these models (see Kolitz and Lauffenburger 19 for a review on single-cell modeling of receptor-mediated signaling).
In this review, we outline the state-of-the-art in the mathematical modeling of cell-to-cell variability in signaling. We discuss statistical and mechanistic models of single-cell signaling and focus on mechanistic models accounting for extrinsic noise. We review how these mechanistic models can be calibrated to experimental data to gain insights into the biological system. We distinguish between single-cell time-lapse and single-cell snapshot data, which both pose different challenges to model calibration. In the end, we outline current and future challenges arising in modeling of cellular variability.
Mathematical modeling of single-cell signaling data
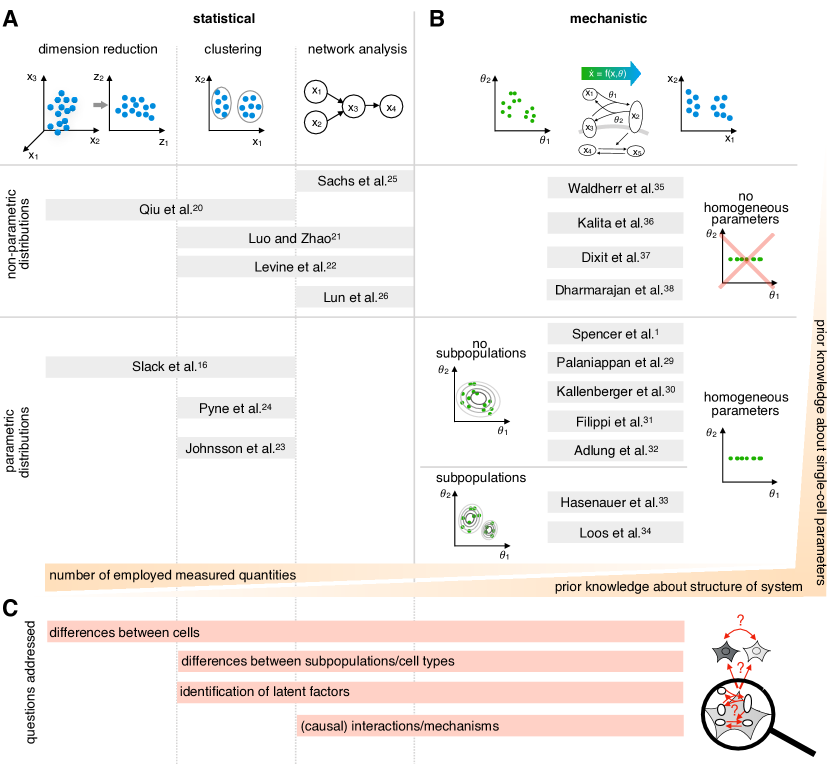
The choice of modeling technique highly depends on the considered biological question and the amount of available prior knowledge (Figure 1A,B). Biological questions are often related to general differences between cells and detailed intracellular mechanisms (Figure 1C). In the following, we discuss methods which have been used to study variability in signaling, mainly distinguishing between statistical and mechanistic models.
Statistical models are well suited to analyze large and high-dimensional data sets. A first approach is often to visualize the data in a two- or three-dimensional space, employing linear or nonlinear dimension reduction methods (Figure 1A). These techniques, e.g., find the directions of the largest variations and thus the cellular quantities which differ most between individual cells. To study differences between subpopulations or cell types, these subpopulations/cell types need to be defined first.
This can either be done by using established biomarkers or data-driven approaches, i.e., unsupervised clustering. Clustering is performed in the dimension-reduced 16 or high-dimensional space of measured quantities 20, 21, 22. It is approached using a non-parametric description of the distribution 20, 21, 22, or relies on a parametric distribution for the measured quantities 16, 23, 24. Often, Gaussian mixture distributions 16, 23 or mixtures of alternative distributions which better cope with skewness and outliers 24 are employed. These statistical methods have been used to, e.g., study the role of signaling variability in the response to drug treatment 16 or determine signaling signatures in acute myeloid leukemia 22. If the goal is to identify interactions between cellular quantities, network based methods are often used.
Sachs et al. 25 used Bayesian network reconstruction to analyze perturbation data, and reconstructed causal interactions between signaling proteins.
Lun et al. 26 introduced the statistical measure ‘binned pseudo R-squared’, which is used for binned single-cell snapshot data and takes into account the deviation from the bin median over time. This facilitates the generation of hypotheses, e.g., KRAS or MEK1 being main drivers of oncogenic signaling.
For a comprehensive review of analysis of mass cytometry data, comparing commonly used methods including SPADE 20 and PhenoGraph 22, we refer to Kimball et al. 27 or Palit et al. 28, in which the use of tools for single-cell RNA sequencing data for cytometry data is discussed.
While these statistical methods possess rather low computation times, they cannot be used to study detailed mechanisms of the underlying biological processes.
Mechanistic models are employed to incorporate prior knowledge about the underlying biochemical reactions (Figure 1B). This is often accomplished using ordinary differential equation (ODE) models, which describe the temporal evolution of the biochemical species. To model extrinsic noise, it is mostly assumed that parameters of the ODE model which relate to cellular properties differ between cells. In the last decade, a number of modeling approaches has been developed with different approaches to describe this property distribution. Some approaches assume parametric models for the extrinsic noise 1, 29, 30, 31, 32, 33, 34, while others do not require such a parametric description 35, 36, 37, 38. In non-parametric approaches, all parameters need to be variable, and homogeneous parameters, i.e., parameters which are shared between cells, cannot be incorporated. However, some of the approaches could be extended to allow for homogeneous parameters.
Approaches that use a parametric distribution to encode the distribution of single-cell parameters allow for homogeneous parameters. One of the first studies which incorporated extrinsic noise in a mathematical model was performed by Spencer et al. 1, who established the importance of non-genetic variability for cellular decisions such as apoptosis. They assumed that initial protein concentrations follow a log-normal distribution and sampled from this distribution to analyze their model. This distribution assumption was also used in other publications 30, 31, while for model analysis also uniform distributions have been considered 29. These methods all assume a unimodal distribution and do not explicitly account for subpopulation structures. This was addressed by Hasenauer et al. 33 and Loos et al. 34. The first approach allows for differences in parameters for subpopulations 33, while the second also allows for cell-to-cell variability within subpopulations 34. Accounting for subpopulation structures rendered it possible to detect that extracellular scaffolds influence nerve growth factor-induced signaling in nociceptive neurons and do not change the subgroup composition 34.
Calibration of mechanistic models
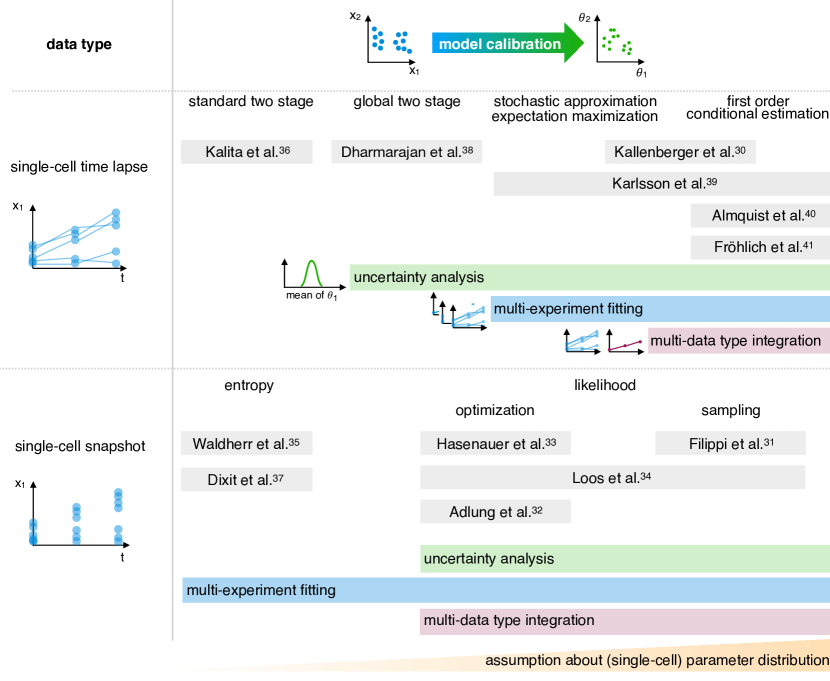
To obtain insights into the considered biological system, the mechanistic models discussed above need to be calibrated on experimental data. Non-parametric approaches require the inference of single-cell parameters, while parametric approaches recover the distribution/population parameters, e.g., mean and covariances. For model calibration different approaches are employed depending on the use of single-cell time-lapse or single-cell snapshot data. Here, we categorize the approaches according to the following aspects: employed data type; and ability to (i) assess the uncertainty of parameter estimates, a task which is required to distinguish between biological variability and parameter uncertainty, (ii) simultaneously fit multiple experiments which share parameters and (iii) integrate different data types (Figure 2). The integration of multiple experiments and data types facilitates the use of more information and thus can yield improved parameter identifiability. Methods which allow for more of these analyses require more assumptions about the distribution of single-cell parameters. The colored bars in Figure 2 indicate which analyses are technically possible with the methods as they are introduced in the respective publications. However, with methodological extensions more of the analyses (i)-(iii) might be possible.
In the following, we focus on publications in the field of systems biology. Many of the methods have initially been introduced in different contexts, e.g., epidemiology or pharmacology.
For model fitting to single-cell time-lapse data, one approach is to fit the deterministic model for each cell individually and subsequently analyze the estimated single-cell parameters to obtain population parameters 39. While this approach, known as ‘standard two stage approach’, is intuitive, uncertainty of the estimated population parameters and cellular heterogeneity cannot be distinguished and heterogeneity is often overestimated.
The global two stage approach 38 corrects for this in the second stage by exploiting a local measure for the uncertainty of single-cell parameters and an empirical Bayes estimator.
Alternative approaches integrate the two stages and consider all single-cell trajectories simultaneously. This allows the integration of different data types. Kallenberger et al. 30 approximated the population likelihood by adding constraint terms to regularize for differences between single-cell parameters. In contrast, mixed-effect models marginalize out the latent single-cell parameters to obtain a population likelihood, for which no closed form is available. The first order conditional estimation (FOCE) uses a Laplacian approximation of the population likelihood 40, 41, which is then maximized using gradient-based optimization. The stochastic approximation expectation maximization (SAEM) algorithm provides an iterative approximation for population likelihood and converges to the true parameter values 42.
For model fitting to single-cell snapshot data, maximum entropy approaches have been developed 35, 37. Waldherr et al. 35 discretized the observations and maximized the entropy of the parameter distribution under the constraint that measured and simulated distribution agree. Dixit et al. 37 improved upon this method by reformulating it to an unconstrained problem. The maximum entropy approaches do not account for measurement noise, and cellular variability and uncertainty of the parameter estimates cannot be distinguished. To distinguish these, additional statistical assumptions are made about the system. This yields a likelihood function, which either describes the whole population density 33, 34, 31 or the deviance between the statistical moments of the data and those predicted by the model 32. The likelihood function can then by maximized 33, 34, 32, and, e.g., subsequently be used to calculate profile likelihoods to assess the uncertainty of the estimated population parameters. Alternatively, sampling is performed and the likelihood function is, e.g., incorporated into a Bayesian setting with a prior distribution for the population parameters 31, 34, and uncertainty can directly be assessed from samples of the posterior distribution. Due to additional information about the parameters encoded in the prior distribution, sampling is placed further to the right in Figure 2, implying that it has more assumptions about the parameters. However, uniform priors can be used in a Bayesian setting or prior distributions can be incorporated in a frequentist setting. For efficiency, which is important for model calibration since the model needs to be evaluated many times, computationally less expensive approximations for the distributions are employed 31, 34, e.g., sigma-point approximations 43.
Analysis of calibrated models
The first step after model calibration is usually to assess whether the model is able to describe the experimental data. Afterwards, the parameter estimates and their uncertainty are assessed, and single-cell parameters are linked to decisions for individual cells. In particular when the model is fitted to multiple data sets simultaneously, it can unravel relations which are not apparent from the experimental data alone, e.g., if and how a factor influences a decision process 44. Sensitivity analysis can be used to predict the effects of changes in cellular properties on the behavior of individual cells. An example for this is given by Aldridge et al. 45, who identified factors for different phenotypes in receptor-mediated apoptosis using Lyapunov exponent analysis to measure the model sensitivity to initial protein concentrations.
Many studies compare models which represent different biological hypothesis using model selection criteria, such as the Bayesian information criterion or Bayes factors, to gain a better understanding of the systems. These analyses led to insights about the contribution of intrinsic and extrinsic noise factors to variability in MAPK signaling 31, dynamics of apoptosis 30, or causal differences between neuronal subpopulations 33, 34.
Conceptually, the models could also be used for experimental design as done for ODE models of cellular signaling 46. However, we are not aware of a publication performing this for single-cell experiments.
Challenges and outlook
A future goal for the analysis of single-cell signaling data is to bridge statistical and mechanistic approaches, which is currently hindered by the scalability of mechanistic model calibration. When studying population average data using ODE models, methodological advances allow for the calibration of detailed models capturing a large number of biochemical species 47. The feasible dimensionality of the parameter space of mechanistic models for single-cell data is much lower, and further method development is required.
Even though it is in principle possible for many of the approaches to integrate different data types, only few publications 30, 32 actually used single-cell data together with population average data. Here, a key challenge is to choose the weighting of the data sets. Furthermore, the topic of uncertainty and identifiability analysis for population models inferred from different data sources needs to be addressed. While for single-cell time-lapse data established methods are applicable 48 and for snapshot data novel approaches have been developed 49, it is unclear how structural identifiability from multiple data types can be addressed.
Besides methodological challenges, the use of the methods is limited by the availability of software tools. Several authors published implementations, but none of the implementations appears to be easy-to-use and flexible enough for broad use. Accordingly, the implementation of mechanistic population models and their calibration is rather time-consuming.
A challenge for all single-cell analyses is the selection and design of appropriate models for the measurement process. For flow cytometry data, it is well known that common statistical models are overly sensitive. Using measures such as the Kolmogorov-Smirnov distance, even differences between two samples under control conditions are usually significant. To avoid statistical errors and over-interpretation of data, the statistical thresholds need to be corrected 50. Unfortunately, in single-cell analysis this is difficult as replicates are generally not available. Advanced measurement models 23 and methods to assess batch effects 51 have been introduced, but it is unclear to which degree these methods address the problem.
Recent technological advances such as imaging mass cytometry 52 or CycIF 53 provide information about the spatial context and cell morphology. Therefore, an open question is how this information can be mechanistically exploited. The consideration of cell-cell communication would be beneficial. However, spatial models with single-cell resolution are computationally demanding and the statistical inference is challenging 54, which often requires flexible inference tools such as approximate Bayesian computation 55.
In summary, the field of model-based analysis of heterogeneous cell populations matured during the last years. There are a number of powerful modeling, simulation and calibration approaches available, and applying these to comprehensive data sets will provide novel biological insights. These approaches are urgently needed, as cellular heterogeneity and signal processing are key factors in diseases such as cancer 56 and immunology 57, 58.
Acknowledgement
We would like to thank Lekshmi Dharmarajan, Purushottam Dixit and Benjamin M. Gyori for discussions about the methods, and Paul Stapor, Daniel Weindl, Dantong Wang, Leonard Schmiester, Elba Raimúndez-Álvarez, Yannik Schälte, Simon Merkt and Erika Dudkin for proof-reading and suggestions about the figures and manuscript. The authors acknowledge funding from the BMBF project FitMultiCell (031L0159A).
References
- Spencer et al. 2009 S. L. Spencer, S. Gaudet, J. G. Albeck, J. M. Burke, and P. K. Sorger. Non-genetic origins of cell-to-cell variability in TRAIL-induced apoptosis. Nat., 459(7245):428–433, May 2009.
- Ebinger et al. 2016 S. Ebinger, E. Z. Özdemir, C. Ziegenhain, S. Tiedt, C. C. Alves, M. Grunert, M. Dworzak, C. Lutz, V. A. Turati, T. Enver, H.-P. Horny, K. Sotlar, S. Parekh, K. Spiekermann, W. Hiddemann, A. Schepers, B. Polzer, S. Kirsch, M. Hoffmann, B. Knapp, J. Hasenauer, H. Pfeifer, R. Panzer-Grümayer, W. Enard, O. Gires, and I. Jeremias. Characterization of rare, dormant, and therapy-resistant cells in acute lymphoblastic leukemia. Cancer Cell, 30(6):849–862, Dec. 2016. doi: 10.1016/j.ccell.2016.11.002.
- Altschuler and Wu 2010 S. J. Altschuler and L. F. Wu. Cellular heterogeneity: Do differences make a difference? Cell, 141(4):559–563, May 2010.
- Niepel et al. 2009 M. Niepel, S. L. Spencer, and P. K. Sorger. Non-genetic cell-to-cell variability and the consequences for pharmacology. Curr. Opin. Biotechnol., 13(5–6):556–561, Dec. 2009. doi: 10.1016/j.cbpa.2009.09.015.
- Filipczyk et al. 2015 A. Filipczyk, C. Marr, S. Hastreiter, J. Feigelman, M. Schwarzfischer, P. S. Hoppe, D. Loeffler, K. D. Kokkaliaris, M. Endele, B. Schauberger, O. Hilsenbeck, S. Skylaki, J. Hasenauer, K. Anastassiadis, F. J. Theis, and T. Schroeder. Network plasticity of pluripotency transcription factors in embryonic stem cells. Nat. Cell Biol., 17:1235–1246, Sept. 2015. doi: 10.1038/ncb3237.
- Munsky and Khammash 2006 B. Munsky and M. Khammash. The finite state projection algorithm for the solution of the chemical master equation. J. Chem. Phys., 124(4):044104, January 2006. doi: 10.1063/1.2145882.
- Mitchell and Hoffmann 2018 S. Mitchell and A. Hoffmann. Identifying noise sources governing cell-to-cell variability. Current opinion in systems biology, 8:39–45, 2018.
- Swain et al. 2002 P. S. Swain, M. B. Elowitz, and E. D. Siggia. Intrinsic and extrinsic contributions to stochasticity in gene expression. Proc. Natl. Acad. Sci. USA, 99(20):12795–12800, Oct. 2002. doi: 10.1073/pnas.162041399.
- Rosenfeld et al. 2005 N. Rosenfeld, J. W. Young, U. Alon, P. S. Swain, and M. B. Elowitz. Gene regulation at the single-cell level. Science, 307(5717):1962–1965, Mar. 2005. doi: 10.1126/science.1106914.
- Dunlop et al. 2008 M. J. Dunlop, R. S. Cox III, J. H. Levine, R. M. Murray, and M. B. Elowitz. Regulatory activity revealed by dynamic correlations in gene expression noise. Nature genetics, 40(12):1493, 2008.
- van Kampen 2007 N. G. van Kampen. Stochastic processes in physics and chemistry. North-Holland, Amsterdam, 3rd edition, 2007.
- Schroeder 2011 T. Schroeder. Long-term single-cell imaging of mammalian stem cells. Nat. Methods, 8(4):30–35, Apr. 2011. doi: 10.1038/nmeth.1577.
- Bodenmiller et al. 2012 B. Bodenmiller, E. R. Zunder, R. Finck, T. J. Chen, E. S. Savig, R. V. Bruggner, E. F. Simonds, S. C. Bendall, K. Sachs, P. O. Krutzik, and G. P. Nolan. Multiplexed mass cytometry profiling of cellular states perturbed by small-molecule regulators. Nat. Biotechnol., 30(9):858–867, Sept. 2012.
- Davey and Kell 1996 H. M. Davey and D. B. Kell. Flow cytometry and cell sorting of heterogeneous microbial populations: the importance of single-cell analyses. Microbiological Reviews, 60(4):641–696, 1996.
- Gaudet and Miller-Jensen 2016 S. Gaudet and K. Miller-Jensen. Redefining signaling pathways with an expanding single-cell toolbox. Trends in biotechnology, 34(6):458–469, 2016.
- Slack et al. 2008 M. D. Slack, E. D. Martinez, L. F. Wu, and S. J. Altschuler. Characterizing heterogeneous cellular responses to perturbations. Proceedings of the National Academy of Sciences, 105(49):19306–19311, 2008. ISSN 0027-8424. doi: 10.1073/pnas.0807038105.
- Suderman et al. 2017 R. Suderman, J. A. Bachman, A. Smith, P. K. Sorger, and E. J. Deeds. Fundamental trade-offs between information flow in single cells and cellular populations. Proceedings of the National Academy of Sciences, 114(22):5755–5760, 2017.
- Jetka et al. 2018 T. Jetka, K. Nienałtowski, S. Filippi, M. P. Stumpf, and M. Komorowski. An information-theoretic framework for deciphering pleiotropic and noisy biochemical signaling. Nature communications, 9(1):4591, 2018.
- Kolitz and Lauffenburger 2012 S. E. Kolitz and D. A. Lauffenburger. Measurement and modeling of signaling at the single-cell level. Biochemistry, 51(38):7433–7443, 2012.
- Qiu et al. 2011 P. Qiu, E. F. Simonds, S. C. Bendall, K. D. Gibbs Jr, R. V. Bruggner, M. D. Linderman, K. Sachs, G. P. Nolan, and S. K. Plevritis. Extracting a cellular hierarchy from high-dimensional cytometry data with SPADE. Nature Biotechnology, 29(10):886–891, 2011.
- Luo and Zhao 2011 R. Luo and H. Zhao. Bayesian hierarchical modeling for signaling pathway inference from single cell interventional data. The annals of applied statistics, 5(2A):725, 2011.
- Levine et al. 2015 J. H. Levine, E. F. Simonds, S. C. Bendall, K. L. Davis, D. A. El-ad, M. D. Tadmor, O. Litvin, H. G. Fienberg, A. Jager, E. R. Zunder, et al. Data-driven phenotypic dissection of AML reveals progenitor-like cells that correlate with prognosis. Cell, 162(1):184–197, 2015.
- Johnsson et al. 2016 K. Johnsson, J. Wallin, and M. Fontes. BayesFlow: latent modeling of flow cytometry cell populations. BMC Bioinformatics, 17(1):25, 2016.
- Pyne et al. 2009 S. Pyne, X. Hu, K. Wang, E. Rossin, T. Lin, L. Maier, C. Baecher-Allan, G. McLachlan, P. Tamayo, D. Hafler, P. De Jager, and J. Mesirov. Automated high-dimensional flow cytometric data analysis. Proc. Natl. Acad. Sci. USA, 106(21):8519–8124, May 2009. doi: 10.1073/pnas.0903028106.
- Sachs et al. 2005 K. Sachs, O. Perez, D. Pe’er, D. A. Lauffenburger, and G. P. Nolan. Causal protein-signaling networks derived from multiparameter single-cell data. Science, 308(5721):523–529, 2005.
- Lun et al. 2017 X.-K. Lun, V. R. Zanotelli, J. D. Wade, D. Schapiro, M. Tognetti, N. Dobberstein, and B. Bodenmiller. Influence of node abundance on signaling network state and dynamics analyzed by mass cytometry. Nature Biotechnology, 35(2):164–172, 2017.
- Kimball et al. 2018 A. K. Kimball, L. M. Oko, B. L. Bullock, R. A. Nemenoff, L. F. van Dyk, and E. T. Clambey. A beginner’s guide to analyzing and visualizing mass cytometry data. The Journal of Immunology, 200(1):3–22, 2018.
- Palit et al. 2018 S. Palit, F. Theis, and C. Zielinski. Meeting the challenges of high-dimensional data analysis in immunology. bioRxiv, 2018. doi: 10.1101/473215.
- Palaniappan et al. 2013 S. K. Palaniappan, B. M. Gyori, B. Liu, D. Hsu, and P. Thiagarajan. Statistical model checking based calibration and analysis of bio-pathway models. In International Conference on Computational Methods in Systems Biology, pages 120–134. Springer, 2013.
- Kallenberger et al. 2014 S. M. Kallenberger, J. Beaudouin, J. Claus, C. Fischer, P. K. Sorger, S. Legewie, and R. Eils. Intra- and interdimeric caspase-8 self-cleavage controls strength and timing of CD95-induced apoptosis. Sci. Signal., 7(316):ra23, Mar. 2014. doi: 10.1126/scisignal.2004738.
- Filippi et al. 2016 S. Filippi, C. P. Barnes, P. D. W. Kirk, T. Kudo, K. Kunida, S. S. McMahon, T. Tsuchiya, T. Wada, S. Kuroda, and M. P. Stumpf. Robustness of MEK-ERK dynamics and origins of cell-to-cell variability in MAPK signaling. Cell Reports, 15(11):2524–2535, June 2016.
- Adlung et al. 2019 L. Adlung, P. Stapor, C. Tönsing, L. Schmiester, L. E. Schwarzmüller, D. Wang, J. Timmer, U. Klingmüller, J. Hasenauer, and M. Schilling. Cell-to-cell heterogeneity in JAK2/STAT5 pathway components and cytoplasmic volumes decide about life or death of erythroid progenitor cells (unpublished). 2019.
- Hasenauer et al. 2014 J. Hasenauer, C. Hasenauer, T. Hucho, and F. J. Theis. ODE constrained mixture modelling: A method for unraveling subpopulation structures and dynamics. PLoS Comput. Biol., 10(7):e1003686, July 2014. doi: 10.1371/journal.pcbi.1003686.
- Loos et al. 2018 C. Loos, K. Moeller, F. Fröhlich, T. Hucho, and J. Hasenauer. A hierarchical, data-driven approach to modeling single-cell populations predicts latent causes of cell-to-cell variability. Cell Systems, 6(5):593–603, 2018. doi: 10.1016/j.cels.2018.04.008.
- Waldherr et al. 2009 S. Waldherr, J. Hasenauer, and F. Allgöwer. Estimation of biochemical network parameter distributions in cell populations. In E. Walter, editor, Proc. of the 15th IFAC Symp. on Syst. Ident., volume 15, pages 1265–1270, Saint-Malo, France, Mar. 2009.
- Kalita et al. 2011 M. K. Kalita, K. Sargsyan, B. Tian, A. Paulucci, H. N. Najm, B. J. Debusschere, and A. R. Brasier. Sources of cell-to-cell variability in canonical Nuclear Factor-B (NF-B) signaling pathway inferred from single cell dynamic images. J. Biol. Chem., 286(43):37741–37757, Aug. 2011. doi: 10.1074/jbc.M111.280925.
- Dixit et al. 2018 P. Dixit, E. Lyashenko, M. Niepel, and D. Vitkup. Maximum entropy framework for inference of cell population heterogeneity in signaling network dynamics. bioRxiv, page 137513, 2018. doi: 10.1101/137513.
- Dharmarajan et al. 2019 L. Dharmarajan, H.-M. Kaltenbach, F. Rudolf, and J. Stelling. A simple and flexible computational framework for inferring sources of heterogeneity from single-cell dynamics. Cell systems, 2019.
- Karlsson et al. 2015 M. Karlsson, D. L. I. Janzén, L. Durrieu, A. Colman-Lerner, M. C. Kjellsson, and G. Cedersund. Nonlinear mixed-effects modelling for single cell estimation: When, why, and how to use it. BMC Systems Biology, 9(1):52, Sep 2015. ISSN 1752-0509. doi: 10.1186/s12918-015-0203-x.
- Almquist et al. 2015 J. Almquist, L. Bendrioua, C. B. Adiels, M. Goksör, S. Hohmann, and M. Jirstrand. A nonlinear mixed effects approach for modeling the cell-to-cell variability of Mig1 dynamics in yeast. PLoS ONE, 10(4):1–32, 04 2015. doi: 10.1371/journal.pone.0124050.
- Fröhlich et al. 2018a F. Fröhlich, A. Reiser, L. Fink, D. Woschée, T. Ligon, F. J. Theis, J. O. Rädler, and J. Hasenauer. Multi-experiment nonlinear mixed effect modeling of single-cell translation kinetics after transfection. npj Systems Biology and Applications, 5(1):1, 2018a. doi: 10.1038/s41540-018-0079-7.
- Llamosi et al. 2016 A. Llamosi, A. M. Gonzalez-Vargas, C. Versari, E. Cinquemani, G. Ferrari-Trecate, P. Hersen, and G. Batt. What population reveals about individual cell identity: Single-cell parameter estimation of models of gene expression in yeast. PLoS Comput. Biol, 12(2):1–18, 02 2016. doi: 10.1371/journal.pcbi.1004706.
- van der Merwe 2004 R. van der Merwe. Sigma-point Kalman filters for probabilistic inference in dynamic state-space models. Ph.d. thesis, Oregon Health & Science University, Apr. 2004.
- Hasenauer et al. 2012 J. Hasenauer, J. Heinrich, M. Doszczak, P. Scheurich, D. Weiskopf, and F. Allgöwer. A visual analytics approach for models of heterogeneous cell populations. EURASIP J. Bioinf. Syst. Biol., 4:10.1186/1687–4153–2012–4, May 2012. doi: 10.1186/1687-4153-2012-4.
- Aldridge et al. 2011 B. B. Aldridge, S. Gaudet, D. A. Lauffenburger, and P. K. Sorger. Lyapunov exponents and phase diagrams reveal multi-factorial control over TRAIL-induced apoptosis. Mol. Syst. Biol., 7(1):553, Nov. 2011. doi: 10.1038/msb.2011.85.
- Bandara et al. 2009 S. Bandara, J. P. Schlöder, R. Eils, H. G. Bock, and T. Meyer. Optimal experimental design for parameter estimation of a cell signaling model. PLoS computational biology, 5(11):e1000558, 2009.
- Fröhlich et al. 2018b F. Fröhlich, T. Kessler, D. Weindl, A. Shadrin, L. Schmiester, H. Hache, A. Muradyan, M. Schütte, J.-H. Lim, M. Heinig, F. J. Theis, H. Lehrach, C. Wierling, B. Lange, and J. Hasenauer. Efficient parameter estimation enables the prediction of drug response using a mechanistic pan-cancer pathway model. Cell Systems, 7(6):567–579.e6, Dec. 2018b. ISSN 2405-4712. doi: https://doi.org/10.1016/j.cels.2018.10.013.
- Chis et al. 2011 O.-T. Chis, J. R. Banga, and E. Balsa-Canto. Structural identifiability of systems biology models: A critical comparison of methods. PLoS ONE, 6(11):e27755, Nov. 2011. doi: 10.1371/journal.pone.0027755.
- Zeng et al. 2015 S. Zeng, S. Waldherr, and F. Allgöwer. An inverse problem of tomographic type in population dynamics. Proceedings of the IEEE Conference on Decision and Control, 2015:1643–1648, 02 2015. doi: 10.1109/CDC.2014.7039635.
- Lampariello 2000 F. Lampariello. On the Kolmogorov-Smirnov statistical test for immunofluorescence histogram comparison. Cytometry Part A, 39(3):179–188, Feb. 2000.
- Büttner et al. 2019 M. Büttner, Z. Miao, F. A. Wolf, S. A. Teichmann, and F. J. Theis. A test metric for assessing single-cell RNA-seq batch correction. Nature methods, 16(1):43, 2019.
- Giesen et al. 2014 C. Giesen, H. A. O. Wang, D. Schapiro, N. Zivanovic, A. Jacobs, B. Hattendorf, P. J. Schüffler, D. Grolimund, J. M. Buhmann, S. Brandt, Z. Varga, P. J. Wild, D. Günther, and B. Bodenmiller. Highly multiplexed imaging of tumor tissues with subcellular resolution by mass cytometry. Nat. Methods, 11:417–422, Mar. 2014. doi: 10.1038/nmeth.2869.
- Lin et al. 2015 J.-R. Lin, M. Fallahi-Sichani, and P. K. Sorger. Highly multiplexed imaging of single cells using a high-throughput cyclic immunofluorescence method. Nature communications, 6:8390, 2015.
- Jagiella et al. 2017 N. Jagiella, D. Rickert, F. J. Theis, and J. Hasenauer. Parallelization and high-performance computing enables automated statistical inference of multi-scale models. Cell Systems, 4(2):194–206, Feb. 2017. doi: 10.1016/j.cels.2016.12.002.
- Klinger et al. 2018 E. Klinger, D. Rickert, and J. Hasenauer. pyABC: distributed, likelihood-free inference. Bioinformatics, 34(20):3591–3593, Oct. 2018. doi: 10.1093/bioinformatics/bty361.
- Yaffe 2019 M. B. Yaffe. Why geneticists stole cancer research even though cancer is primarily a signaling disease. Science Signaling, 12(565), 2019. ISSN 1945-0877. doi: 10.1126/scisignal.aaw3483.
- Pahlajani et al. 2011 C. D. Pahlajani, P. J. Atzberger, and M. Khammash. Stochastic reduction method for biological chemical kinetics using time-scale separation. J. Theor. Biol., 272(1):96–112, Mar. 2011. doi: 10.1016/j.jtbi.2010.11.023.
- Neu et al. 2017 K. E. Neu, Q. Tang, P. C. Wilson, and A. A. Khan. Single-cell genomics: Approaches and utility in immunology. Trends Immunol, 38(2):140–149, Feb. 2017. doi: 10.1016/j.it.2016.12.001.