Toughening in a nacre-like soft-hard layered structure due to weak nonlinearity in the soft layer
Abstract
Recently, it has been found experimentally that hydrated nacre exhibits a nonlinear mechanical response. While mechanical nonlinearity has been shown to be important in other biological structures, such as spider webs, the implications of mechanical nonlinearity in nacre have not been explored. Here, we show that the nonlinear mechanical response of nacre can be reproduced by an analytical model, which reflects a nacre-like layered structure, consisting of linear-elastic hard sheets glued together by weakly nonlinear-elastic soft sheets. We develop scaling analysis on this analytical model, and perform numerical simulations using a lattice model, which is a discrete counterpart of the analytical model. Unexpectedly, we find the weak nonlinearity in the soft component significantly contributes to enhancing toughness by redistributing the stress at a crack tip over a wider area. Beyond demonstrating a mechanism that explains the unusual properties of biological nacre, this study points to a general design principle for constructing tough composites using weak nonlinearity, and is useful as a guiding principle to develop artificial layered structures mimicking nacre.
I Introduction
Natural materials often exhibit remarkable hierarchical structures leading to outstanding mechanical characteristics GaoARMR10 ; Fratzl2007Review ; Gao2003PNAS ; OkumuraMRS2015 ; Hellmich2004Bone , as observed in bone, spider silk Vollrath2001NatureReview , and the exoskeletons of crustaceans Club2012ScienceA ; Lobster2010AM . Nacre, which is found in many seashells and protects shellfish from their environment, is composed of soft and hard layers, and has been studied as a prototype material for several decades Currey1977 ; JacksonVincentTurner ; Sarikaya . Researchers have been inspired by nacre’s remarkable structure to develop new materials that demonstrate excellent mechanical performance. KatoNacre2000AM ; Mayer2005Science ; Tomsia2008Science ; BioinspiredPolymerFilmScience2008 ; Science2007LayerPolymer ; bouville2014strong ; sakhavand2015universal .
There have been many studies discussing the mechanisms responsible for the toughness of nacre. Toughening mechanisms have been proposed based on a variety of experimental observations, such as (1) step-wise elongation Smith1999NatureNacre , (2) micro-cracking and crack bridging Kamat2000NatureNacre , (3) thin compressive layers Rao1999Science , (4) rough layer interfaces SuoEvansHuchinson , (5) mineral bridges SongBai2003 , and (6) wavy surface of the plates Barthelat2007JMPS . On the theoretical side, various approaches have been explored, including (1) elastic models Rao1999Science based on analytical solutions OkumuraPGG2001 ; Okumura2002nacre and on scaling arguments DeGennesOkumuraCR ; okumura2005JPCM , (2) viscoelastic models 2003parallel ; Okumura2002nacre , (3) micro-mechanical models Kotha2001Micromechanical , (4) numerical models including finite-element models Katti ; JiGao2004 ; Barthelat2007JMPS , (5) a fuse network model Nukala , and (6) a model with a periodic Young’s modulus fratzl2007periodic .
In general, materials start breaking from the tip of small cracks where stress is concentrated. Therefore, the reduction of the stress concentration at crack tips is key for material toughness Griffith ; Lawn ; Anderson . Using a simple linear model of nacre, and deriving an analytical expression of the stress and strain fields near a crack tip, we have shown that there is a significant reduction in stress near crack tips in nacre OkumuraPGG2001 ; Hamamoto2008PRE . This reduction in stress concentration was numerically confirmed using a simple network model Aoyanagi2009PRE , as well as finite-element calculations Hamamoto2013 . These numerical studies elucidated a physical picture for the mitigation of stress concentration, where enhanced elongation of soft layers effectively suppresses the deformation of the hard layer component, leading to a reduction in stress concentration. This suppression occurs effectively by the fact that the soft layers constitute only a small percentage of the bulk material, and thus stress in the bulk material is governed by the hard layers.
The mechanism of stress reduction above was established using linear models, but the importance of nonlinear response in biological materials has recently attracted greater interest. While we previously showed a simple linear model demonstrates the high mechanical adaptability of spider webs AoyanagiOkumura2010 , the nonlinear response of spider silk was shown to be a key factor in their mechanical superiority Buehler2012Nature . Previously, we have shown the mechanism of stress reduction in nacre using a linear model. Recently, it been shown experimentally that nacre also exhibits a nonlinear mechanical response NanoLett2004Nacre ; Barthelat2007JMPS ; Kakisawa2008Nacre , as spider silk does.
Here we construct a nonlinear model of a nacre-like structure that generalizes the linear model studied in Ref. OkumuraPGG2001 and reflects the recent experimental results in Ref. NanoLett2004Nacre ; Barthelat2007JMPS ; Kakisawa2008Nacre . Using this model, we perform simulations and derive scaling laws for a sample with a line crack. The numerical simulations, and scaling laws derived from this model show that the stress concentration near the crack tips is reduced significantly in the nonlinear case when the stress concentration is significant. The scaling laws demonstrate that toughness and strength are enhanced by a common factor that elucidates simple design principles for developing artificial materials mimicking nacre.
II Results
II.1 Scaling analysis of our model for nacre
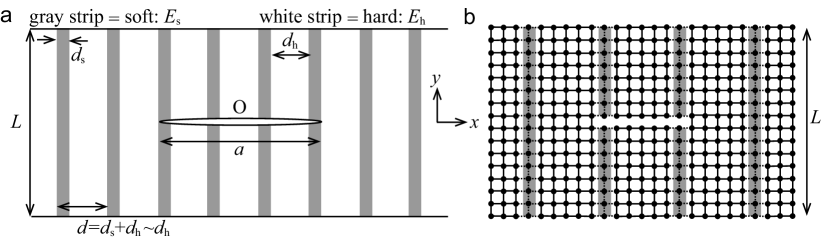
In our analytical model, hard and thick layers of thickness are glued together with soft and thin layers of thickness (), with a period
| (1) |
as illustrated in Fig. 1(a) (The corresponding lattice model for numerical simulation is illustrated in (b), which will be explained below in Sec. II.4.1). In our nonlinear model, the relation between the characteristic magnitude of stress and strain ( and ) are given by
| (2) |
Here, the nonlinear exponent ( or ) is positive, and the elastic modulus is denoted for the hard layers and for the soft layers.
As seen below, it is convenient to introduce a small parameter defined as
| (3) |
In our analytical model, we consider the small limit and we are not interested in the exact values but just the orders of magnitude of the physical quantities.
In the small limit, we show below that the dominant components of the stress and strain fields satisfy the following relations:
| (4) |
Here, note that the Young’s and shear moduli (e.g., of hard layers) are of the same order of magnitude () because they only differ by a numerical coefficient on the order of one. The continuum strain field is defined as for . Note that such continuum fields are valid in the present layered structure only on scales larger than the period . Equation (4) is a natural nonlinear extension of the linear relation obtained for the simple model of nacre discussed in Ref. OkumuraPGG2001 .
Now we derive Eq. (4) by considering the elemental modes of deformation appropriate for shear () and stretch () in the direction. When the composite is sheared in the direction, only the soft layers are stretched, and . From Eq. (2), this results in . In contrast, when the composite is stretched in the direction, both the soft and hard layers are stretched so the stress is dominated by the response from the hard layers, and . Here, we have not considered any slip or separation between the interfaces of the layers, because we are interested in deriving the critical condition for failure. The mutual sliding of hexagonal hard platelets observed experimentally in a study on the toughness of nacre NanoLett2004Nacre is regarded as a state that exists after the critical condition for failure is satisfied and is beyond the scope of our description.
We consider a composite governed by Eq. (4) with a crack running in the direction. The composite is stretched in the direction as shown in Fig. 1(a), where the plane strain or plane stress condition is satisfied (the sample is thick or thin in the direction). Thus, the dominant stress components are those pointing in the direction, or and . This is the reason we have considered only these components in the above.
As explained in the Appendix, we can derive the following scaling laws for the fracture toughness and strength of the composite in the presence of a large crack when is small:
| (5) | ||||
| (6) |
where the common enhancement factor is given by
| (7) |
Here, and are the fracture toughness (fracture surface energy) and strength of a brittle monolithic hard material, respectively, and is the size of the so-called Griffith cavity, as discussed below. These scaling laws can be viewed as natural nonlinear extensions of results obtained from an analytical solution in Ref. OkumuraPGG2001 (see Appendix).
II.2 Relevance of our analytical model to previous experiments
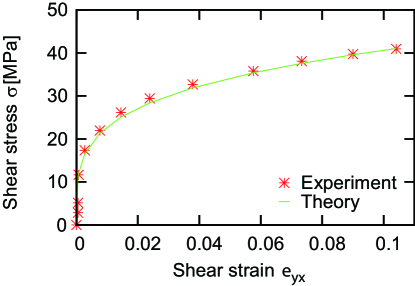
In this section, we show the relevance of our analytical model developed above to biological nacre by showing that Eq. (4) with appropriate parameters well reproduces previous experiments. Experimental studies have shown the tensile elastic response of the hard layers in nacre is linear with a modulus, typically around 65 GPa (before microscopic internal failure), as confirmed by nano-indentation NanoLett2004Nacre and tension tests Barthelat2007JMPS . This means that Eq. (4) with and GPa reproduces experiments well. Additionally, the shear response of the wet composite has recently been obtained Barthelat2007JMPS , and an experimental stress-strain curve is shown by the star symbols in Fig. 2. This curve can be reproduced at a semi-quantitative level by Eq. (4) with MPa and , as shown by the solid curve in Fig. 2. This means that, in biological nacre, the soft layer is weakly nonlinear with , and is significantly small with ( MPa and GPa result in ).
The estimates, GPa, MPa, and , imply that the soft layer is very soft with MPa. This is because the overall volume of the soft layer is typically 5 per cent, implying with typically 0.5 m, and the parameter set MPa, GPa, , and in Eq. (3) gives MPa. Note that, although the measurement of the force response of the soft component is difficult because of extremely small sample sizes of the soft component, it has been known that the soft component behaves like a soft gel Smith1999NatureNacre ; Kakisawa2008Nacre ; Meyers2008NacreSoft .
II.3 Physical implications of the scaling laws
Here, we discuss the rough orders of magnitude of important parameters in Eq. (7), to better understand its physical implications. The characteristic size of cavities in the hard layers, or the Griffith cavity , is about nm, comparable to the thickness of the soft layers , or . The cavities or defects in the hard layers may be created from protein molecules in the soft layers intruding into, and being trapped within, the mineral crystals during biomineralization process in nacre Gao2003PNAS . The fracture toughness is on the order of 10 J/m2, which leads to nm. In summary, typical values of the important factors in the common enhancement factor can be given as
| (9) |
Note that this parameter set means MPa at .
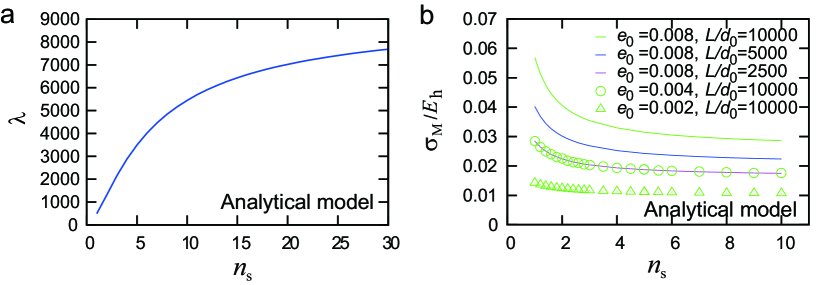
In Fig. 3(a), we show Eq. (7) with the parameter set in Eq. (9). The enhancement factor as a function of sharply rises up until and then tends to plateau. This implies that a relatively weak nonlinearity is sufficient for toughening. Note that in Fig. 3(a), the order of the toughness enhancement is predicted in the thousands, which is consistent with previous experiments JacksonVincentTurner .
The same physical conclusion can be obtained from Eq. (8) when the ratio and the remote strain are relatively large, where in the present case of . In Fig. 3(b), Eq. (8) is plotted at and for different values of and . Equation (8) represents the maximum stress at the crack tip, and is a measure of strength because a material is considered to be strong when the value of this quantity is small. As seen in Fig. 3(b), this quantity drops sharply up until and then it approaches a plateau when and are relatively large, which suggests that weak nonlinearity is sufficient for toughening. (The sharp drop in maximum stress is less pronounced when and are smaller, and this behavior is physically interpreted in the Discussion in terms of the degree of stress concentration.)
II.4 Numerical simulation
II.4.1 Lattice model
We performed numerical simulation using a nonlinear model extended from a linear two-dimensional network model of nacre studied in Ref. Aoyanagi2009PRE . The lattice model for this simulation is illustrated in Fig. 1(b). We consider a grid system in which nodal points are connected by springs that reflect the nonlinearity specified in Eq. (2). The values of and in our simulation are set as GPa and MPa, with , as in Eq. (9), and with and to mimic nacre. (See Appendix for further details).
To study the strength of the system against failure, we introduce a line crack in the direction in a stretched system, and quantify how the stress is concentrated around the crack tips for a fixed deformation at the top and bottom edges of the sample at mechanical equilibrium. The two crack tips are placed at soft layers. This is because the critical condition for failure on a scale larger than the layer period should be the condition whether a crack develops further when the crack tip is stopped at a soft layer. We calculate the positions of the beads when the elastic energy is minimized by the conjugate gradient method NumericalRecipes .
For a systematic comparison, we consider three models, (1) a nonlinear layered model which mimics natural nacre with and , (2) a linear layered model, which is different from the natural nonlinear model only in that is set to one, and (3) a monolithic model (), which is different from the linear model only in that the value of is raised to match that of . We set the remote strain to be in each simulation, which is one of the values of used in Fig. 3(b).
II.4.2 Stress distribution in the presence of a crack
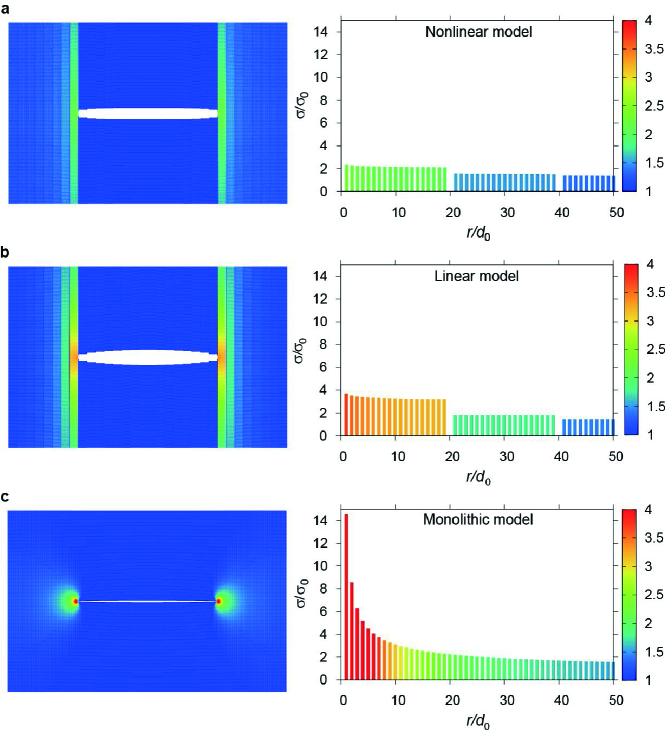
In Fig. 4(left), a comparison of the stress distribution around a line crack is given for the three models with a crack of the same size, where the maximum of the color scale (red) is set to the maximum stress that appears at the crack tips in the linear model. By comparing the three distribution maps on the left, we can clearly see the stress concentration near the crack tips is significantly reduced and delocalized in the layered cases (a and b), and reduced and delocalized most in the nonlinear case in (a).
To quantify the stress near the crack tips, we plot how the stress changes around one of the crack tips along the axis in Fig. 4(right) to more clearly see how the stress concentration is minimized in the nonlinear case. As expected, in all the three models, the maximum stress appears at the crack tip, or more precisely, at , where is the distance from the crack tip and is the mesh size of the network model. In the nonlinear model, the enhancement factor for the crack tip stress compared with the remote value is rather small, and is approximately . The enhancement factors for the linear model and the monolithic model are approximately and , respectively.
The enhancement of the stress at the crack tip significantly increases as we move from nonlinear to linear to monolithic models. This is in accord with the physical implications demonstrated in Fig. 3, that weak nonlinearity in the soft layer enhances the strength of the layered structure.
II.5 Consistency of our scaling analysis and numerical simulation
In this section, we demonstrate that the results of the numerical simulation semi-quantitatively agree with the scaling analysis. Note that the lattice model for numerical simulation should reduce to the analytical model in the continuum limit.
Equation (8) predicts the correct order of the maximum stress at the crack tip in the three numerical models in Fig. 4(right). The ratios of the maximum stress for nonlinear, linear composite and monolithic models are calculated as , respectively, from Eq. (8), while the corresponding ratios are given as from Fig. 4(right). This level of agreement is remarkable, considering that the assumptions made in the derivation of the scaling laws are only reasonably well satisfied in our simulation for numerical limitations (see Appendix for the details). In this way, we conclude that Eq. (8), and thus Eqs. (5) and (6), are consistent with and supported by the results of our numerical calculation in Fig. 4.
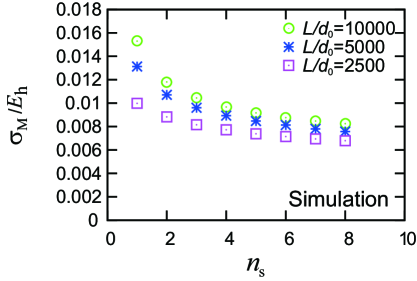
To further confirm semi-quantitative agreement between our simulation and scaling analysis, we plot the maximum stress that appears at a crack tip as a function of the nonlinear index in Fig. 5. The three curves in Fig. 5 may be compared with the three solid curves in Fig. 3(b), because they were obtained at the same strain and for the same three values of . As expected, the curves in each figure semi-qualitatively agree, further supporting the scaling analysis.
III Discussion
A crucial factor for toughening is stress concentration, and the degree of stress concentration is governed clearly by the remote stress and less clearly by the quantity . An increase in results in an increase in stress concentration. This is because the stress at a distance from the crack tip is given as for a non-linear system governed by the stress-strain relation , and the maximum stress that appears at the crack tip is given by a cutoff value for a system with a scale below which the continuum description breaks down aoyanagi2017 .
The fact that both and control the stress concentration is reflected in Eq. (8). Analytically, the functional dependences of Eq. (8) on and are very similar. In fact, as demonstrated numerically in Fig. 3(b), the initial drop in the maximum stress as a function of becomes significant as increases, and the same is true as increases.
This change with of the initial drop in the maximum stress with is physically understood from the fact that, if we simply plot and with larger than unity, the nonlinear stress () is smaller than the linear stress () when the strain is larger than unity (the nonlinear stress is larger when is smaller than unity). This suggests that nonlinearity in the soft layer contributes to stress reduction effectively when strain acting on soft layers near the crack tip is large. This happens even if the remote strain acting on the composite is considerably small. Note that the strain in soft layers is significantly larger than the strain in the soft-hard composite near a crack tip where shear deformation is dominant. Even if the remote strain acting on the composite is small, shear strain of soft layers near a crack tip can be large, as suggested in the paragraph below Eq. (4). (This significantly enhanced deformation in soft layers near a crack tip is demonstrated in previous numerical calculations Aoyanagi2009PRE ; Hamamoto2013 .) In summary, when the stress concentration is high, its reduction due to nonlinearity becomes greater.
The initial drop in the maximum stress as a function of is one advantage of weak nonlinearity, and this advantage is more effective as the stress concentration becomes higher, or as and/or increases. This behavior of the maximum stress was demonstrated in Fig. 3(b), and can physically understood as explained above.
Another advantage of weak nonlinearity is the increase in the enhancement of with an increase in . This is predicted from Eq. (7), as demonstrated in Fig. 3(a), and this expression is obtained in the limit of large , or in the case where the stress concentration is significant. This implies that if the stress concentration at a crack tip is low, this second advantage of weak nonlinearity predicted in Eq. (7) may be diminished. This is expected because stress-concentration reduction due to nonlinearity in soft layers (the first advantage) is more efficient when the stress concentration at a crack tip is high, and stress-concentration reduction and the enhancement factor should be positively correlated. In summary, the two advantages of weak nonlinearity, originating in Eqs. (7) and (8), are physically the same, and the strength of the advantages enhance as and increase, or stress concentration increases.
In the case of biological nacre, it has been reported that hard sheets tend to be separated into hexagonal tablets at a significantly low strain of around 0.001 Barthelat2007JMPS . If this is always the case, then the two advantages of weak nonlinearity may not be so significant in real, biological nacre. This is because as seen in Fig. 3(b) the first advantage of weak nonlinearity is visible at , and the two advantages tend to decrease as decreases (the curve for in Fig. 3(b) shows only a slight initial drop). Note that toughness and strength are governed by the strength of the two advantages at the critical state of failure when reaches the threshold strain for separation of tablets.
However, the value of around 0.001 reported in Barthelat2007JMPS is just one sample of nacre, and other natural specimens may vary. If other samples of nacre possess threshold strains which are fairly larger than 0.001, and their mechanical responses are explained by weak nonlinearity in the soft layers, then the weak nonlinearity could be interpreted as a mechanical optimization attained by biological nacre. This is because, if the threshold strain is fairly large, at the critical state of failure, the initial drop in the maximum stress at the crack tip as a function of is rather steep, and the maximum stress approaches to a plateau at a small , and thus weak nonlinearity is sufficient to obtain a high strength of the two advantages.
At any rate, since the present study demonstrates that the advantages of weak nonlinearity in the soft layer is pronounced for a reasonably small strain of 0.008, this mechanism could be useful for developing artificially tough layered structures mimicking nacre, where hard plates do not break into tablets. Note that reducing the strain below 0.008 in numerical simulation is technically difficult due to precision in calculations.
IV Conclusion
We demonstrated that in natural nacre the hard layers are linear and the soft layers are weakly nonlinear () on the basis of recent experimental results, and studied mechanical properties on the basis of nonlinear models reflecting this nonlinearity both analytically and numerically. The combination of numerical simulation and scaling arguments led to the following conclusions for a reasonably small strain: (1) a nonlinear model significantly contributes to reduce the stress concentration at a crack tip, compared with a linear model, and (2) a weak nonlinearity, as selected in biological nacre, is sufficient for this reduction.
We analytically derived the enhancement factor common to both the fracture strength and toughness. This factor, given in Eq. (7), shows that the mechanical superiority of nacre-like layered structures is controlled by the factors and , which are larger than one. These factors elucidate two design principles for the enhancement: (1) the soft-hard combination () and (2) the thin-thick combination with weak soft nonlinearity ( and ). These principles imply that the soft-hard combination, hierarchical structure, and nonlinearity are all important for developing tough structures mimicking nacre.
Acknowledgement
This research was partly supported by Grant-in-Aid for Scientific Research (A) (No. 24244066) of JSPS, Japan, and by ImPACT Program of Council for Science, Technology and Innovation (Cabinet Office, Government of Japan). We thank Professor Edward Foley (Ochanomizu University) for editing the manuscript.
Appendix
IV.1 Simulation
The simulation model is composed of grid points ( in the unit ), and the system size in the non-stretched state is 960, with and (). We introduced a line crack of size (whose width is ) with the tips located at soft layers. We stretched the system in the direction perpendicular to the line crack. The strain in our simulation is set to 0.008, which corresponds to the experimental value of tensile strain on nacre at failure Barthelat2007JMPS , with in the nonlinear and linear layered models, and in the monolithic model. Note that assumptions in the scaling theory, e.g., , is relaxed (or only marginally satisfied) in the simulation due to practical limitations on numerical calculation.
IV.2 Analytical model
The scaling structure of the elastic energy (per volume) can be given as
| (10) |
where the numerical coefficients of the both terms are set to one for simplicity. Equation (10) is obtained from the expression , together with Eq. (4).
Equation (10) is a natural nonlinear extension of the energy, first derived in Ref. OkumuraPGG2001 . On the basis of this expression, we develop scaling arguments to derive Eqs. (5), (6), and (8) in the text. These expressions can be viewed as a natural nonlinear extension of those obtained in Ref. OkumuraPGG2001 , and by setting in Eqs. (5), (6), and (8), we can reproduce the corresponding expressions obtained in Ref. OkumuraPGG2001 from an exact analytical solution in appropriate limits. The details of the derivation of the scaling laws are given below.
IV.2.1 Details of Derivation
To obtain the scaling laws for the nonlinear model of nacre, we consider a crack problem in a generic way. A crack of size is located along the axis in a plate whose size in the direction is characterized by (the sample size in the direction is comparable to ). This plate is in tension. The following derivation is inspired by the arguments in Ref. okumura2005fracture .
We consider two characteristic length scales, and , in the and directions. A scaling relation between and is given by balancing the two terms in the energy in Eq. (10):
| (11) |
The critical condition for fracture is that the elastic energy that is released as a result of the creation of a crack of size matches the fracture energy to create the crack:
| (12) |
Here, the fracture energy per area is denoted . Note that if Eq. (11) holds, the two terms in Eq. (10) are of the same order.
From Eqs. (11) and (12), we can express and in terms of , and from these expressions, we obtain the following expression for the component of the stress at the critical state of failure that scales as :
| (13) |
This is a generalized version of a nonlinear Griffith’s failure formula that was proposed theoretically in Ref. Aoyanagi2009JPSJ and confirmed experimentally in Ref.SoneMoriJSPS . If we set and in Eq. (13) we obtain a nonlinear Griffith’s formula for a monolithic hard material:
| (14) |
Here, we have set and (in fact, because the system is isotropic), where and () stand for the fracture energy and characteristic scale in the () direction for the monolithic hard material.
The nonlinear Griffith formula in Eq. (14) is a nonlinear version of the classic Griffith formula, and in the linear case (), Eq. (14) reduces to the well-known expressions for failure stress: for and for .
If we set in Eq. (14), we obtain the intrinsic failure stress of hard layers when there are no macroscopic cracks:
| (15) |
Here, is the typical size of defects in the layers that play the role of Griffith cavities.
The scaling structure for the singularity of the stress field at a crack tip should be given in the form,
| (16) |
where and are the characteristic size of the remote stress and the distance from the crack tip, respectively. The exponent can be determined by a principle that, at the critical state of failure [ is equal to in Eq. (13)], the field becomes independent of as we approach the singularity at () Okumura2004DNG . From this principle, we obtain the desired exponent,
| (17) |
and the singular field at the critical state of failure,
| (18) |
Note that this principle allows us to reproduce the well-known crack-tip singularity obtained by the Hutchinson, Rice and Rosengren (HRR) Hutchinson1968 ; RiceRosengren1968 , and if we set , , and , Eq. (16) reduces to the well-known expression of the HRR singularity: . This further reduces to the well-known singularity in the linear case (): .
The maximum force allowed at the crack tip is given by Eq. (16) at . This is expected because the continuum expression should be cut-off at this scale, and the continuum theory is valid only beyond length scales larger than the layer period . From this second principle, the maximum stress at the crack tip at the critical state of failure is given by Eq. (18) with .
In fact, this second principle is numerically confirmed in Refs. Nakagawa ; Aoyanagi2009JPSJ ; Takahashi2014 . The authors considered a line crack of size in a two dimensional nonlinear network system whose mesh size is , and showed that, as expected, the maximum stress always appears at the crack tips. Moreover, they showed that the maximum stress follows the scaling law in a clear way for the remote stress , whereas the well-known singularity near a crack tip at the distance is predicted in Refs. Hutchinson1968 ; RiceRosengren1968 .
The critical condition for failure is satisfied when this maximum stress matches in Eq. (15), and at the critical state, the tip stress reaches the intrinsic failure stress of hard layers. This matching condition leads to an expression of the fracture energy :
| (19) |
The enhancement factor for the fracture energy is given in the left-hand side.
Another scaling relation between and is obtained by considering the characteristic size of the remote stress and the remote strain . They satisfy the relationships
| (20) |
From Eqs. (11) and (20), we obtain a useful relation between and :
| (21) |
This implies that when and otherwise. This is because the natural characteristic length is if , but, if is not so larger than and if the length scale is cutoff by (i.e., if ), then should scale as , which means . In the case of the monolithic hard material, so that when and otherwise.
The enhancement factor for the fracture stress is obtained as
| (22) |
This can be obtained in the following three ways, which are physically the same: (I) Substitute Eq. (19) into Eq. (13). (II) Match Eq. (16) evaluated at with and interpret the remote stress in Eq. (16) as the fracture strength . (III) Calculate where is given by in Eq. (20) and identify as .
When the crack is large so that , we obtain Eq. (6) from Eq. (22). Equation (8) is obtained for such large cracks by setting and in Eq. (16), with using Eq. (20). While Eqs. (5) and (6) are valid only at the critical state of failure, Eq. (8) is valid as long as does not exceed the critical stress .
When the crack is small so that and , we obtain from Eq. (22):
| (23) |
For such small cracks, by setting and in Eq. (16), with using Eq. (20).
| (24) |
The large crack assumption may be satisfied in our numerical calculations. Note that for and , then so that holds if is slightly smaller (i.e., is of the order of unity) even if , which is the largest value we used in numerical calculation because . (If otherwise, would be -independent.)
References
- (1) B. Ji and H. Gao. Mechanical principles of biological nanocomposites. Ann. Rev. Mater. Res., 40:77–100, 2010.
- (2) P. Fratzl and R. Weinkamer. Nature’s hierarchical materials. Prog. Mater. Sci., 52(8):1263–1334, 2007.
- (3) H. Gao, B. Ji, I.L. Jäger, E. Arzt, and P. Fratzl. Materials become insensitive to flaws at nanoscale: lessons from nature. Proc. Nat. Acad. Sci. (U.S.A.), 100(10):5597, 2003.
- (4) Ko Okumura. Strength and toughness of biocomposites consisting of soft and hard elements: A few fundamental models. MRS Bulletin, 40(04):333–339, 2015.
- (5) Christian Hellmich, Jean-Francois Barthélémy, and Luc Dormieux. Mineral–collagen interactions in elasticity of bone ultrastructure–a continuum micromechanics approach. Eur. J. Mech. A, 23(5):783–810, 2004.
- (6) F. Vollrath and D.P. Knight. Liquid crystalline spinning of spider silk. Nature, 410(6828):541–548, 2001.
- (7) J.C. Weaver, G.W. Milliron, A. Miserez, K. Evans-Lutterodt, S. Herrera, I. Gallana, W.J. Mershon, B. Swanson, P. Zavattieri, E. DiMasi, and D. Kisailus. The stomatopod dactyl club: A formidable damage-tolerant biological hammer. Science, 336(6086):1275–1280, 2012.
- (8) S. Nikolov, M. Petrov, L. Lymperakis, M. Friák, C. Sachs, H.O. Fabritius, D. Raabe, and J. Neugebauer. Revealing the design principles of high-performance biological composites using ab initio and multiscale simulations: The example of lobster cuticle. Adv. Mater., 22(4):519–526, 2010.
- (9) JD Currey. Mechanical properties of mother of pearl in tension. Proc. Royal Soc. (London) B, 196(1125):443, 1977.
- (10) AP Jackson, JFV Vincent, and RM Turner. The mechanical design of nacre. Proc. Royal Soc. (London) B, 234(1277):415, 1988.
- (11) M. Sarikaya, J. Liu, and I.A. Aksay. Nacre: properties, crystallography, morphology, and formation. Biomimetics: Design and Processing of Materials, (AIP, New York), pages 35–90, 1995.
- (12) T. Kato. Polymer/calcium carbonate layered thin-film composites. Adv. Mater., 12(20):1543–1546, 2000.
- (13) G. Mayer. Rigid biological systems as models for synthetic composites. Science, 310(5751):1144, 2005.
- (14) E. Munch, M.E. Launey, D.H. Alsem, E. Saiz, A.P. Tomsia, and R.O. Ritchie. Tough, bio-inspired hybrid materials. Science, 322(5907):1516, 2008.
- (15) L.J. Bonderer, A.R. Studart, and L.J. Gauckler. Bioinspired design and assembly of platelet reinforced polymer films. Science, 319(5866):1069, 2008.
- (16) P. Podsiadlo, A.K. Kaushik, E.M. Arruda, A.M. Waas, B.S. Shim, J. Xu, H. Nandivada, B.G. Pumplin, J. Lahann, A. Ramamoorthy, et al. Ultrastrong and stiff layered polymer nanocomposites. Science, 318(5847):80, 2007.
- (17) Florian Bouville, Eric Maire, Sylvain Meille, Bertrand Van de Moortèle, Adam J Stevenson, and Sylvain Deville. Strong, tough and stiff bioinspired ceramics from brittle constituents. Nature materials, 13(5):508, 2014.
- (18) Navid Sakhavand and Rouzbeh Shahsavari. Universal composition–structure–property maps for natural and biomimetic platelet–matrix composites and stacked heterostructures. Nature communications, 6:6523, 2015.
- (19) B.L. Smith, T.E. Schäffer, M. Viani, J.B. Thompson, N.A. Frederick, J. Kindt, A. Belcher, G.D. Stucky, D.E. Morse, and P.K. Hansma. Molecular mechanistic origin of the toughness of natural adhesives, fibres and composites. Nature, 399(6738):761–763, 1999.
- (20) S. Kamat, X. Su, R. Ballarini, and AH Heuer. Structural basis for the fracture toughness of the shell of the conch strombus gigas. Nature, 405(6790):1036–1040, 2000.
- (21) Masaru Palakurthi Rao, AJ Sanchez-Herencia, GE Beltz, RM McMeeking, and FF Lange. Laminar ceramics that exhibit a threshold strength. Science, 286(5437):102–105, 1999.
- (22) AG Evans, Z. Suo, RZ Wang, IA Aksay, MY He, and JW Hutchinson. Model for the robust mechanical behavior of nacre. J. Mater. Res., 16(9):2476, 2001.
- (23) F. Song, AK Soh, and YL Bai. Structural and mechanical properties of the organic matrix layers of nacre. Biomaterials, 24(20):3623–3631, 2003.
- (24) F. Barthelat, H. Tang, PD Zavattieri, C.M. Li, and HD Espinosa. On the mechanics of mother-of-pearl: a key feature in the material hierarchical structure. J. Mech. Phys. Solids, 55(2):306–337, 2007.
- (25) K. Okumura and P.-G. de Gennes. Why is nacre strong? elastic theory and fracture mechanics for biocomposites with stratified structures. Eur. Phys. J. E, 4(1):121–127, 2001.
- (26) Ko Okumura. Why is nacre strong? ii. remaining mechanical weakness for cracks propagating along the sheets. Eur. Phys. J. E, 7(4):303–310, 2002.
- (27) P.-G. de Gennes and K. Okumura. On the toughness of biocomposites. Comp. Ren. Acad. Sci. IV, 1(2):257–261, 2000.
- (28) K. Okumura. Fracture strength of biomimetic composites: scaling views on nacre. J. Phys.: Cond. Matt., 17:S2879, 2005.
- (29) K. Okumura. Enhanced energy of parallel fractures in nacre-like composite materials. EPL (Europhysics Letters), 63:701, 2003.
- (30) SP Kotha, Y Li, and N Guzelsu. Micromechanical model of nacre tested in tension. J. Mater. Sci., 36(8):2001–2007, 2001.
- (31) DR Katti, KS Katti, JM Sopp, and M. Sarikaya. 3d finite element modeling of mechanical response in nacre-based hybrid nanocomposites. Comp. Theor. Polym. Sci., 11(5):397–404, 2001.
- (32) Baohua Ji and Huajian Gao. Mechanical properties of nanostructure of biological materials. J. Mech. Phys. Solid., 52(9):1963–1990, 2004.
- (33) P.K.V.V. Nukala, S. Zapperi, and S. Šimunović. Statistical properties of fracture in a random spring model. Phys. Rev. E, 71(6):066106, 2005.
- (34) P. Fratzl, H.S. Gupta, F.D. Fischer, and O. Kolednik. Hindered crack propagation in materials with periodically varying young’s modulus: lessons from biological materials. Adv. Mater., 19(18):2657–2661, 2007.
- (35) A. A. Griffith. Philos. Trans. R. Soc. London, Ser. A,, 221:163, 1920.
- (36) Brian Lawn. Fracture of Brittle Solids, 2nd ed. Cambridge Univ. Press, Cambridge, U.K., 1998.
- (37) T.L. Anderson. Fracture Mechanics 3rd ed. CRC Press, Boca Raton, Florida, 2005.
- (38) Y. Hamamoto and K. Okumura. Analytical solution to a fracture problem in a tough layered structure. Phys. Rev. E, 78(2):026118, 2008.
- (39) Y. Aoyanagi and K. Okumura. Stress and displacement around a crack in layered network systems mimicking nacre. Phys. Rev. E, 79(6):066108, 2009.
- (40) Y. Hamamoto and K. Okumura. Realistic numerical analysis of a bioinspired layered composite with a crack: robust scaling laws and crack arrest. Adv. Eng. Mater., 15:522–528, 2013.
- (41) Yuko Aoyanagi and Ko Okumura. Simple model for the mechanics of spider webs. Phys. Rev. Lett., 104(3):038102, Jan 2010.
- (42) S.W. Cranford, A. Tarakanova, N.M. Pugno, and M.J. Buehler. Nonlinear material behaviour of spider silk yields robust webs. Nature, 482(7383):72–76, 2012.
- (43) X. Li, W.C. Chang, Y.J. Chao, R. Wang, and M. Chang. Nanoscale structural and mechanical characterization of a natural nanocomposite material: the shell of red abalone. Nano Lett., 4(4):613–617, 2004.
- (44) T. Sumitomo, H. Kakisawa, Y. Owaki, and Y. Kagawa. In situ transmission electron microscopy observation of reversible deformation in nacre organic matrix. J. Mater. Res., 23(05):1466–1471, 2008.
- (45) M.A. Meyers, A.Y.M. Lin, P.Y. Chen, and J. Muyco. Mechanical strength of abalone nacre: role of the soft organic layer. J. Mech. Behavior Biomedical Mater., 1(1):76–85, 2008.
- (46) William H Press. Numerical Recipes in Fortran 77: The Art of Scientific Computing, volume 1. Cambridge University Press, Cambridge, 1992.
- (47) Yuko Aoyanagi and Ko Okumura. Stationary crack propagation in a two-dimensional visco-elastic network model. Polymer, 120:94–99, 2017.
- (48) KO Okumura. Fracture strength of biomimetic composites: scaling views on nacre. Journal of Physics: Condensed Matter, 17(31):S2879, 2005.
- (49) Y. Aoyanagi and K. Okumura. Crack-tip stress concentration and structure size in nonlinear structured materials. J. Phys. Soc. Jpn., 78(3):034402, 2009.
- (50) N. Soné, M. Mori, and K. Okumura. Scaling relation in fracture of the materials with elastoplastic response inaccessible by scaling laws. J. Phys. Soc. Jpn., 81(7):074604, 2012.
- (51) K. Okumura. Toughness of double elastic networks. EPL (Europhysics Letters), 67:470, 2004.
- (52) J.W. Hutchinson. Singular behaviour at the end of a tensile crack in a hardening material. J. Mech. Phys. Solids, 16(1):13–31, 1968.
- (53) J.R. Rice and G.F. Rosengren. Plane strain deformation near a crack tip in a power-law hardening material. J. Mech. Phys. Solids, 16(1):1–12, 1968.
- (54) S. Nakagawa and K. Okumura. Crack-tip stress concentration and mesh size in networks. J. Phys. Soc. Jpn., 76(11):4801, 2007.
- (55) Narumi Takahashi and Ko Okumura. Scaling crossover in crack-tip stresses and a robust scaling law for fracture strength. Journal of the Physical Society of Japan, 84(11):114602, 2015.