The Sejong Open cluster Survey (SOS) VI. A small star-forming region in the high Galactic latitude molecular cloud MBM 110
Abstract
We present optical photometric, spectroscopic data for the stars in the high Galactic latitude molecular cloud MBM 110. For the complete membership selection of MBM 110, we also analyze WISE mid-infrared data and Gaia astrometric data. Membership of individual stars is critically evaluated using the data mentioned above. The Gaia parallax of stars in MBM 110 is 2.667 0.095 mas (), which confirms that MBM 110 is a small star-forming region in the Orion-Eridanus superbubble. The age of MBM 110 is between 1.9 Myr and 3.1 Myr depending on the adopted pre-main sequence evolution model. The total stellar mass of MBM 110 is between 16 (members only) and 23 (including probable members). The star formation efficiency is estimated to be about 1.4%. We discuss the importance of such small star formation regions in the context of the global star formation rate and suggest that a galaxy’s star formation rate calculated from the H luminosity may underestimate the actual star formation rate. We also confirm a young brown dwarf member based on photometry, spectroscopy, and astrometry.
keywords:
stars: formation – stars: pre-main sequence – open clusters and associations: individual (MBM 110)1 Introduction
MBM 110, also known as L1634 (Lynds, 1962), is one of the high Galactic latitude molecular clouds discovered by Magnani et al. (1985), and is one of a dozen cometary clouds in the Orion-Eridanus superbubble (Bally, 2008). Star formation is ongoing in many of these clouds (Alcalá et al., 2008). Most investigators considered that the massive stars in the Orion OB association might have triggered star formation in these regions (Lee & Chen, 2007; Alcalá et al., 2008). MBM 110 is about to the west of the Orion Nebula, and is facing towards the Ori OB1 association. Maddalena et al. (1986) suggested that MBM 110 may be either remnants of the molecular cloud material from which the nearby OB association formed, or clouds pushed to their current location by pressure associated with energetic events accompanying the evolution of the OB association. Interestingly, MBM 110 does not have a conspicuous X-ray emitting young population (Sterzik et al., 1995).
Herbig-Haro objects, bipolar outflows and the red nebulous object, RNO 40 in L1634 have attracted several detailed studies (Bohigas et al., 1993; Beltrán et al., 2002; O’Connell et al., 2004). Beltrán et al. (2002) studied the embedded young stellar objects (YSOs) IRAS 05173-0555 and IRS 7 based on multicolour observations from centimeter to sub-millimeter wavelengths, and confirmed the Class 0 nature of IRAS 05173-0555. Several H emission stars are known from H surveys (Stephenson, 1986; Wiramihardja et al., 1991). However, a detailed study for the young star content or star formation history has not yet been performed.
In this, the sixth paper of the Sejong Open cluster Survey (SOS) project (Sung et al., 2013), we present photometric and spectroscopic data for the stars in the high Galactic latitude molecular cloud MBM 110. In Section 2, we describe the photometric, spectroscopic, and astrometric data for MBM 110. The membership of suspected members is assigned in the same section. The Hertzsprung-Russell diagram (HRD) for the members and probable members is constructed in Section 3. The mass and age of individual stars are determined in the HRD based on two popular pre-main sequence (PMS) evolution models. In addition, the star formation efficiency of MBM 110 is also determined in the section. The importance of small star-forming regions (SFRs) like MBM 110 is discussed in Section 4. The summary of this investigation is presented in Section 5.
| Telescope | Date of Obs. | detector | Filter & Exposure Time |
|---|---|---|---|
| SSO 1m | 2003. 10. 20 | WFI | B: 15s, 600s, V: 5s, 240s, R: 5s, 180s, H: 45s, 900s, I: 5s, 90s |
| 2003. 10. 23 | WFI | B: 7s, 60s, 1200s, V: 5s, 45s, 900s | |
| R: 5s, 45s, 900s, H: 30s, 120s, 600, I: 5s, 30s, 600s | |||
| Maidanak 1.5m | 2007. 1. 25 | SNUCam | U: 30s, 600s, B: 7s, 600s, V: 5s, 300s, R: 5s, 180s, I: 5s, 60s |
| 2007. 1. 26 | SNUCam | U: 30s, 600s, B: 7s, 600s, V: 5s, 300s, H: 30s, 600s, I: 5s, 60s | |
| Telescope | Date of Obs. | spectrograph | grating & spectral resolution |
| Lick 3m | 2004. 2. 13 | KAST | Blue: 600g/mm (/pix), Red: 830g/mm (/pix) |
| BOAO 1.8m | 2004. 11. 5 & 6 | BOLS | 1200g/mm (/pix @ H) |
| 2004. 11. 7 | BOLS | 1200g/mm (/pix @ H) | |
| 2010. 12. 11 | BOLS | 500g/mm (/pix @ H) | |
| 2011. 12. 12 & 13 | BOLS | 500g/mm (/pix @ H) | |
| SSO 2.3m | 2012. 11. 1–5 | WiFeS | Blue: 708g/mm, Red: 398g/mm (/pix) |
| 2012. 11. 12 – 13 | WiFeS | Blue: 708g/mm, Red: 398g/mm (/pix) |
2 Observations and membership selection
The number of near-infrared excess stars found in MBM 110 attracted an optical imaging study of the region. We performed optical photometry with the wide field imager (WFI) of the 1m telescope at Siding Spring Observatory (SSO) for a comprehensive study of YSOs in the region. In January 2007, we obtained additional optical images of the central region with the AZT-22 1.5m telescope at Maidanak Astronomical Observatory (MAO), Uzbekistan. Based on the photometry, we selected targets for spectroscopic observations - H emission stars and stars in the PMS locus. For a complete census of YSOs in MBM 110 we aimed to obtain medium resolution spectra for the stars with H emission as well as for stars in the PMS locus using several telescopes - Lick 3m telescope, Bohyun-san Optical Astronomy Observatory (BOAO) 1.8m telescope, and SSO 2.3m telescope. The log of observations is presented in Table 1.
As optical photometry cannot provide a complete census of YSOs with circumstellar disks, we downloaded WISE mid-infrared (MIR) data and searched for Class I and II YSOs in the region. In addition, as weak-line T Tauri stars (TTSs) may be missed in our H survey, we searched for MIR excess emission stars and obtained their optical spectra. We also searched for kinematic members using the Gaia Data Release 2 (DR2) astrometric data.
2.1 Optical Photometry
2.1.1 SSO 1m WFI Observations
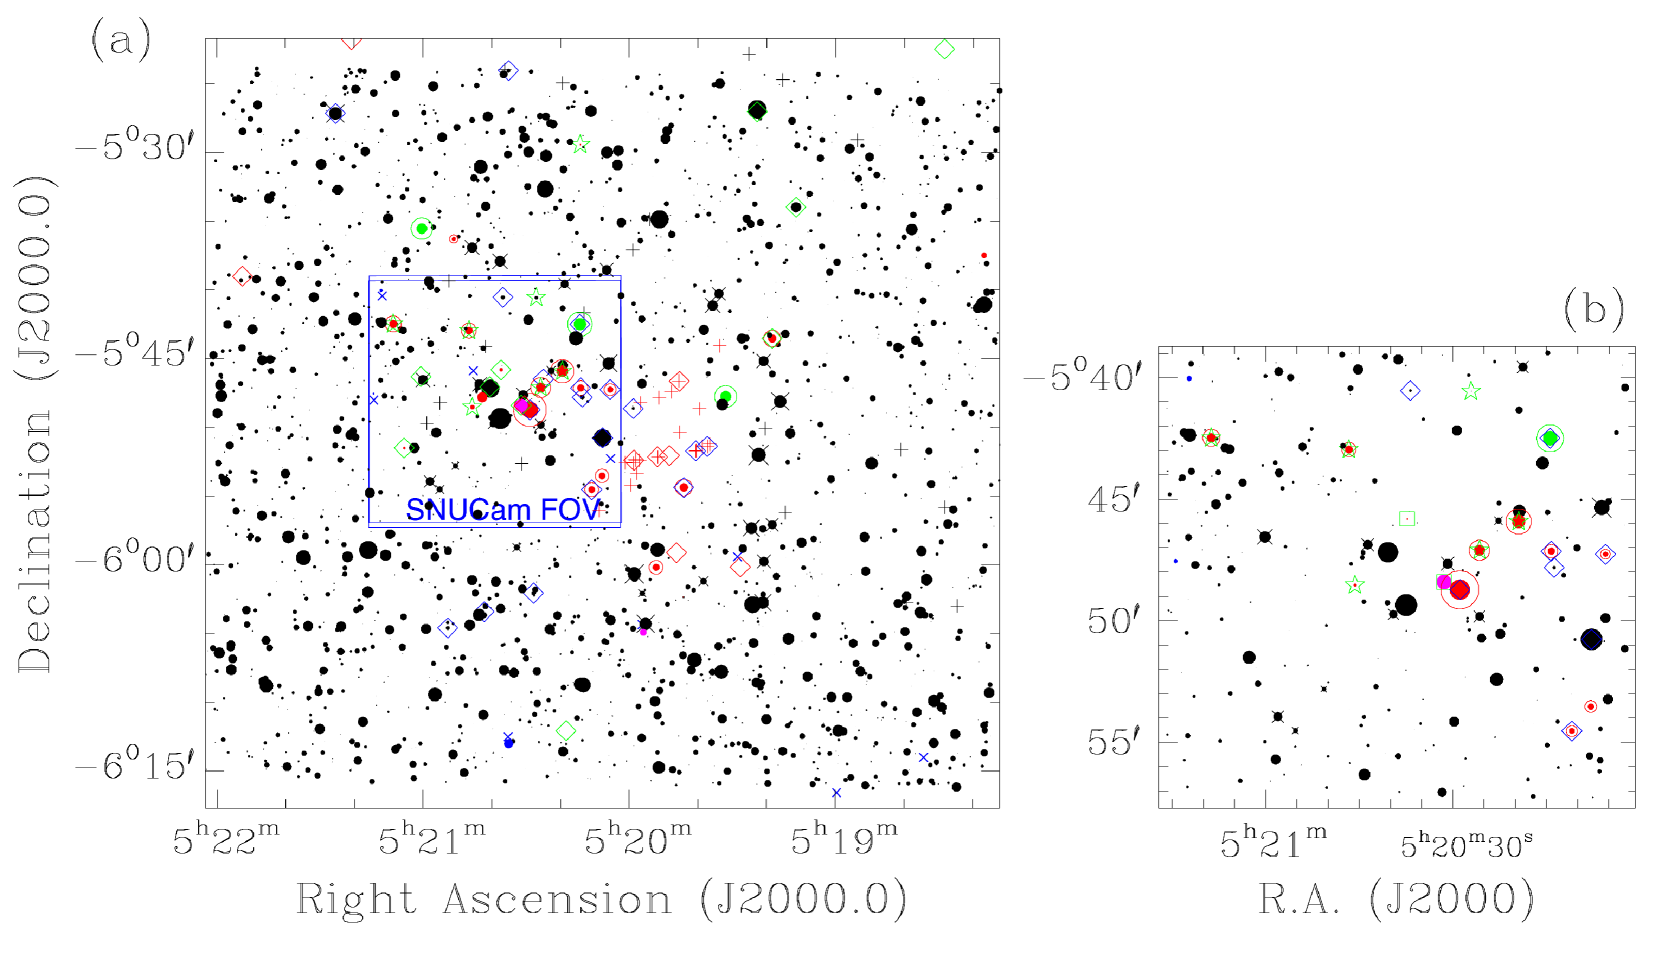
The observations were conducted on two nights on 2003 October 20 & 23 with the mosaic CCD camera WFI [field of view (FOV) ] of the 1m telescope at SSO. The exposure times and filters used in the observation are detailed in Table 1. All the preprocessing was carried out using the IRAF111Image Reduction and Analysis Facility is developed and distributed by the National Optical Astronomy Observatories, which is operated by the Association of Universities for Research in Astronomy under the cooperative agreement with the National Science Foundation./MSCRED package. Instrumental magnitudes were obtained using the IRAF version of DAOPHOT (Stetson, 1991) via point spread function (PSF) fitting. The atmospheric extinction coefficients and transformation coefficients used were those in Sung et al. (2008), but the photometric zero-points of magnitudes and colours were adjusted to those of the Maidanak 4k CCD data. Figure 1 (left) shows the finder chart based on the WFI observations. We also marked stellar or non-stellar X-ray emission objects, Herbig-Haro objects, and IR sources in the figure. The information on these sources was obtained from the astronomical database Simbad 222http://simbad.u-strasbg.fr/simbad/.
Photometric data for 10246 stars were obtained from the SSO WFI observations. The only saturated star in the field is HD 34909 (K0III, = 8.00). From the (, H) and (, H) two-colour diagrams (TCDs) we selected 13 H emission stars and 2 H emission candidates (see Table 5). However, 6 of 13 H emission stars and 1 of 2 H emission candidates were previously known H emission stars from other H surveys (Stephenson, 1986; Wiramihardja et al., 1991). The photometric data for 2052 stars brighter than = 17 mag are presented in Table 3 (Photometric data for fainter stars are available from H.S.). We do not present the colour-magnitude diagrams (CMDs) and TCDs from SSO WFI observations to avoid the repetition of similar figures. The main purpose of the SSO WFI observations was to find the H emission stars in MBM 110 as well as to isolate probable members with no appreciable H emission for the spectroscopic observations. For the target selection for spectroscopic observations, we identified the locus of H emission stars in the () CMD. The PMS locus for the spectroscopic observations was slightly wider than the two isochrones in Figure 2 (upper left).
2.1.2 MAO SNUCam Observations
For the detection of ultraviolet (UV) excess emission among TTSs in MBM 110, and H images for the central region were obtained on 2007 January 25 & 26 at MAO with the AZT-22 (1.5m) telescope (f/7.74) and a thinned Fairchild 486 CCD (SNUCam - Im et al. 2010). The exposure times and filters used in the observation are listed in Table 1. All the preprocessing required to remove the instrumental signature was done using the IRAF/CCDRED package. Instrumental magnitudes were obtained using IRAF/DAOPHOT via PSF fitting for the target images and via simple aperture photometry for standard stars. Details of the transformations to the standard system can be found in Lim et al. (2009). The atmospheric extinction coefficients and photometric zero-points derived from the standard star photometry are presented in Table 2. The finder chart based on MAO observations is shown in Figure 1 (right). Table 4 is the photometric data for 798 stars from the MAO observations.
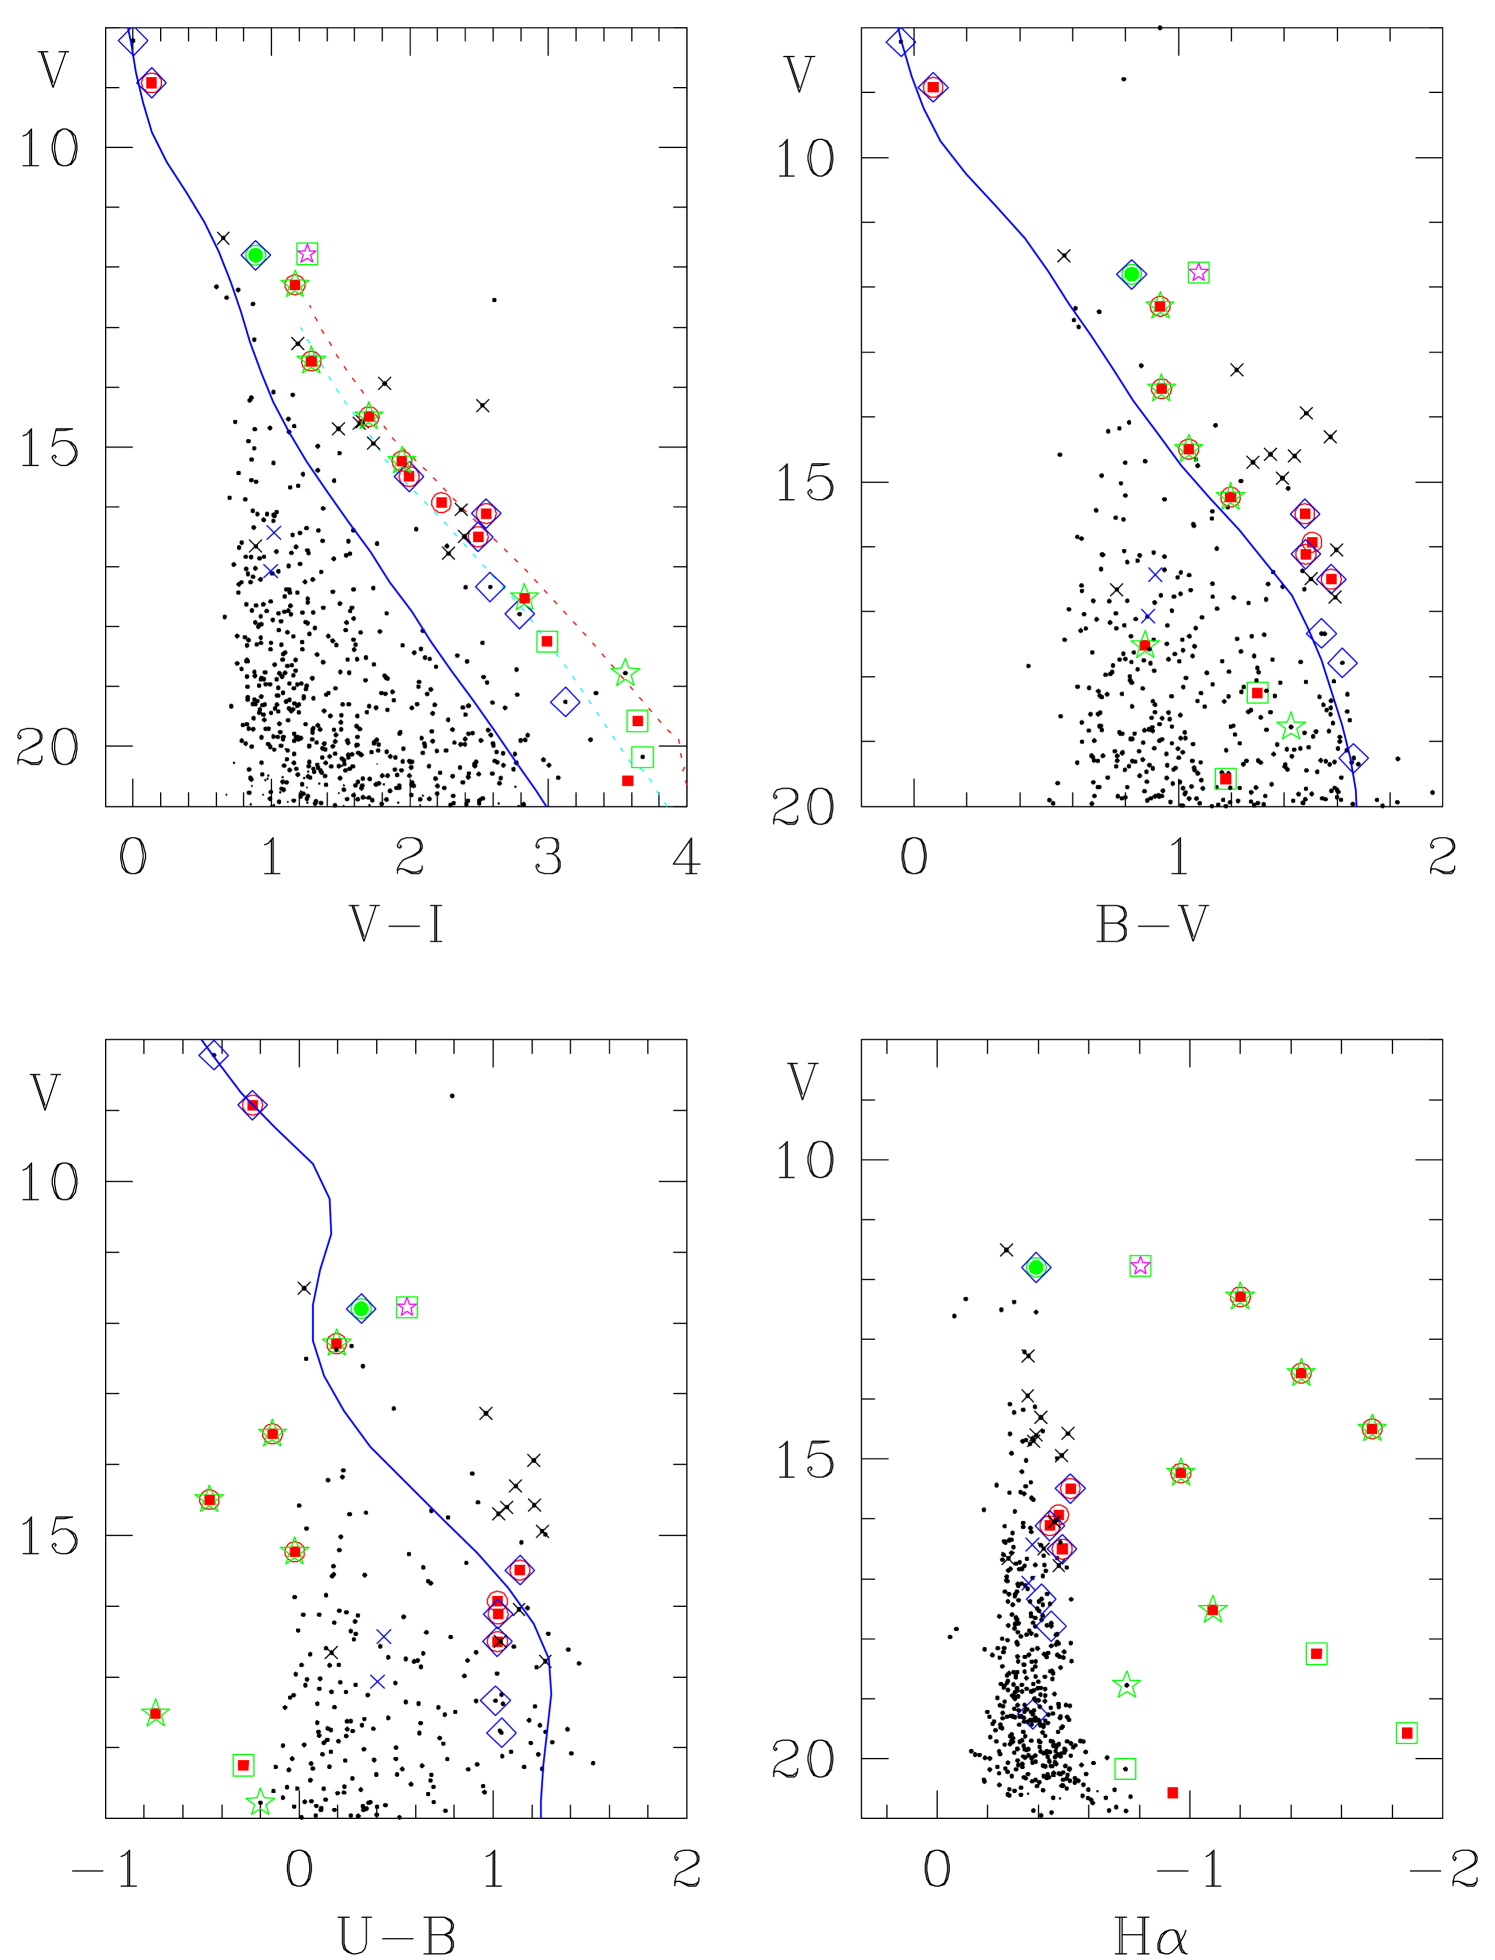
Figure 2 shows the CMDs from the MAO observations. In the () CMD young PMS stars (H emission stars, Class II stars and most of the proper motion members) are well aligned to the PMS isochrone (Baraffe et al. 2015, hereafter BHAC) of age 2 Myr (red) and 5 Myr (green). However, there are several non-member stars (black crosses) in or near the PMS locus. And two proper motion members are below the isochrone of age 5 Myr. In the () and () CMDs many PMS stars are bluer than the zero-age main sequence (ZAMS). However, in the () CMD, three bright members ( = 11.5 – 12.5 mag), four H emission stars and 5 proper motion members (three of them are H emission stars) are near the ZAMS. These stars are either PMS members with no appreciable mass accretion or non-members with strong chromospheric activity. The H index in Figure 2 (lower right) is defined in Sung et al. (2000).
| Date | Filter | ||||
|---|---|---|---|---|---|
| 0.028 0.001 | … | 23.199 0.013 | |||
| 23.201 0.013 | |||||
| 2007. | 0.076 0.004 | … | 23.593 0.014 | ||
| Jan. 25 | 0.121 0.006 | … | 23.642 0.011 | ||
| 23.641 0.009 | |||||
| 0.238 0.002 | 0.033 0.002 | 23.491 0.005 | |||
| 0.417 0.009 | 0.018 0.001 | 21.705 0.008 | |||
| 0.039 0.005 | … | 23.218 0.003 | |||
| 23.220 0.003 | |||||
| 2007. | H | 0.076 0.014 | … | 19.615 0.017 | |
| Jan. 26 | 0.131 0.003 | … | 23.665 0.004 | ||
| 23.660 0.003 | |||||
| 0.227 0.003 | 0.034 0.004 | 23.476 0.002 | |||
| 0.414 0.026 | 0.033 0.001 | 21.679 0.003 |
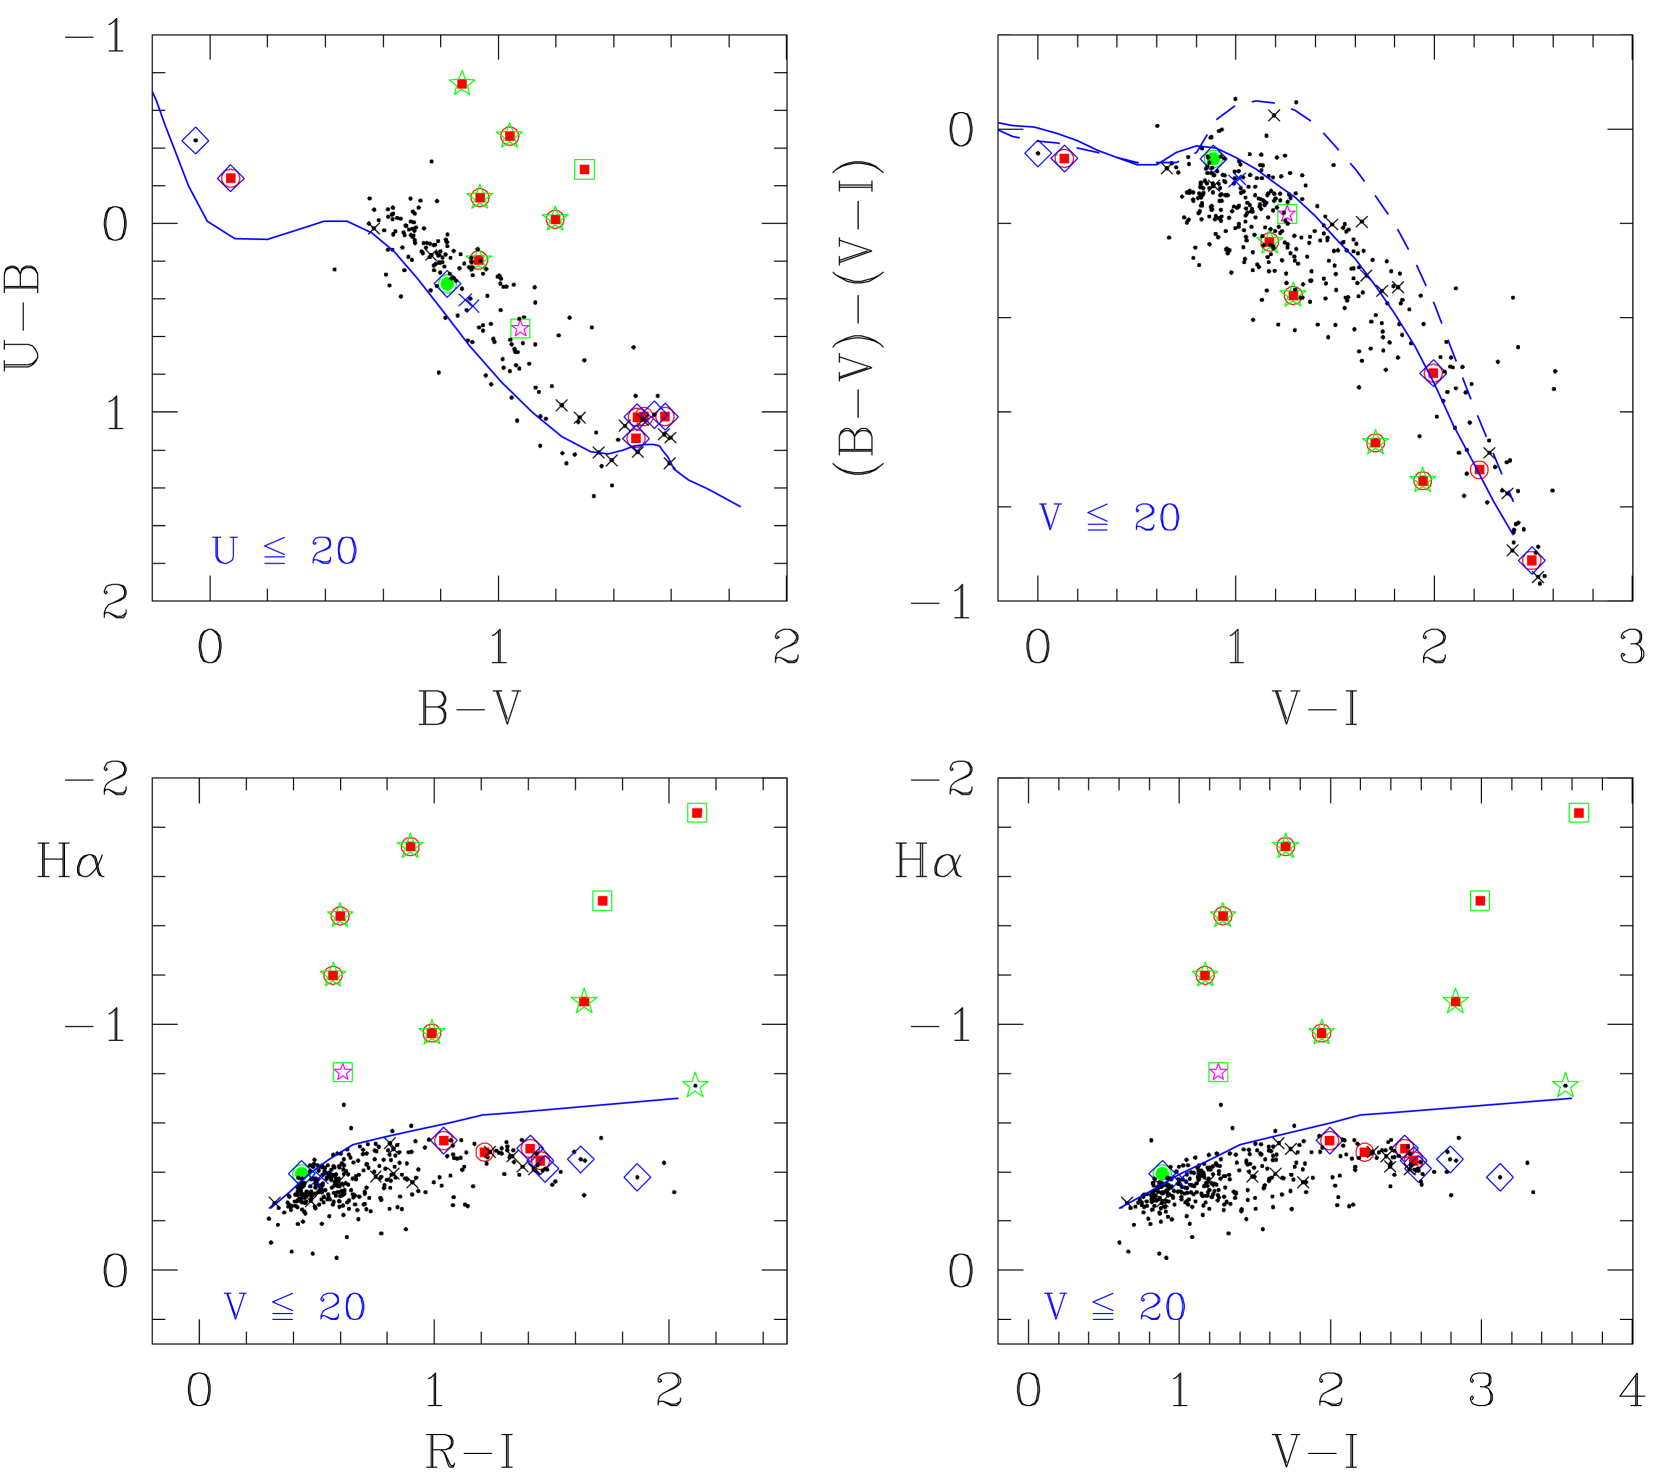
Figure 3 shows the TCDs from the MAO observations. The most massive star in the WFI FOV, HD 34835, is slightly reddened [ = 0.11]. The peculiar star HD 34890 (= HIP 24930) is a single line spectroscopic binary [see Figure 6 (left)] with an unseen companion, and so is not used in the reddening determination. We also determined the colour excesses in , , , and for HD 34385, and derived the total-to-selective extinction ratio using the colour-excess ratios (see Sung et al. 2013, 2017). Although the of HD 34385 is small and so the colour excess ratios may have large errors, the ’s from these ratios are consistent within 1.4 times of the standard deviation and give . The most prominent feature in the as well as the TCD is the strong and excess of 5 low-mass PMS members. However, as mentioned in the previous paragraph, 4 weak H emission stars do not show any appreciable UV excess. The lower panels in Figure 3 show the selection criteria for the H emission stars from H photometry. The selection of H emission stars from H photometry is limited to classical T Tauri stars (CTTSs) (see Table 5 or Figure 6 of Sung et al. 2008). From the TCDs we selected 8 H emission stars and 1 H emission candidate. There are 3 stars (black dots) between the H emission stars and the fiducial line. They were not selected as H emission stars
| ID | -H | Nobs | 2MASS IDa | Mb | Remark | |||||||||||||||
|---|---|---|---|---|---|---|---|---|---|---|---|---|---|---|---|---|---|---|---|---|
| WFI 1026 | 5:20:13.70 | -5:47:48.6 | 14.787 | 1.456 | 2.700 | 1.508 | -3.291 | 0.048 | 0.038 | 0.045 | 0.001 | 0.002 | 5 | 5 | 3 | 3 | 4 | 05201379-0547487 | PM member | |
| WFI 1027 | 5:20:13.78 | -6:11:15.6 | 16.152 | 0.429 | 0.879 | 0.797 | -3.301 | 0.001 | 0.000 | 0.002 | 0.006 | 0.011 | 5 | 5 | 5 | 3 | 3 | 05201374-0611160 | ||
| WFI 1028 | 5:20:13.92 | -5:45:53.2 | 16.405 | 1.401 | 2.626 | 1.550 | -3.229 | 0.018 | 0.045 | 0.072 | 0.092 | 0.025 | 5 | 3 | 3 | 2 | 2 | 05201403-0545533 | ||
| WFI 1029 | 5:20:14.03 | -6:05:20.8 | 14.111 | 0.393 | 0.786 | 0.719 | -3.383 | 0.001 | 0.014 | 0.021 | 0.007 | 0.011 | 5 | 5 | 5 | 5 | 5 | 05201400-0605213 | ||
| WFI 1030 | 5:20:14.14 | -5:47:08.4 | 13.444 | 0.990 | 1.997 | 1.482 | -3.280 | 0.010 | 0.029 | 0.072 | 0.005 | 0.001 | 5 | 5 | 5 | 4 | 5 | 05201423-0547085 | S | PM member |
| WFI 1031 | 5:20:14.26 | -6:08:41.1 | 10.736 | 0.359 | 0.813 | 0.855 | -3.327 | 0.002 | 0.015 | 0.018 | 0.007 | 0.002 | 4 | 3 | 3 | 3 | 3 | 05201422-0608416 | ||
| WFI 1032 | 5:20:14.28 | -5:29:26.0 | 16.282 | 1.978 | 3.570 | … | -2.817 | 0.007 | 0.002 | 0.027 | … | 0.000 | 5 | 3 | 2 | 0 | 2 | 05201430-0529259 | H | Class II, PM member |
| WFI 1033 | 5:20:14.36 | -5:42:30.2 | 10.899 | 0.425 | 0.863 | 0.792 | -3.293 | 0.018 | 0.002 | 0.001 | 0.001 | 0.006 | 3 | 3 | 3 | 3 | 3 | 05201443-0542301 | L | PM member |
| WFI 1034 | 5:20:14.66 | -5:32:48.4 | 16.232 | 0.625 | 1.234 | 1.124 | -3.292 | 0.017 | 0.018 | 0.007 | 0.001 | 0.007 | 5 | 5 | 4 | 2 | 3 | 05201468-0532485 | ||
| WFI 1035 | 5:20:14.73 | -5:38:09.3 | 15.659 | 0.553 | 1.048 | 0.848 | -3.348 | 0.004 | 0.017 | 0.014 | 0.006 | 0.007 | 5 | 5 | 5 | 3 | 4 | 05201474-0538092 | ||
∗ Table 3 is presented in its entirety in the electronic edition of the MNRAS. A portion is shown here for guidance regarding its form and content. Units of right ascension are hours, minutes, and seconds of time, and units of declination are degrees, arcminutes, and arcseconds.
a A, B, or b are added at the end of 2MASS ID if two or more stars are matched with a 2MASS source within a matching radius of 1′′. A or B: The bright or faint component of a 2MASS source whose magnitude difference is less than 1 mag. b: The faint component of a 2MASS source whose magnitude difference is greater than 1 mag.
b membership - S: H emission star confirmed from spectroscopy, X: X-ray emission star, H: H emission star, h: H emission candidate, +: X + H, -: X + h, n: star with no H emission from spectroscopy
| ID | -H | Nobs | 2MASS ID | WFI ID | Ma | |||||||||||||||||||
|---|---|---|---|---|---|---|---|---|---|---|---|---|---|---|---|---|---|---|---|---|---|---|---|---|
| M4k405 | 5:20:45.70 | -5:48:32.3 | 17.519 | 1.638 | 2.828 | 0.874 | -0.740 | -1.091 | 0.055 | 0.014 | 0.051 | 0.004 | 0.012 | 0.006 | 4 | 2 | 4 | 4 | 4 | 2 | 05204569-0548323 | 1314 | H, II, PM | |
| M4k406 | 5:20:45.83 | -5:48:55.5 | 20.261 | 0.614 | 1.273 | 1.125 | … | … | 0.079 | 0.079 | 0.097 | 0.065 | … | … | 2 | 1 | 2 | 2 | 0 | 0 | 8682 | |||
| M4k407 | 5:20:45.89 | -5:52:57.6 | 21.726 | … | 2.147 | … | … | … | 0.164 | … | 0.184 | … | … | … | 1 | 0 | 1 | 0 | 0 | 0 | ||||
| M4k408 | 5:20:46.22 | -5:50:00.5 | 20.868 | 1.300 | 2.526 | … | … | -0.381 | 0.015 | 0.045 | 0.032 | … | … | 0.164 | 2 | 1 | 2 | 0 | 0 | 1 | 05204621-0550004 | 8691 | ||
| M4k409 | 5:20:46.27 | -5:39:01.7 | 18.577 | 0.409 | 0.819 | 0.696 | -0.010 | … | 0.001 | 0.007 | 0.005 | 0.014 | 0.040 | … | 2 | 2 | 2 | 1 | 1 | 0 | 8693 | |||
| M4k410 | 5:20:46.33 | -5:47:39.6 | 17.212 | 0.663 | 1.298 | 0.958 | 0.241 | -0.268 | 0.014 | 0.015 | 0.000 | 0.014 | 0.006 | 0.015 | 4 | 2 | 4 | 4 | 3 | 2 | 05204632-0547397 | 1320 | ||
| M4k411 | 5:20:46.43 | -5:40:26.7 | 16.132 | 0.512 | 1.015 | 0.853 | 0.303 | -0.340 | 0.001 | 0.010 | 0.003 | 0.009 | 0.015 | 0.017 | 4 | 2 | 4 | 4 | 4 | 2 | 05204641-0540267 | 1322 | ||
| M4k412 | 5:20:46.47 | -5:40:41.0 | 18.549 | 0.576 | 1.080 | 0.911 | 0.233 | -0.346 | 0.005 | 0.011 | 0.003 | 0.012 | 0.076 | 0.039 | 4 | 2 | 4 | 2 | 2 | 1 | 05204648-0540409 | 8700 | ||
| M4k413 | 5:20:46.56 | -5:55:51.9 | 18.120 | 0.615 | 1.275 | 1.129 | 1.047 | -0.451 | 0.004 | 0.022 | 0.005 | 0.006 | 0.082 | 0.010 | 4 | 2 | 4 | 3 | 2 | 2 | 05204655-0555519 | 1325 | ||
| M4k414 | 5:20:46.60 | -5:53:38.3 | 18.933 | 1.480 | 2.557 | 1.610 | … | -0.409 | 0.003 | 0.016 | 0.009 | 0.008 | … | 0.024 | 3 | 2 | 3 | 2 | 0 | 1 | 05204659-0553382 | 1326 | PM | |
| M4k415 | 5:20:46.68 | -5:42:57.7 | 15.234 | 0.990 | 1.942 | 1.197 | -0.023 | -0.964 | 0.046 | 0.013 | 0.035 | 0.017 | 0.031 | 0.015 | 4 | 2 | 4 | 4 | 4 | 2 | 05204667-0542577 | 1327 | H, II, PM | -35.4, -32.4 |
∗ Table 4 is presented in its entirety in the electronic edition of the MNRAS.
A portion is shown here for guidance regarding its form and content. Units of right ascension are
hours, minutes, and seconds of time, and units of declination are degrees, arcminutes, and arcseconds.
amembership - X: X-ray emission star, x: X-ray emission candidate, H: H emission star, h: H emission candidate, +: X + H, -: X + h , II: YSO Class II object, PM: proper motion member
because they are all very faint () and the errors of their H index are about 0.1 mag.
2.2 Spectroscopy
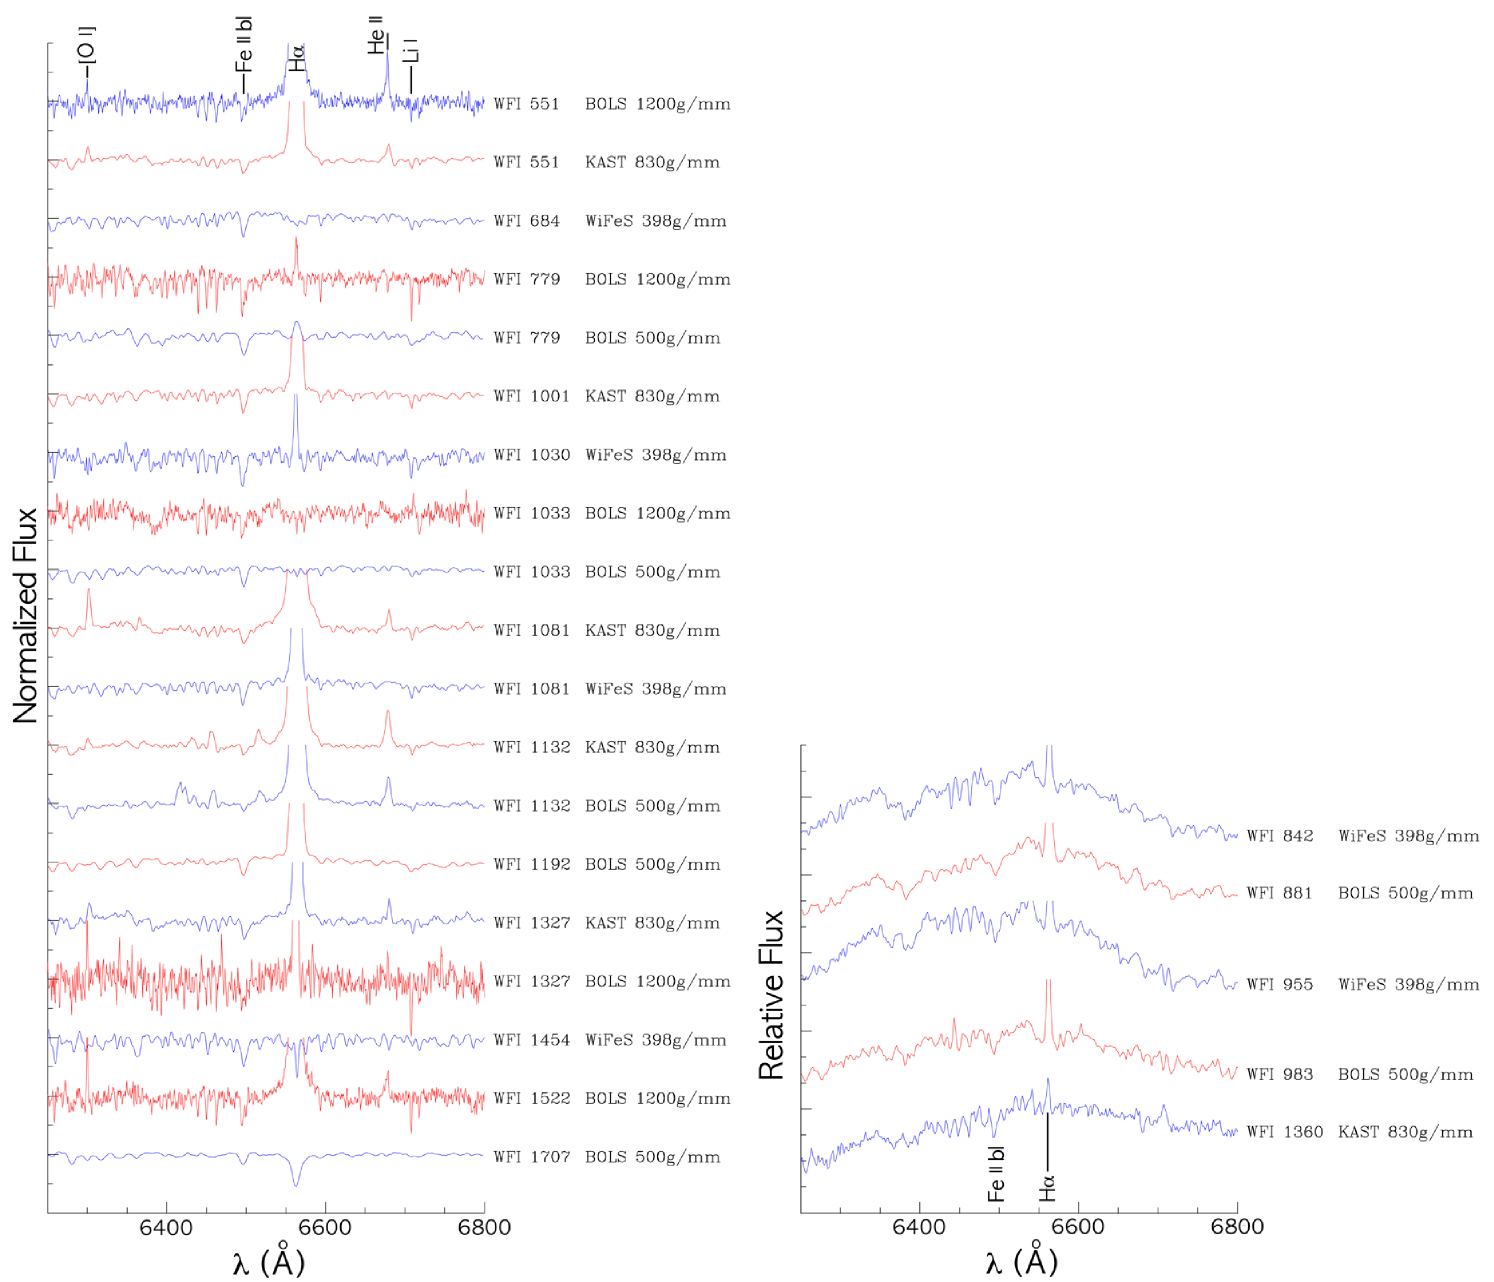
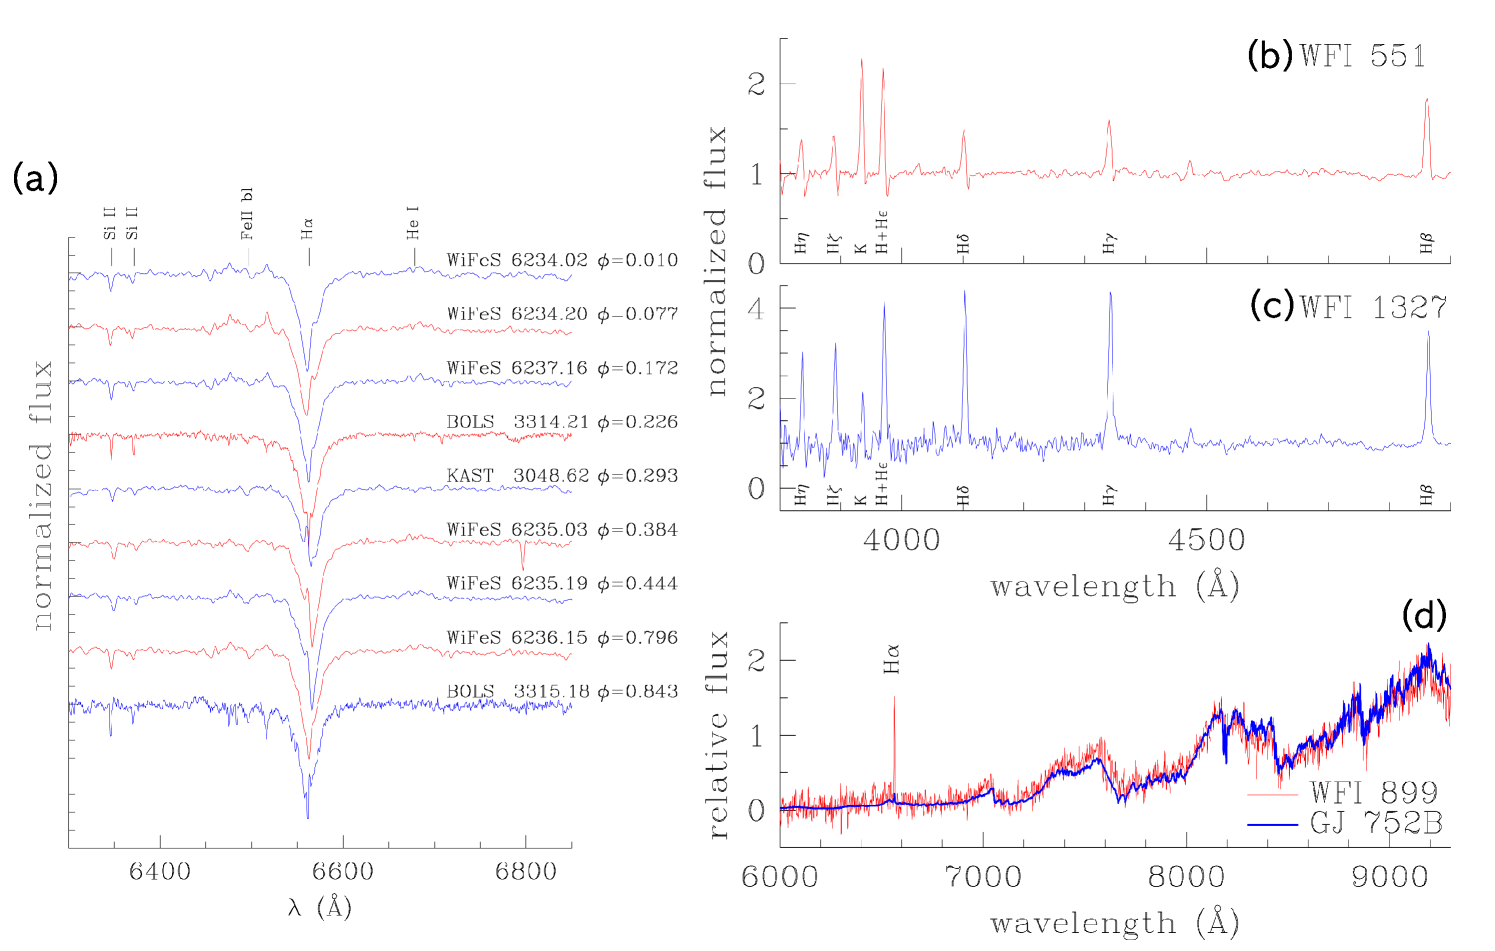
As H photometry can only detect stars with strong H emission (, i.e. CTTS - Sung et al. 2008) and we detected only a dozen H emission stars from the SSO WFI observations, we decided to conduct spectroscopic observations for a complete census of PMS stars in MBM 110. On 2004 February 12, we obtained the spectra for 12 stars including HD 34835 and HD 34890 with the dual beam spectrograph KAST of the Lick 3m Shane Reflector. We confirm H emission in 6 stars (WFI 551, 1001, 1081, 1132, 1327 & 1360 - see Figure 4). On 2004 November 5 – 8, we observed stars in the PMS locus using the long slit mode of BOES (BOLS) (grating: 1200g/mm). H emission and Li I absorption are confirmed for WFI 551, 779, 1327, and 1522. However, although the H line of WFI 1033 is in absorption, Li I absorption is relatively strong. WFI 1132 shows a strong emission at H ().
For the efficient detection of faint H emission stars, we used the 500g/mm grating of the BOLS in 2010 December and 2011 December observing runs. H emission was found in WFI 779, 881, and 1192 among the 6 stars observed in the 2010 December run and in WFI 1132 among 8 stars observed in the 2011 December run. Among 7 stars without H emission in the 2011 December run, WFI 1033 showed an appreciable absorption in Li I . In 2012 November we observed 22 stars in the PMS locus with the integral field spectrograph WiFeS of the SSO 2.3m telescope, and confirmed H emission for 5 stars (WFI 842, 899, 955, 1030 & 1081). Two stars (WFI 684 & 1454) showed Li I absorption. The spectra around H and Li I are shown in Figure 4. We could not detect any appreciable H emission and Li I absorption for 33 stars. These stars are marked “n” in the 20th column in Table 3 and in the 24th column of Table 4.

At the estimated age of MBM 110 (see section 3.2), we do not expect any M-stars to have significantly depleted Li. Furthermore, the Li feature is a highly saturated spectral feature such that a visible sign of depleted Li requires more than 90% depletion in M-type stars. Therefore, true MBM 110 M-type members are expected to show a strong (i.e. nearly undepleted) Li feature. Figure 5 shows the equivalent width of Li () as a function of . For comparison, the data for the young open cluster NGC 2264 (age: about 3 Myr - Sung & Bessell 2010) from Lim et al. (2016) are plotted in the figure. The variation in Li absorption strength is most pronounced for M-type stars and is, therefore, a good age indicator for young stars. The Li strength is slightly weaker than that of stars in the young open cluster NGC 2264, and is very similar to that of young stars in the Cha ( = 0.4 – 0.6 for M0 – M3 stars) (Zuckerman & Song, 2004).
HD 34835 has the earliest type B5III/IV (Simbad) in the observed field. The source of the spectral type is Houk & Swift 1999. The spectrum of this star was obtained twice - once at Lick and once at BOAO. The line ratio between He I and Mg II indicates a spectral type of B6. The line ratio between He I and He I also supports this. In addition, the strength of C II relative to the Balmer lines and the He I lines is comparable to that of spectral type B5 – B7. We classify the spectral type of this star as B6.
The spectral type of HD 34890 was A0pec initially, but is currently B9IV/V in Simbad. This star is a single line spectroscopic binary with an unseen companion. More detailed spectroscopic characteristics of this star will be presented in a forthcoming paper. The H line of HD 34890 [see Figure 6 (a)] shows an emission component within a strong absorption line. Both line centre and strength vary with time. The period of variation is about 2.705 days. In the spectrum of HD 34890, He I lines are weak, but definitely seen, indicating a late-B type star. The He I and Mg II ratio is about 1/2, which indicates a spectral type of B8 – B9. He I is very weak or absent, and Ca II is invisible. These features imply that HD 34890 is a B9 star. The spectral type of HD 34890 is adopted as B9.
WFI 1081 is a known H emission star (StH 37). The spectrum of this star was obtained twice - once at Lick and once at SSO. In the Lick/KAST spectrum all Balmer lines are very strong []. Ca II H & K lines show strong emission, but are weaker than the Balmer lines. [O I] , He I 5876, 6678 & 7065 are in emission. However, in the SSO/WiFeS spectra, the Ca II H & K lines are stronger than most Balmer lines except H. We could not find any emission at [O I] and He I . He I 5876 & 7065 lines are in emission, but weaker that those of the Lick/KAST spectra. In addition, the Ca II IR triplet ( 8498, 8542, & 8662) shows strong emission.
WFI 551 is a known H emission star (Kiso A-0975 47). H emission is detected in both H photometry and spectroscopy. The spectrum of the star was obtained twice (once with Lick/KAST, the other with BOLS/g1200). The equivalent width of H shows a large variation ( at Lick and at BOAO). In addition, He I 5875, 6678, 7065, and [O I] also show emission. Interestingly, all Balmer lines (H, H, H, H, and H) and Ca II K in the blue show inverse P-Cygni profiles [see the upper panel of Figure 6 (b)], indicating WFI 551 is a PMS star with active mass accretion. The Li absorption strength (two connected points at in Figure 5) is weaker than that of young stars in NGC 2264, and is caused by a veiling effect due to strong mass accretion. WISE MIR colours also indicate the existence of a circumstellar disk around the star (Class II). Its Gaia proper motion also indicates the membership of the star. However, the parallax is larger than that of MBM 110 members.
WFI 1327 is an H emission star, Kiso A-0975 57. The H emission of this star is confirmed from MAO observations as well as spectroscopic observations at Lick and BOAO. However, H from SSO WFI observation is not pronounced. The spectrum of WFI 1327 shows strong emission in the Balmer lines. Interestingly, the strength of H and H are stronger than H in the Lick/KAST spectrum [see Figure 6 (b) (middle)]. Many He I and [O I] lines show emission. The Li absorption strength also showed a large difference between the two observations as seen in Figure 5 (two connected points at ).
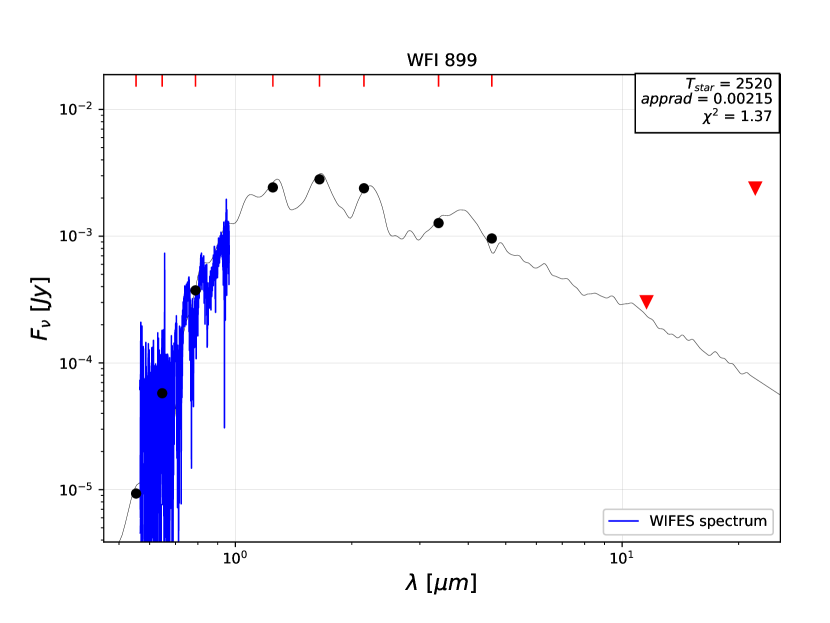
WFI 899 is one of the faintest stars in the PMS locus and is suspected to be a young brown dwarf. The spectrum of WFI 899 was obtained on 2012 November 4 with WiFeS at SSO. H emission is well pronounced. However, although the absorption of Li is suspected, it cannot be confirmed due to the weak signal. The spectrum is shown in the lower panel of Figure 6 (b). The spectrum is compared with the well-known M8V GJ 752B (=VB 10). The two spectra are quite similar, but there are some features that are weaker (Na I, K I, and CaH) indicating that WFI 899 has a lower gravity than GJ 752B. WFI 899 is the only confirmed young brown dwarf in MBM 110. The emission of H with a higher resolution spectrum (R = 7000) was confirmed on 2012 November 24. Although the errors are somewhat large, Gaia DR2 parallax as well as proper motions support the membership of WFI 899.
WFI 1132 is a well-known CTTS (V534 Ori, StH 38). The spectra of the star were obtained three times (Lick/KAST, BOLS/g1200 @H, & BOLS/g500). H emission is very strong [W(H) ]. H is also very strong, but is weaker than the Ca II K line. He I 4026, 4388, 4472, 4922, 5016, 5876, 6678, & 7065 and [O I] are in emission. The H emission line obtained with the BOLS/g1200 shows a double peak (or weak self-absorption) profile. The Li absorption strength (two connected points at in Figure 5) is weaker than that of young stars in NGC 2264, and is caused by a veiling effect due to strong mass accretion.
2.3 Gaia Astrometric Data
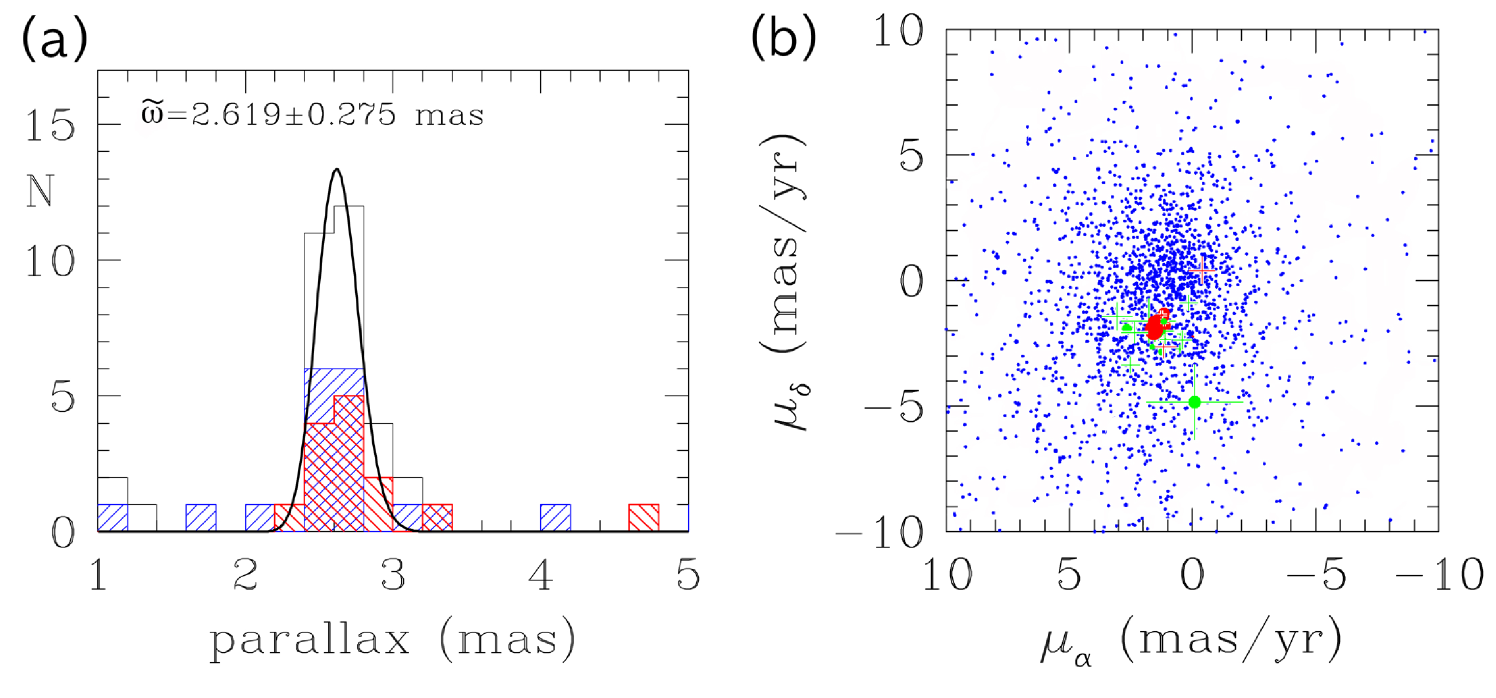
Recently, the astrometric satellite Gaia of the European Space Agency released 5-dimensional data for about 1.7 billion sources. MBM 110 is a loose SFR with a dozen known member stars and only one early-type member in the MS band, so for the distance determination and for the selection of members not detected from H photometry or MIR excess emission, we downloaded Gaia DR2 data from VizieR333http://vizier.u-strasbg.fr for FOV centred on the A0pec star HD 34890. To determine the distance of MBM 110, we checked the distribution of parallaxes of probable member stars. Figure 7 (a) shows parallax distribution of spectroscopically confirmed members (blue histogram - H emission and Li I absorption), that of Class II YSOs (red histogram), and all probable members. Although the parallaxes of probable member stars spread over a large range, many are concentrated between 2.4 mas and 2.8 mas. We tried fitting the histogram with a Gaussian function, and found that the parallax of probable members of MBM 110 is 2.619 0.275 mas (equivalently ). And the median and the robust scatter estimate [RSE - see the footnote 4 of Lindegren et al. (2018) for the definition of RSE] are 2.614 mas and 0.095 mas (), respectively.
The member stars selected from the optical study are distributed over in diameter, which is equivalent to about . This value is consistent with the expanded size due to a random internal velocity dispersion of about for about 4 Myr (see section 3.2). However, the radial scale from Gaia DR2 data appeared to be large probably due to the uncertainty in the current Gaia DR2 parallaxes. The distance to MBM 110 is very similar to the recent distance of the Orion Nebula Cluster ( = 2.530 0.001 mas, ) from the 6-dimensional analysis (Kounkel et al., 2018).
As members of star clusters or stellar groups formed from a single cloud, they share common kinematic properties inherited from their natal cloud. Proper motions and radial velocities should, therefore, be good membership criteria. We checked the proper motion of stars in the FOV and that of member stars. Unfortunately, most stars in the FOV and the member stars occupy nearly the same region in the proper motion plane [see Figure 7 (b)]. This fact implies that proper motion is not a good membership selection criterion for MBM 110. The proper motion of definite members (red dots with error bar) and of probable members (green dots with error bar) is also shown in the figure. As can be seen in the figure, the proper motion error of probable members and one member is much larger than that of most member stars.
In the Gaia DR2 astrometry paper, Lindegren et al. (2018) identifies a global zero-point shift of 0.029mas. In addition, the zero-point residual varies from region to region on small and large scales (see Fig. 12 – 15 of Lindegren et al. 2018). To check the zero-point near MBM 110, we downloaded the astrometric data for quasar candidates within 1 degree from HD 34890. There are 36 AllWISE AGN sources (Secrest et al., 2015) and 1 prototype ICRF3 VLBI source. Among them, 3 objects have only two-parameter solutions. The median value and RSE of the parallaxes are -0.053 mas and 0.438 mas, respectively. The uncertainty (= RSE / ) of astrometric zero point shift is 0.072 mas. In addition, the maximum and minimum of the parallaxes are 0.801 mas and -0.893 mas, respectively. If we take into account the local zero-point shift of the Gaia parallax, the real parallax of MBM 110 is 2.667 0.095 mas (equivalently 375 13 pc). However, the total error of the parallax will be 0.448 mas if we take into account the RSE of the zero-point. This result indicates that the random error of the Gaia DR2 parallaxes could be large, and therefore the Gaia DR2 parallax of MBM 110 candidates may not be a decisive membership criterion.
Lindegren et al. (2018) mentioned that a five-parameter solution is accepted only if at least six visibility periods (“visibility_periods_used” in the Gaia archive) are used. The number of visibility periods of the MBM 110 candidate members is between 10 and 12, which implies that the stars in MBM 110 are well observed during the Gaia nominal observation. Another quantity of checking the quality of data derived from a multivariate data analysis is the reduced of the fit. Lindegren (2018) used the square-root of the value as the unit weight error (UWE). The UWE of good data is about 1. However, the UWE distribution of the Gaia DR2 parallax is a function of brightness as well as colour of the objects. Lindegren (2018) provided a method of re-normalization and relevant tables. We calculated the RUWE (re-normalized unit weight error) of candidate members of MBM 110. Among the stars in Table 5, 5 stars (WFI 496, 684, 1192, 9545, and 9818) have larger RUWEs [RUWE - see Lindegren (2018) for the value]. These stars have a large error in the parallax, and hence are classified as probable members even though their parallaxes are far different from those of member stars.
2.4 WISE Mid-Infrared Data and Final Decision
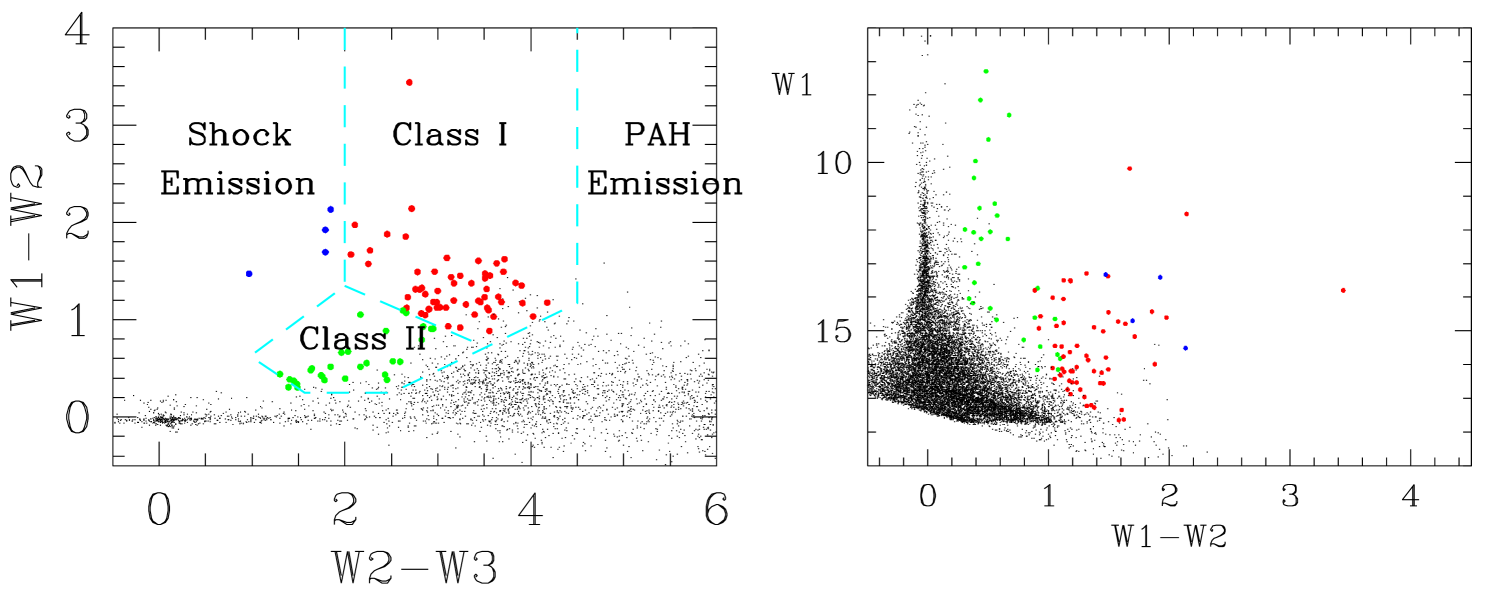
For a comprehensive study of this SFR we have downloaded MIR WISE data from VizieR. The YSO classification scheme in the WISE TCD of Fischer et al. (2016) was adopted. In the WFI FOV, the number of Class I, Class II, Shock emission object, and PAH emission objects is 51, 26, 4, and 0, respectively. As can be seen in the right panel of Figure 8, the photometric errors increase rapidly for fainter objects (). And so, if we limit the classification to the bright objects (), the number is reduced to 22, 19, 3, and 0, respectively. Among them, 1 Class I (WFI 9545), 13 Class II (see Table 5), and 1 Shock emission (WFI 6309) objects have optical counterparts. Most Class I YSOs are concentrated in the western part of the cloud, where many Herbig-Haro objects can be found [see Figure 1 (left)].
For the selection of members of MBM 110, we should take into account the photometric data, spectroscopic
characteristics, WISE MIR information, parallax, and proper motions. The first criterion for the membership
is parallax. From Figure 7(a) we restrict our attention to the stars between = 2.40 – 2.84 mas,
which covers most of the stars in the peak. And then we consider the other four criteria - proper motion vector,
H emission from photometry, strong Li I absorption and/or H emission
in the spectrum, and MIR excess emission from WISE data. If a star meets at least two criteria from among
the 4 membership criteria, we classify the star as a member of MBM 110.
If a star meets two or more membership criteria mentioned above, but the parallax of a star is smaller or larger
than the range mentioned above we consider this star as a probable member of MBM 110. If a star meets the
membership criteria based on astrometry alone (parallax and proper motion) we consider the star as a possible
member of MBM 110. We cannot exclude the possibility that some young stars are in the foreground or background
of MBM 110, which is the member of the Orion OB1a association or the Orion-Eridanus superbubble.
| WFI | other name | SSO | MAO | W(H) | W(Li) | SpT | WISE | (mas) | RUWEb | Memb | Remark | |
|---|---|---|---|---|---|---|---|---|---|---|---|---|
| 43 | Kiso A-0975 43 | … | … | … | … | … | - | 3.035 | N | 1.29 | N | OEBMc |
| 496 | … | … | … | … | … | Class II | 4.685 | Y | 2.00 | P | large error in | |
| 551 | Kiso A-0975 47 | H | … | -63.4, -107.5 | 0.24 | K3 | Class II | 3.268 0.025 | Y | 1.16 | N | OEBM |
| 684 | N | … | 0.23 | 0.30 | K0 | - | 1.694 | Y | 8.10 | P | large error in | |
| 779 | N | … | -0.86, -1.30 | 0.57 0.03 | K2 | - | 2.550 | Y | 1.00 | Y | ||
| 782 | H | … | … | … | … | - | 1.347 | N | 1.30 | N | close double | |
| 842 | N | … | -4.83 | 0.06 | M2 | - | 6.442 | N | 1.25 | N | foreground star | |
| 881 | N | … | -4.58 | no abs | M2 | - | 4.160 | N | 1.09 | N | foreground star | |
| 899 | N | … | -79.2 | … | M8 | 2.674 | Y | 1.01 | Y | young BD member | ||
| 904 | N | … | … | … | … | - | 2.491 | Y | 0.95 | P | ||
| 955 | N | N | -4.91 | 0.78 | M3 | - | 2.471 | Y | 1.05 | Y | ||
| 981 | HD 34835 | N | … | 6.58 | … | B6 | - | 2.578 | Y | 0.98 | Y | B5III/IV |
| 983 | N | N | -5.37 | 0.57 | M2 | - | 3.095 | N | 1.11 | P | OEBM | |
| 1001 | N | N | -18.3, -4.85 | 0.36 0.02 | G9/M3 | - | 2.624 | Y | 1.37 | Y | ||
| 1026 | N | N | … | … | … | - | 2.490 | Y | 1.03 | P | ||
| 1030 | N | N | -3.84 | 0.39 | K2 | - | 2.584 | Y | 1.02 | Y | ||
| 1032 | H | … | … | … | … | Class II | 2.770 | Y | 1.11 | Y | ||
| 1033 | N | N | +0.72, +0.18 | 0.29, 0.18 | G5 | - | 2.620 | Y | 1.09 | Y | ||
| 1081 | StH 37 | H | H | -166.8, -37.4 | 0.36 0.01 | K1/5 | Class II | 2.493 | Y | 1.14 | Y | |
| 1129 | N | N | … | … | … | - | 2.693 | Y | 1.31 | P | ||
| 1132 | StH 38 | H | H | -109.2, -91.3 | 0.28, 0.14 | K4 | Class II | 2.614 | Y | 1.21 | Y | W(H) = -31.4 |
| 1153 | N | N | … | … | … | Class II | 2.712 | Y | 0.99 | Y | ||
| 1161 | N | … | … | … | … | - | 2.528 | Y | 1.01 | P | ||
| 1170 | HD 34890 | N | … | 5.53 | … | B9 | - | 2.751 | Y | 1.01 | Y | SB1 |
| 1192 | StH 39 | h | H | -20.3 | 0.44 | K1 | Class II | -0.640 | N | 51.13 | P | large error in and |
| 1218 | N | … | … | … | … | - | 2.834 | Y | 1.00 | P | ||
| 1235 | N | N | … | … | … | - | 2.814 | Y | 1.00 | P | ||
| 1240 | H | H | … | … | … | Class II | 2.962 | N | 0.90 | P | ||
| 1276 | N | … | … | … | … | - | 2.621 | Y | 0.98 | P | ||
| 1283 | N | h | … | … | … | - | 3.183 | Y | 1.00 | P | OEBM | |
| 1314 | Kiso A-0975 56 | (H) | H | … | … | … | Class II | 2.579 | Y | 1.11 | Y | |
| 1327 | Kiso A-0975 57 | H | H | -40.8, -30.4 | 0.38, 0.90 | K7 | Class II | 2.577 | Y | 1.15 | Y | H & H: stronger than H |
| 1360 | H | … | -1.34 | no abs | K7 | - | 2.086 | N | 1.14 | N | ||
| 1372 | N | … | … | … | … | - | 2.737 | Y | 1.09 | P | ||
| 1454 | N | … | +0.89 | 0.21 | M1 | - | 0.180 | N | 0.98 | P | large error in | |
| 1459 | N | N | … | … | … | Class II | 2.877 | Y | 1.03 | Y | ||
| 1488 | H | H | … | … | … | Class II | 2.311 | N | 1.24 | P | OEBM | |
| 1522 | Kiso A-0975 59 | H | H | -92.1 | 0.45 | K1 | Class II | 2.528 | Y | 1.06 | Y | |
| 1707 | 1RXS J052125.6 | N | … | +2.58 | +0.05 | … | - | 2.751 | Y | 1.09 | Y | |
| 5897 | H | … | … | … | … | - | 0.091 | N | 1.11 | N | large error in and | |
| 6309 | H | … | … | … | … | Class II | … | … | … | P | no data in Gaia DR2 | |
| 9545 | … | … | … | Class II | … | … | 4.23 | P | no data in Gaia DR2 | |||
| 9818 | h | … | … | … | … | - | 1.543 | Y | 1.85 | N | large error in and |
a: membership from proper motion, bRUWE: renomalized unit weight error, cOEBM: Orion-Eridanus bubble member?
3 PHYSICAL PROPERTIES
3.1 Adopted Parameters and Calibrations
The mass and age of a star can be derived from the HRD with the help of stellar evolution models and PMS evolution tracks. Various parameters and calibrations need to be adopted for the construction of the HRD. The first parameters are those related to the reddening correction. HD 34385 is the only star which can be used to determine the reddening and . = 0.11 and = 3.42 are adopted and applied to all member stars. The reddening in other colours is determined using the relations between and colour excess ratio adopted in Sung et al. (2013). The distance of MBM 110 is based on Gaia DR2 parallaxes corrected for the local zero-point shift from local WISE AGN samples - = 2.667 0.095 mas ().
We shortly describe the calibrations most relevant to this work. As most member stars in MBM 110 are low-mass stars, the temperature and bolometric correction (BC) scales for low-mass stars used here should be described. Although the surface gravity of low-mass PMS stars is intermediate between giants and MS, their photometric characteristics, especially in passbands are very similar to MS stars (Lyo et al., 2004). We use the temperature and BC scales of Pecaut & Mamajek (2013) (hereafter PM13) for MS stars. Their colour-temperature relations are consistent with the theoretical colour-temperature relations of BHAC of age 1 Gyr. The difference in from (), (), (), (), and () between PM13 and the 1 Gyr isochrone of BHAC is , , , , and , respectively. And the difference between PM13 and the 5 Myr isochrone of BHAC is slightly larger, and is , , , , and for (), (), (), (), and (), respectively. We obtained the effective temperature and BC from PM13 using (), (), (), (), (), and (). However, as could be affected by UV excess, by H emission, and by IR excess, we applied different weights for different colors - weight = 0.0 for (), 0.5 for () and (), and 1.0 for the others. We adopted the colour-temperature relations for MS stars, but the stars in MBM 110 are young stars. We should check the reliability of the adopted calibrations. Although PM13 published the colour-temperature relations for the stars with age 5 – 30 Myr, their stars may be affected by UV excess due to mass accretion, the uncertainty in reddening correction, the existence of circumstellar disks, etc. And therefore, it is better to check the reliability using the theoretical relations of BHAC. The temperature from colours differs by , , , , and in logarithmic scale for (), (), (), (), and (), respectively. And the average difference in BC at a given temperature is only . And therefore we can conclude that the adotpted relations do not cause a serious problem in temperature and BC estimates. or magnitude is used in the calculation of .
The classical T Tau stars () in the observed FOV (WFI 551, 1081, 1132, 1314, 1327, & 1522) showed variabilities in magnitudes and colours. We calculated the effective temperatures, BC’s, masses and ages using the individual data, and the average values were used in the HRD and initial mass function (IMF) calculation.
3.2 Age and Mass
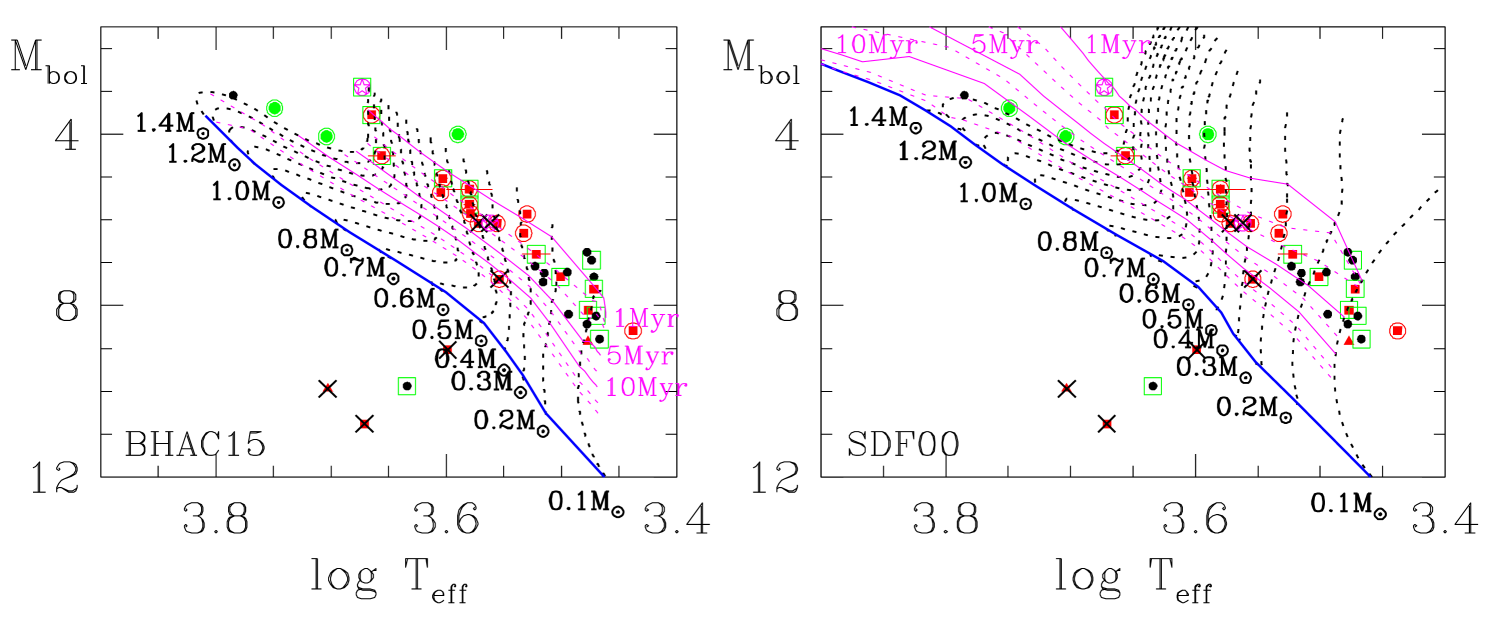
The HRD of MBM 110 is presented in Figure 9. We added error bars for 6 classical T Tau stars due to variability. Most low-mass young stars in MBM 110 locate between the isochrone of age 1 Myr and 5 Myr. However, several massive stars () seem to have older ages, which is a well-known feature of PMS evolution models (Sung et al., 1997, 2004). The mean age of 9 low-mass PMS members ( = 1.0 – 0.1 ) is 1.9 ( 0.9) Myr from the PMS evolution models by BHAC and 3.1 ( 1.2) Myr from Siess et al. (2000) (hereafter SDF).
The mass of individual stars can be determined in the HRD by interpolating the evolutionary tracks. Two evolutionary models give very similar masses for a given star. The mass scale for member stars between two PMS models is
Because of the mass coverage, as well as consistency with our previous studies, we use the masses from SDF models. The most massive star in MBM 110 (WFI 981 = HD 34835) is just about . And the total stellar mass of MBM 110 is about 16.1 for member stars and 23.1 including probable members.
The effective temperature and of the young brown dwarf member WFI 899 is 2740K and +8.59 mag, respectively. The star is redder and brighter than the 0.5 Myr isochrone of BHAC, and its mass is estimated to be about 46 . The spectral energy distribution (SED) of WFI 899 is shown in Figure 10. The SED fitting results give 2520K and the apparent radius = 2.15 mas. The radius (at 385 pc) is too large as a young brown dwarf. The calculated luminosity is too bright and it corresponds to about object. If WFI 899 is a foreground young brown dwarf at about 120 pc, then , which corresponds to a brown dwarf. The discrepancy between temperature and luminosity is also disentangled. However, the distance from Gaia DR2 is consistent with that of MBM 110. This discrepancy may be resolved in future data releases from the Gaia astrometric mission.
If the Gaia parallax of WFI 551 is correct, the star is a young star in the foreground, and therefore a member of the Orion-Eridanus superbubble. In addition, if WFI 551 is a low-mass foreground PMS star, it is 0.48 mag fainter than the members of MBM 110 in Figure 9, and its age is about 5 Myr from SDF or 3.5 Myr from BHAC. However, it is very difficult to accept that active accretion persists for 5 Myr and although the possibility of it being a PMS star with a nearly edge-on disk cannot be ruled out, it is very difficult to explain the inverse P-Cyg profile of the star.
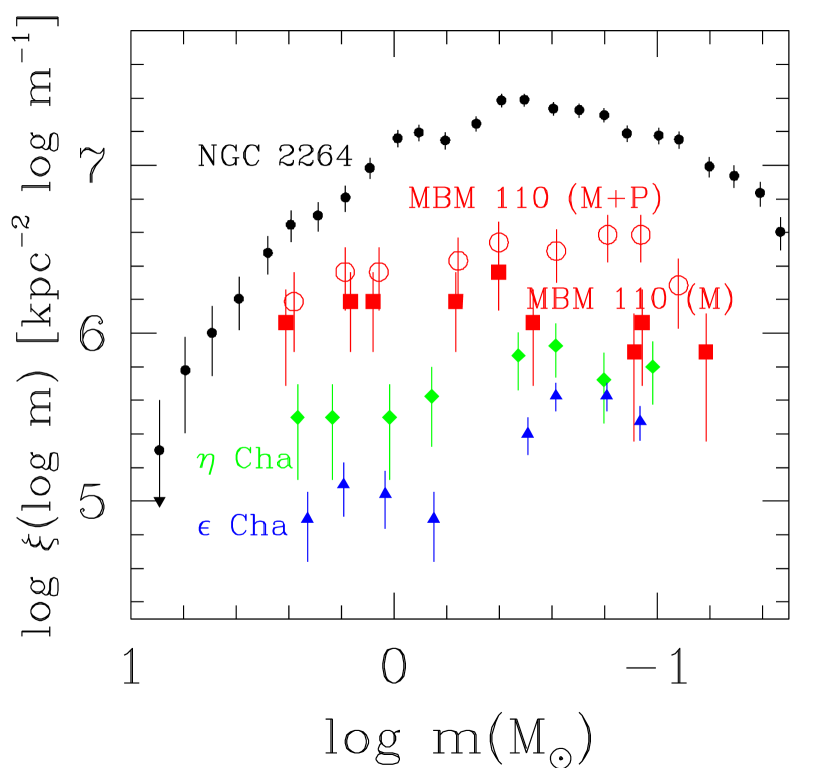
Figure 11 shows the initial mass function (IMF) of MBM 110 as well as that of three nearby star-forming regions (SFRs). Our spectroscopic census is complete for 14.5 mag, which is about for the 5 Myr isochrone. However, our photometric search for H emission stars from H photometry is complete down to 17 mag, equivalently . In addition, the completeness of Gaia astrometric data is similar to our photometry. And therefore, the completeness of the IMF is about . The membership selection of Cha and Cha is described in the Appendix. As the number of member stars is very small, we use a larger bin size of . We calculate the number of stars and mean mass in a logarithmic mass scale for each bin. The IMF of NGC 2264 is obtained from Sung & Bessell (2010). Most young open clusters (Sung & Bessell, 2010; Sung et al., 2017) or field stars in the Solar neighborhood (Chabrier, 2003) show a peak in the IMF at – . However, the IMF of MBM 110 shows a peak at for the IMF of members or a flat IMF in – for the IMF of members and probable members. The IMF of Cha is very similar to that of MBM 110. However, the IMF of Cha is increasing down to . The surface density of MBM 110 is about 10 times higher than that of Cha or Cha, mainly due to the adopted radius of each SFR ( for Cha and for Cha). The mass of the most massive star in MBM 110, Cha, and Cha is at most between 3.0 – 4.0.
3.3 Star Formation Efficiency
To determine the star formation efficiency of MBM 110, the mass of the molecular cloud should be calculated. The mass of the molecular cloud MBM 110 is estimated from the CO luminosity [W(CO)], angular size of the source, and the well-determined conversion factor ( - Bolatto et al. 2013). Because the angular size of MBM 110 was not mentioned in Magnani et al. (1985), we approximated the shape of the cometary cloud as a triangle in the Akari MIR image. The projected area of the cloud (about ) is equivalently at . However, the calculated W(CO) is far smaller than that presented by Maddalena et al. (1986) [W(CO) = 14.5 ] of MBM 110 (Cloud 14 in Maddalena et al. 1986). Considering the size of the MBM 110 cloud as determined from the map of Schlegel et al. (1998), the larger beam () used by Maddalena et al. (1986) in their mapping observation versus the single pointing observation with a larger telescope (e.g., smaller beam size) of Magnani et al. (1985), the CO measurement of Maddalena et al. (1986) is likely to give a better estimate of W(CO). The mass of the MBM 110 cloud is about . The minimum value of the star formation efficiency of MBM 110 is 1.0%. If we take into account the mass of probable members, the efficiency is about 1.4%. However, this value is a minimum value because many Class I objects seen in the WISE image are embedded in the western part of the cloud.
4 DISCUSSION
4.1 Triggered Star Formation versus Spontaneous Star Formation
Recently Kounkel et al. (2018) studied young stars in the Orion Star Forming Complex using Gaia DR2 and APOGEE-2 survey data. They analyzed data for more than 10,000 stars in 6-dimensional space and identified 190 groups in 5 larger structure. MBM 110 belongs to their Orion D - the oldest ( 5 – 8 Myr) group in the Orion SFR which comprises Orion OB1a and OB1b. However, the age of MBM 110 is about 4 Myr, which is younger than IC 2118 (7.9 2.5 Myr) and similar to LDN 1616 (5.0 1.7 Myr) (Kounkel et al., 2018) or Ori OB1c group (Bally, 2008). And therefore, were the star formation in MBM 110 triggered by massive stars in the Orion OB association, the massive stars in Ori OB1a or 1b subgroup (Orion D of Kounkel et al. 2018) might be the triggers.
Lee & Chen (2007) summarized the three distinct characteristics of triggered and spontaneous star formation in their Table 7 - signature of sequential star formation, spatial distribution of young stars and the location of ionization front, and the star formation efficiency. If the star formation in MBM 110 was triggered by massive stars in the Orion OB association, we can expect a systematic age variation along right ascension. However, we could not find any systematic variation of stellar age in either direction. The star formation efficiency is also very low. In addition, if the radiation-driven implosion model is operating in MBM 110, we could not find young stars far behind the bright rim. However, as shown in Figure 1, many Class I YSOs and related objects such as Herbig-Haro objects are found in LDN 1634. These facts for MBM 110 are not consistent with the triggered star formation scenario summarized by Lee & Chen (2007).
De Vries, Narayanan, & Snell (2002) observed several molecular transition lines in and wavelength in order to find direct evidence for the role of massive stars in the bright-rimmed clouds including L1634 [the 16th object in the Sugitani, Fukui, & Ogura (1991) catalog]. However, they could, in most cases, not see any direct evidence of triggering in these sources. These facts imply that spontaneous star formation may be operating in MBM 110.
4.2 Star Formation with No Massive Stars
The nearby Tau-Aur SFR is a well-known site of low-mass star formation (Kenyon et al., 2008). This kind of small SFRs seems to be ubiquitous. There are many small SFRs in the outskirt of the Orion nebula (Alcalá et al., 2008) as well as many young star groups in the Solar neighbourhood (Zuckerman & Song, 2004). Carpenter et al. (2000) found that about 39% of the cluster population, identified in the K’ images of 32 IRAS point sources distributed in the Cas OB6 association, are embedded in small clouds located as far as 100 pc from the W3/W4/W5 region. They speculated that these small clouds are fragments of a cloud complex dispersed by previous episodes of massive star formation. MBM 110 may be a similar object in the Orion-Eridanus superbubble. In this section, we estimate the contribution of such low-mass SFRs to the global mass function.
| # of | M | Surface density | Mtotal | ||
|---|---|---|---|---|---|
| (M⊙) | SFRs | (M⊙) | (kpc) | (kpc-2) | (M⊙ kpc-2) |
| 2 | 6 | 8 | 0.2 | 39.8 | 318 |
| 2 – 4 | 20 | 28 | 0.2 | 71.6 | 2005 |
| 4 – 8 | 10 | 59 | 0.5 | 5.1 | 301 |
| 8 – 16 | 34 | 108 | 1.0 | 3.2 | 346 |
| 16 – 32 | 29 | 949 | 3.0 | 0.95 | 902 |
| 32 – 63 | 25 | 3573 | 3.0 | 0.46 | 1644 |
| 65 – 150 | 14 | 9258 | 3.0 | 0.18 | 1637 |
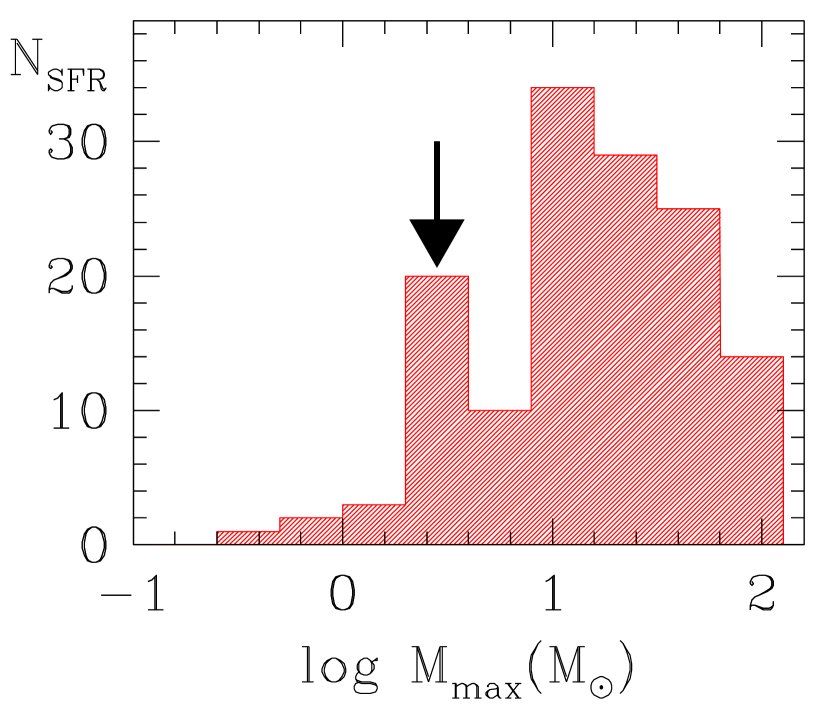
Figure 12 shows the distribution of mass of the most massive star [ (M⊙)] in various SFRs from Weidner et al. (2013). As marked in the figure, there is a distinct peak at – with a spectral type of B5 or later. The mini-clusters Cha, Cha as well as MBM 110 belong to this category. These small SFRs are faint, and therefore very difficult to recognize at a large distance. We investigate the characteristics of these small SFRs using the data in Appendix of Weidner et al. (2013). The cluster mass (Mecl in Weidner et al. 2013) of this type of SFR is between 13 – 126 and its median value is 28 , which is similar to the total stellar mass of MBM 110. The distances of the SFRs in the bin are mostly .4449 SFRs are closer than and 7 SFRs are farther than . However, the of the latter case may be very uncertain. And therefore, it is reasonable to assume that the data for these small SFRs are complete for .
On the other hand, the highest peak in Figure 12 is for the clusters of (M⊙) = 8 – 16 M⊙, which is equivalent to spectral type of O9V – B3V. The median Mecl of these SFRs is about 108 M⊙. The open clusters belonging to this group are bright enough to be observable even in the neighboring spiral arms. The distance distribution of these clusters shows several peaks - and between – . The first peak is the young open clusters in the local Orion spur, and those in the second peak are those in the Sgr-Car arm or in the Per arm. The census of these clusters may be complete for . The number of these clusters within is 10, and therefore the surface density of this group is 3.2 .
Table 6 summarises the result from the analysis of young SFR data in Weidner et al. (2013). The first column shows the range of of each bin (bin size: ). The second and third column represents, respectively, the number of SFRs and median Mecl of each bin. The fourth column is the distance of completeness for each group (), and the fifth column is the surface number density of each group using the number of SFRs within . The last column shows the mass contribution of each group to the Galactic disk within . Interestingly, the – SFRs contribute about 5.8 times that of the – SFRs. In addition, the contribution of small SFRs is about 30% of the total young stellar mass in the disk, and is the dominant component compared to any other groups in Table 6 and Figure 12. As the Mecl of larger SFRs are suspected to be overestimated (Sung et al., 2017), the contribution of these small SFRs may be larger than this. The implication of this result seems to be profound because these small SFRs are easily missed from observation due to their faintness. In addition, the mass of the most massive star in the small SFRs is not enough to contribute to the H luminosity of galaxies. And therefore the star formation rate calculated from the H luminosity may underestimate the actual star formation rate.
5 Summary and Conclusions
We presented the optical photometric and spectroscopic data for stars in the high Galactic latitude molecular cloud MBM 110 which is also known as the dark nebula L1634. For a comprehensive study of MBM 110 we analyzed WISE MIR data as well as Gaia astrometric data. The membership of stars in the observed field was critically evaluated for each star. A total of 17 members and 18 probable members were selected from this procedure. The results obtained from this study are as follows.
(1) The mean parallax of MBM 110 is 2.667 0.095 mas (equivalently ) determined from the Gaia DR2 data. The age of young stars in MBM 110 is about 1.9 Myr from Baraffe et al. (2015) or 3.1 Myr from Siess et al. (2000). The high mass truncation in the IMF occurs at about .
(2) The star formation efficiency of MBM 110 is very low. The minimum value is 1.0%. The efficiency will be 1.4% if probable members are included.
(3) The young stars in MBM 110 do no show any systematic variation in age along the right ascension direction. And star formation efficiency is very low. In addition, many Class I YSOs and related objects can be found far away from the ionization front, which implies that star formation in MBM 110 was not triggered by the radiation-driven implosion process. These facts are not consistent with the signatures of triggered star formation summarized by Lee & Chen (2007).
(4) The total stellar mass of MBM 110 is very small and is comparable to that of other small SFRs in the Solar neighborhood. It seems that although such small SFRs are very faint they are also very numerous. We analyse the mass budget of young SFR groups, and argue for the importance of small SFRs in the global star formation rate. Because these small SFRs are easily missed from observation due to their faintness, and because the mass of the most massive star in the small SFRs is insufficient to contribute to the H luminosity of galaxies, the star formation rate calculated from the H luminosity very likely underestimates the actual star formation rate.
This work has made use of data from the European Space Agency (ESA) mission Gaia (http://www.cosmos.esa.int/gaia), processed by the Gaia Data Processing and Analysis Consortium (DPAC, http://www.cosmos.esa.int/web/gaia/dpac/consortium). Funding for the DPAC has been provided by national institutions, in particular the institutions participating in the Gaia Multilateral Agreement. H.S. acknowledges the support of the National Research Foundation of Korea (Grant No. NRF- 2015R1D1A1A01058444 and NRF-2019R1A2C1009475).
References
- Alcalá et al. (2008) Alcalá, J. M., Covino, E., & Leccia, S. 2008, in Handbook of Star Forming Regions, Vol. 1, ed. B. Reipurth (San Francisco, CA: ASP), p. 801
- Bally (2008) Bally, J. 2008, in Handbook of Star Forming Regions, Vol. 1, ed. B. Reipurth (San Francisco, CA: ASP) , p. 459
- Baraffe et al. (2015) Baraffe, I., Homeier, D., Allard, F., & Chabrier, G. 2015, A&A, 577, 42 (BHAC)
- Beltrán et al. (2002) Beltrán, M. T., Estalella, R., Ho, P. T. P., Calvet, N., Anglada, G., & Sepúlveda, I. 2002, ApJ, 565, 1069
- Bohigas et al. (1993) Bohigas, J., Persi, P., & Tapia, M. 1993, A&A, 267, 168
- Bolatto et al. (2013) Bolatto, A. D., Wolfire, M., & Leroy, . K. 2013, ARA&A, 51, 207
- Bressan et al. (2012) Bressan, A., Marigo, P., Girardi, L., Salasnich, B., Dal Cero, C., Rubele, S., & Nanni, A. 2012, MNRAS, 427, 127
- Carpenter et al. (2000) Carpenter, J. M., Heyer, M. H., & Snell, R. L. 2000, ApJS, 130, 381
- Chabrier (2003) Chabrier, G. 2003, PASP, 115, 763
- Chlebowski & Garmany (1991) Chlebowski, T., & Garmany, C. D. 1991, ApJ, 368, 241
- De Vries, Narayanan, & Snell (2002) De Vries, C. H., Narayanan, G., & Snell, R. 2002, ApJ, 577, 798
- Fischer et al. (2016) Fischer, W. J., Padget, D. L., Stapelfeldt, K. L., & Sewiĺo, M. 2016, ApJ, 827, 96
- Hauschildt et al. (1999) Hauschildt, P., Allard, F., & Baron, E. 1999, ApJ, 512, 377
- Houk & Swift (1999) Houk, N., & Swift, C. 1999, “Michigan Catalogue of two-dimensional spectral types for HD stars” Vol. 5
- Im et al. (2010) Im, M., Ko, J., Cho, Y., Choi, C., Jeon, Y., Lee, I., & Ibrahimov, M. 2010, JKAS, 43, 75
- Kenyon et al. (2008) Kenyon, S. J., Gómez, M., & Whitney, B. A. 2008, in Handbook of Star Forming Regions, Vol. 1, ed. B. Reipurth (San Francisco, CA: ASP), p. 405
- Kounkel et al. (2018) Kounkel, M., Covey, K., Suárez, C. et al. 2018, AJ, 156, 84
- Lee & Chen (2007) Lee, H.-T., & Chen, W.-P. 2007, ApJ, 657, 884
- Lim et al. (2009) Lim, B., Sung, H., Bessell, M. S., Karimov, R., & Ibrahimov, M. 2009, JKAS, 42, 161
- Lim et al. (2016) Lim, B., Sung, H., Kim, J. S., Bessell, M. S., Hwang, N., & Park, B.-G. 2016, ApJ, 831, 116
- Lindegren (2018) Lindegren, L. 2018, KNOWN ISSUES WITH THE GAIA DR2 DATA (https://www.cosmos.esa.int/web/gaia/dr2-known-issues) “GAIA-C3-TN-LU-LL-124-01”
- Lindegren et al. (2018) Lindegren, L., Hernandez, J., Bombrun, A. et al. 2018, A&A, 616, 2
- Lynds (1962) Lynds, B. T. 1962, ApJS, 7, 1
- Lyo et al. (2004) Lyo, A-R., Lawson, W. A., & Bessell, M. S. 2004, MNRAS, 355, 363
- Maddalena et al. (1986) Maddalena, R. J., Morris, M., Moscowitz, J., & Thaddeus, P. 1986, ApJ, 303, 375
- Magnani et al. (1985) Magnani, L., Blitz, L., & Mundy, L. 1985, ApJ, 295, 402
- Mermilliod (1991) Mermilliod, J. C. 1991, “Homogeneous Means in the System,” (VizieR Catalog II/168), Institut d’Astronomie, Universite de Lausanne
- Murphy et al. (2013) Murphy, S., Lawson, W. A., & Bessell, M. S. 2013, MNRAS, 435, 1325
- O’Connell et al. (2004) O’Connel, B., Smith, M. D., Davis, C. J., Hodapp, K. W., Khanzadyan, T., & Ray, T. 2004, A&A, 419, 975
- Pecaut & Mamajek (2013) Pecaut, M. J., & Mamajek, E. E. 2013, ApJS, 208, 9
- Schlegel et al. (1998) Schlegel, D. J., Finkbeiner, D. P., & Davis, M. 1998, ApJ, 500, 525
- Secrest et al. (2015) Secrest, N. J., Dudik, R. P., Dorland, B. N. et al. 2015, ApJS, 221, 12
- Siess et al. (2000) Siess, L., Dufour, E., & Forestini, M. 2000, A&A, 358, 5931 (SDF)
- Stephenson (1986) Stephenson, C. B. 1986, ApJ, 300, 779
- Sterzik et al. (1995) Sterzik, M. F., Alcalá, J. M., Neuhaeuser, R., & Schmitt, J. H., M. M. 1995, A&A, 297, 418
- Stetson (1991) Stetson P. B., 1991, PASP, 102, 932
- Sugitani, Fukui, & Ogura (1991) Sugitani, K., Fukui, Y., & Ogura, K. 1991, ApJ, 455, L39
- Sung & Bessell (2010) Sung, H., & Bessell, M. S. 2010, AJ, 140, 2070
- Sung et al. (2004) Sung, H., Bessell, M. S., & Chun, M.-Y. 2004, AJ, 128, 1684
- Sung et al. (2008) Sung, H., Bessell, M. S., Chun, M.-Y., Karimov, R., & Ibrahimov, M. 2008, AJ, 135, 441
- Sung et al. (2017) Sung, H., Bessell, M. S., Chun, M.-Y., Yi, J., Nazé, Lim, B., Karimov, R., & Rauw, G. 2017, ApJS, 230, 3
- Sung et al. (1997) Sung, H., Bessell, M. S., & Lee, S.-W. 1997, AJ, 114, 2644
- Sung et al. (2000) Sung, H., Chun, M.-Y., & Bessell, M. S. 2000, AJ, 120, 333
- Sung et al. (2013) Sung, H., Lim, B., Bessell, M. S., Kim, J. S., Hur, H., Chun, M., & Park, B.-G. 2013, JKAS, 46, 103
- Weidner et al. (2013) Weidner, C., Kroupa, P., & Pflamm-Altenburg, J. 2013, MNRAS, 434, 84
- Wiramihardja et al. (1991) Wiramihardja, S. D., Kogure, T., Yoshida, S., Nakano, M., Ogura, K., & Iwata, T. 1991, PASJ, 43, 27
- Zuckerman & Song (2004) Zuckerman, B., & Song, I. 2004, ARA&A, 42, 685
Appendix A Membership Selection of the Cha Mini-Cluster
The Gaia DR2 parallax and proper motion data for 14 known members of the Cha mini-cluster (Lyo et al., 2004) were downloaded from VizieR, and the average value and standard deviation of , , and were calculated. And then we searched for the probable members around Cha within a radius and within 5 times the standard deviation around the average ( = 8.95 – 11.42 mas, = -35.5 – -23.6 mas/yr, and = +24.3 – +29.8 mas/yr). From this procedure we selected 9 candidates. One of them (Gaia DR2 5196802989555695104) is fainter than the PMS sequence of Cha, and so the star was deleted from the list.
The characteristics of the final 21 members of the Cha mini-cluster are = 10.164 0.036 mas, = -29.53 1.90 mas/yr, = +27.09 , and = +14.05 4.55 km/s. And the radius of Cha (, is equivalently 2.75 pc at = 98.3 pc) is determined from the maximum distance of members from Cha.
Appendix B Membership Selection of the Cha Mini-Cluster
From Fig. 2 of Murphy et al. (2013) we selected 77 candidate Cha cluster stars within from (, ) = (, ) with = 9.12 – 10.57 mas, = -50.2 – -31.2 mas/yr, and = -30.7 – +17.4 mas/yr. Among them 11 stars were rejected in the CMD, 6 stars were deleted due to a larger difference from the mean and standard deviation of the proper motion vector. However, 4 stars ( Cha AB, Cha 17, Cha 36, & Cha 24) that were rejected due to a large error or no data in Gaia DR2 measurements were recovered.
The astrometric characteristics of 64 members of Cha are = 9.65 0.74 mas, = -40.53 1.75 mas/yr, and = -6.97 3.88 mas/yr. However, Murphy et al. (2013) considered that the size of Cha is much larger than the searching radius used here. In that case the IMF of Cha in Figure 11 will be lower by about 1 dex.