Magnetization-polarization cross-control near room temperature in hexaferrite single crystals
Abstract
Mutual control of the electricity and magnetism in terms of magnetic () and electric () fields, the magnetoelectric (ME) effect, offers versatile low power-comsumption alternatives to current data storage, logic gate, and spintronic devices Kimura2003 ; Hur2004 ; Matsukura2015NatNano ; Fusil2014 . Despite its importance, -field control over magnetization () with significant magnitude was observed only at low temperatures Tokunaga2012NatPhys ; Chai2014 ; Zhai2017NatMat ; Chu2008 ; Heron2014a . Here we have successfully stabilized a simultaneously ferrimagnetic and ferroelectric phase in a Y-type hexaferrite single crystal up to 450 K, and demonstrated the reversal of large non-volatile by field close to room temperature. Manipulation of the magnetic domains by field is directly visualized at room temperature by using magnetic force microscopy. The present achievement provides an important step towards the application of ME multiferroics.
Multiferroic materials, endowed with both orders of polarization () and , exhibit various intriguing phenomena due to the interplay of magnetic and electric degrees of freedom, such as -induced flop Kimura2003 ; Hur2004 , -control of magnetic helicity Yamasaki2007 ; Tokunaga2010PRL , and optical non-reciprocal directional dichroism Arima2008JPCM ; Kezsmarki2011 . The cross-coupling phenomena can greatly expand the functions of materials, and hence the multiferroic materials are anticipated to be applied to technological devices. In particular, non-volatile, -driven reversal of without significant dissipation will lead to magnetic memory devices with ultra-low power-consumption.
To accomplish this goal, strong coupling between and is necessary. In general, depending on the microscopic mechanism of generation, the strength of the cross-coupling is different: In type-I multiferroics where emerges potentially at a high temperature, but independently of the magnetic ordering, the coupling between and is weak, while in type-II multiferroics where is induced by magnetic ordering, the coupling between and is strong Khomskii2009 . Thus far, the -induced reversal has been investigated for both type-I and type-II mutiferroics. Heterostructures based on BiFeO3 belonging to the type-I category have been demonstrated to be promising Chu2008 ; Heron2014a ; Sosnowska2013 ; Hojo2017 , while -induced reversal is difficult Tokunaga2015 . In the type-II category, good performance has been reported for hexaferrite materials Kimura2005PRL ; Ishiwata2008 ; Ishiwata2010PRB ; Kimura2012 ; Chai2014 ; S (3); Zhai2017NatMat with various structural types, including those at room temperatureKitagawa2010 ; Song2014 ; Chun2012 . Among them, the largest switching (/f.u.) by was obtained in Y-type hexaferrites Chai2014 ; Zhai2017NatMat at cryogenic temperatures, which is attributed to the simultaneous reversal of the ferroelectric and ferrimagnetic order parameters in a particular multiferroic phase, termed FE3 phase. Moreover, this FE3 phase was found to emerge as a metastable state even at room temperature Hirose2014 ; S (3). Here we demonstrate that by choosing appropriate chemical composition and performing high-pressure oxygen annealing, the FE3 phase can be partially stabilized up to above room temperature. This enables us to observe reversal of with considerable magnitude by field as well as the nearly-full reversal of by field in a single-component material near room temperature. By using magnetic force microscopy (MFM) technique, magnetic domain switching by field is visualized.
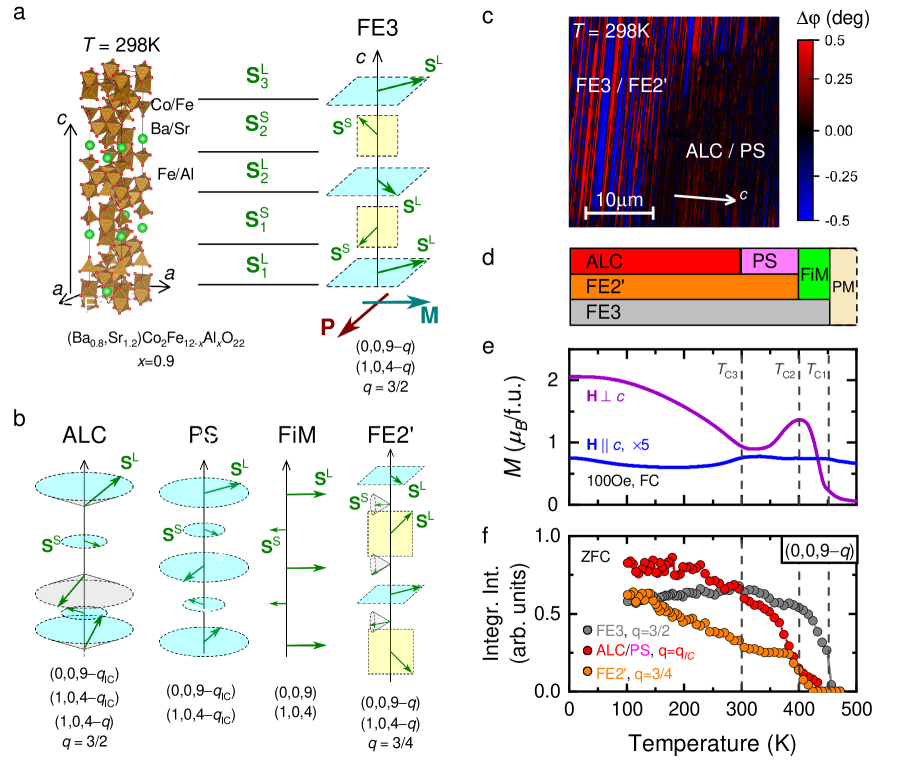
Figure 1a shows the structural unit cell of the Y-type hexaferrite studied in the present work, Ba0.8Sr1.2Co2Fe12-xAlxO22 with =0.9 (BSCFAO), which is composed of Fe3+/Co2+ and Fe3+/Al3+ ions in tetrahedral and octahedral oxygen coordinations, respectively, similarly to the other members of the material family. It has been known Kimura2012 that the magnetic structure in the hexaferrites is well described by ferrimagnetically-ordered spin-blocks with large () and small () net magnetizations alternately stacked along the axis. As a result of complex magnetic interactions among the adjacent magnetic blocks, various magnetic structures have been identified Ishiwata2010PRB ; S (3). These structures, such as commensurate phases FE3 and FE2’ (Ref. Ishiwata2010PRB, ), alternating longitudinal conical (ALC) S (4), proper screw (PS), and collinear ferrimagnetic (FiM) phases (schematically illustrated in Fig. 1a and 1b) are also observed in the present material. The magnetic ground state reached via zero-field cooling was reported to be ALC for a hexaferrite with a similar composition Chang2012PRB ; S (5). The FE3 phase is induced by field applied within the magnetic easy-plane, but preserved as a metastable state even after the field is removed Hirose2014 ; S (3). In the FE3 phase the magnetic moments of the and blocks form a double fan structure S (3), lying in the plane and a plane containing -axis, respectively. Spin-driven emerges within the plane and perpendicular to the net , due to the the inverse Dzyaloshinskii-Moriya mechanism Ishiwata2008 ; Ishiwata2010PRB .
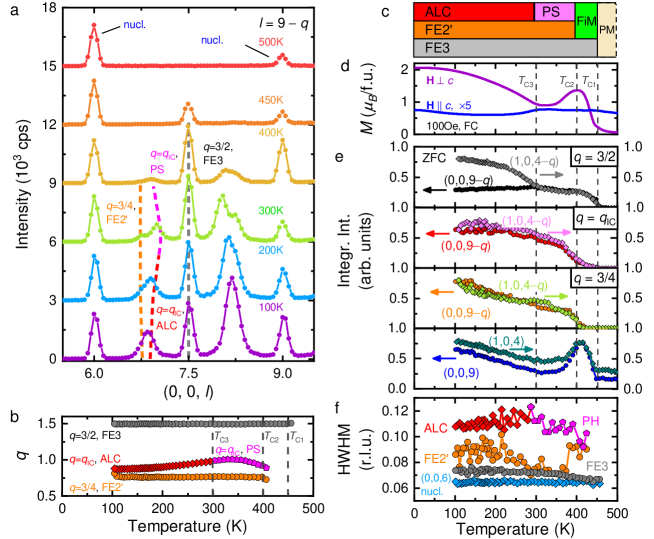
The magnetic phases in BSCFAO have been investigated by the zero-field-cooled (ZFC) MFM, low-field-cooled magnetization, and neutron diffraction measurements as shown in Figs. 1c to 1f. The neutron diffraction measurements revealed a complex magnetic phase diagram with several co-existing magnetic orders (Fig. 1d and see Supplementary Information), which was determined by taking also the previous results into account Ishiwata2010PRB ; S (3); Sagayama2009 . Below =450 K, a magnetic peak with a commensurate wavevector of appears together with the onset of for , which indicates the coexistence of the FE3 and the collinear FiM phases. At =400 K, the magnetic peaks with commensurate and incommensurate wavenumbers emerge, while for decreases, indicating that the FiM phase is turned into the PS and FE2’ phases. Finally at =300 K, the PS order changes to the ALC phase as for shows a slight decrease. Real-space MFM image of an surface at room temperature indicates the phase separation between the strongly magnetic (large averaged-magnetization hosting) FE3/FE2’ and weakly magnetic (little averaged-magnetization hosting) ALC/PS phases as shown in Fig. 1c (for details see the Supplementary Information). A prominent feature of the present-composition compound, being distinct from the previous report S (3) on a similar Y-type hexaferrite, is the presence of stable FE3 phase among the zero-field-cooled states.
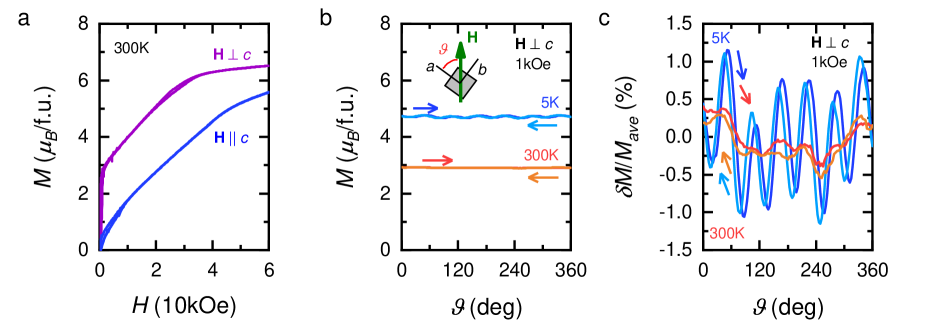
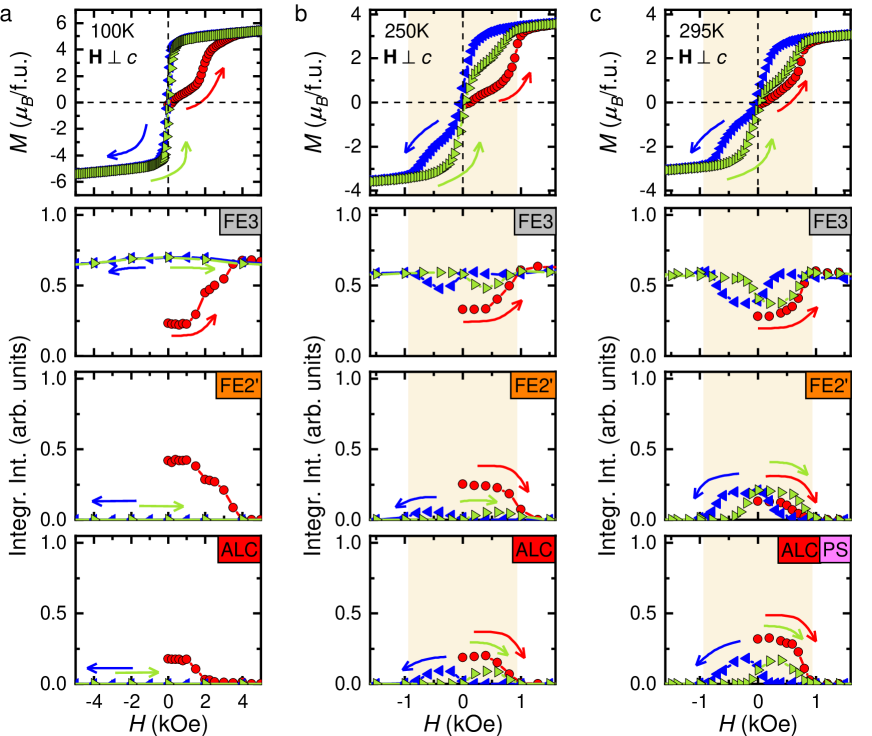
Magnetic state under applied within the -plane was investigated by magnetization and neutron-diffraction experiments. In Fig. 2, and the neutron diffraction intensities corresponding to each of the co-existing phases are separably plotted. Prior to the application of , three phases coexist in the ZFC initial state in agreement with the temperature-dependent measurements. At 100 K (Fig. 2a), the ALC and FE2’ phases disappear at =2 kOe and =4 kOe, respectively, while the FE3 phase takes over their places. Once the single-phase state of FE3 is attained, it is fully preserved even when the field is removed or reversed. On the contrary, at 250 K (Fig. 2b) and 295 K (Fig. 2c), both the ALC and FE2’ phases reappear upon the reversal of the field. At relatively high temperatures, thermal agitation is large enough to overcome the energy barriers between the competing phases with almost degenerated free energies, while not at low temperatures. It is noted that magnetic anisotropy within the -plane is negligible at room temperature (Fig. S6), and hence the - curve as well as the diffraction intensity are least affected by the anisotropy.
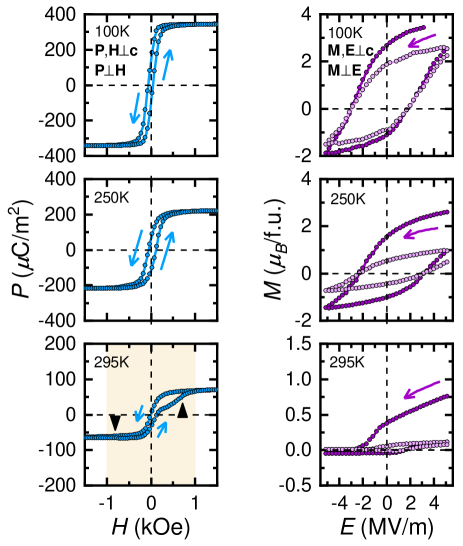
-induced and -controlled are shown in Fig. 3. Prior to the measurements, the single-domain ME state was attained by the application of poling fields in a crossed configuration (). Below =250 K both and show anti-symmetric dependence on and fields, respectively, indicating that the - coupling is conserved throughout the reversal of the fields. Magnitude of the saturation value of the spin-driven polarization () is significantly larger than the earlier observations in other Y-type hexaferrites Ishiwata2008 ; Chun2010 ; Chai2014 ; S (3), while comparable to TbMnO3 Yamasaki2007 and the spin-driven component of BiFeO3 which can be controlled by the field of more than =100 kOe Tokunaga2015 . Correspondingly, the magnetization change between fields, =5.5 /f.u., at =100 K is larger than in any former experiments performed at lower temperatures Tokunaga2012NatPhys ; Chai2014 ; Zhai2017NatMat . Even at 250 K, a significant portion of can be reversed (/f.u.) by the field. Near room temperature, symmetry of the - and - loops begins to change to a symmetric butterfly shape, indicating that the - clamping is not fully preserved during the reversal. Moreover, - loops show a secondary hysteresis (indicated with black triangles), which is attributed to the re-emergence and disappearance of the PS and FE2’ phases as shown in Fig. 2c.
Importantly, the remanent of BSCFAO can be switched in a non-volatile manner between positive and negative values by field even at 250 K, which is favourable for ME memory and spintronic applications. Changes in the remanent for the first two - loops are as large as =3.9 /f.u. and =3.0 /f.u. at 100 K and =2.5 /f.u. and =1.5 /f.u. at 250 K. Correspondingly, the remanent is also switched between positive and negative values with =95 C/m2 at 250 K. As for the retention, - loop exhibit good characteristics for the repeated reversal processes even at 295 K (see Fig. S7). However, - loops are subject to deterioration at higher temperatures than 250 K. This decrease in the magnitude of the reversible is attributed to the weakened - coupling as well as insufficient magnitude of the applicable field.
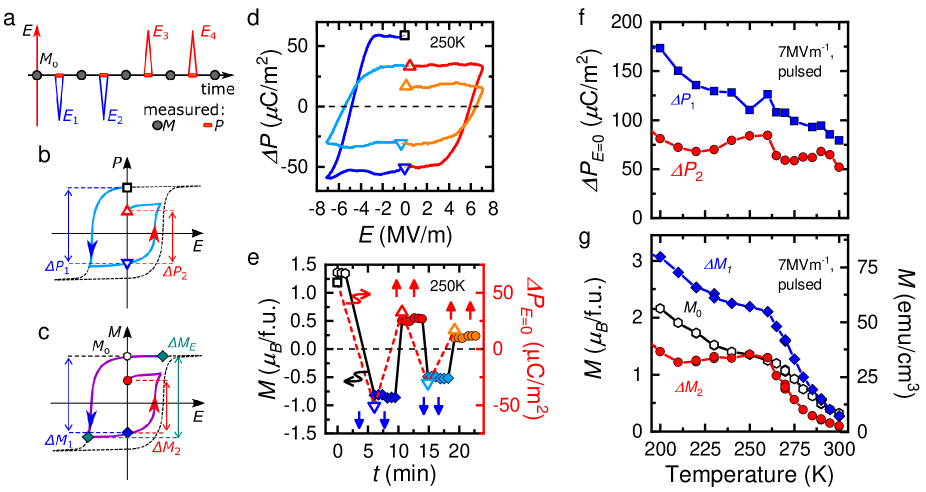
To further clarify the behaviour of the - coupling, and reversal was investigated simultaneously in pulsed field experiments (Fig. 4). Similarly to the quasi-static measurements, the single-domain FE3 state was initially prepared with poling fields (). After the removal of the poling fields, triangular-shaped -field pulse pairs were applied anti-parallel, then parallel with respect to the poling field (see Fig. 4a). was measured before and after the pulses, while was measured during the same period as the -field pulses were applied (see Methods for details). The - curve of magnetic origin at =250 K is displayed in Fig. 4d, where the partial reversal of the ferroelectric is attained by the pulsed field.
Figure 4e shows simultaneous reversal of the remanent and by four pairs of -field pulses at 250 K. Upon the first negative -field pulse, both the remanent and change from positive to negative, causing the magnetization change =2.3 /f.u.. The is almost completely reversed at this point, and there is only a small change in for the second negative -field pulse. For the subsequent two positive -field pulses, and were again reversed from negative to positive, with the change of =1.8 /f.u.. Although the magnitudes of both and decrease as further pulses are applied, similarly to the quasi-static experiments, their parallel reduction demonstrates the strong - clamping in this temperature range ( K).
Temperature dependence of the and switched by the first negative and positive -field pulses, as defined as , , , and (Figs. 4b, 4c) respectively, are shown in Figs. 4f and 4g. Irrespective of the strength of the - coupling, can be reversed by the field. Magnitude of the reversed and slightly decreases as the temperature is increased, but remains finite at 300 K, since the multiferroic FE3 phase is present in the whole temperature region shown here. The initial value , and the switched magnetizations and show similar temperature dependence with the up to 260 K. In contrast to the , however, the exhibits more rapid decrease above 260 K, and almost vanishes at 300 K. Therefore, the -control over the is lost due to the weakened - coupling rather than to the reduced volume fraction of the FE3 phase.
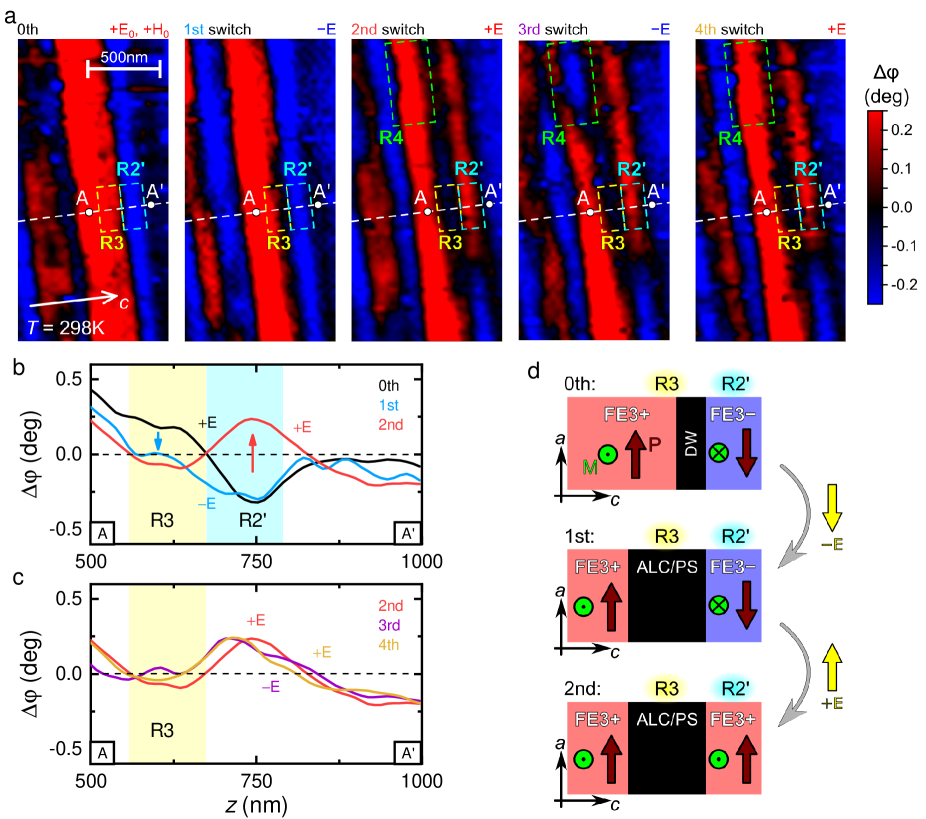
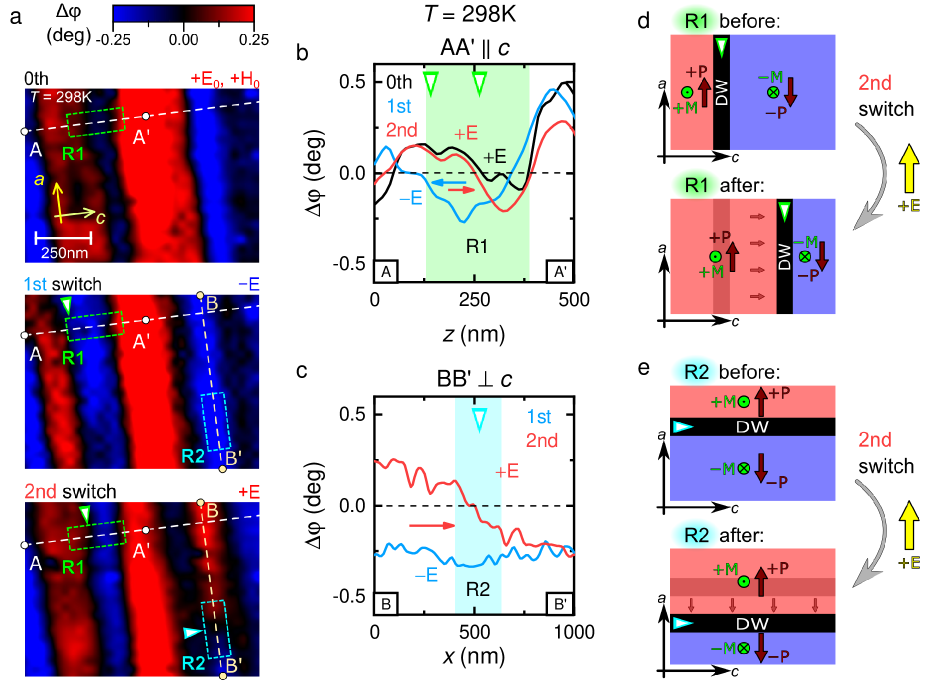
Using the real-space MFM imaging, we have investigated -field induced motion of the magnetic domain walls (DW) at room temperature (Fig. 5). The measurement was started from an initial state (0 th in Fig. 5a), where poling and fields were once applied and then removed, and the evolution of the magnetic domain pattern of the same region was followed after several applications of the field (1st-2nd in Fig. 5a and 1st-4th Fig. S10). As displayed in Fig. 5a, magnetic domain pattern clearly shows changes in response to the applied fields with different sign, which demonstrates that these are composite - domain walls Tokunaga2009NatMat . The most typical cases of domain dynamics are observed in regions R1 and R2.
At region R1 in Fig. 5a, the negatively magnetized region expands and shrinks due to the successive applications of field with alternate sign, which corresponds to DW propagation along the axis. Figure 5b shows the MFM signals taken along the A-A’ line, clearly demonstrating the DW motion along axis. The process of switch is schematically illustrated in Fig. 5d, where one of the domains expands along the axis, so that the ME domain with parallel to expands. The small magnetic anisotropy within the plane (see Fig. S6) suggests that in this boundary between the oppositely magnetized regions, local net is likely to rotate around the axis.
The region R2 in Figs. 5a and 5c exemplifies a different process, where a positively magnetized domain is pushed in the image area from the upper side. This behaviour is clearly illustrated in the line profile of Fig. 5c. The process of switch (shown in Fig. 5e) is similar to the previous case, however, in this case the domains are separated by a DW, where local appears to form a cycloidal structure. Apart from these successful examples, change in the ratio between the majority and minority magnetic domains is relatively small, pointing to the the decreased - coupling at a relatively high temperature, e.g. room temperature.
In summary, we have demonstrated that the switching by -field in BSCFAO is realized via the propagation of magnetic domain walls that respond to the field throughout the material. At low temperatures and are tightly clamped and reversed simultaneously, while at high temperatures the - coupling becomes weaker and the domain walls are deconfined. To further improve the -field induced reversal in Y-type hexaferrites, the confinement-deconfinement crossover of the domain walls should be pushed to higher temperature, while the co-existing ALC, PS, and FE2’ phases have to be suppressed.
Methods
Single crystal growth, sample preparation and oxygen annealing procedures. Single crystals of Y-type hexaferrite, Ba0.8Sr1.2Co2Fe12-xAlxO22 with =0.9, were grown by the laser floating zone (LFZ) technique in 10 atm oxygen atmosphere. First, SrCO3, BaCO3, Co3O4, Fe2O3 and Al2O3 were mixed in stochiometric amount and sintered in air at 1150 ∘C for 24 h. Then the resulting product was pressed into rods and re-sintered for 14 h in the same conditions. Y-type hexaferrite single crystals from earlier growths were used as seeds for the LFZ growth. The single crystal rods were oriented with a back-scattering Laue camera and cut into discs with the surfaces containing -axis. To increase the resistivity of the samples for the ME as well as neutron diffraction measurements, the cut pieces were annealed in 10 atm O2 at 1000 ∘C for 100 h in sealed quartz tubes, by adopting the technique described in Ref. S, 2 (see the Supplementary Information and Fig. S1).
Neutron diffraction measurements. Neutron diffraction measurements were carried out at the triple-axis neutron spectrometer (PTAX) in the High Flux Isotope Reactor of Oak Ridge National Laboratory. Sliced and O2-annealed single crystal of BSCFAO (approximately 25 mm3) were placed in a cryomagnet with applied along the axis, while plane was set to be the scattering plane.
-, - and - measurements. For each type of experiments, single crystals with the surface containing -axis were coated with Au/Pt as electrodes, thus field was applied in the plane while field was perpendicular to both the field and the axis (). field dependence of the polarization was measured in a PPMS (Quantum Design) with an electrometer (Keithley 6517A) by monitoring the displacement current as the field was swept with 100 Oe/s continuously between 5 kOe for 11-21 cycles, depending on the signal to noise ratio. Current peaks around 0 Oe did not show degradation, therefore the - curves were obtained by integrating the current after averaging. Magnetization measurement under field was carried out in an MPMS-XL (Quantum Design), while the electrometer (Keithley 6517A) was used as a voltage source. The thickness, surface area, and mass of the sample were 70 m, 1.64 mm2, and 0.71 mg, respectively. Pulsed field measurements were performed with a ferroelectric tester (Radiant Inc., Precision Premiere II) equipped with 500 V option. The ferroelectric polarization of magnetic origin was measured by the Positive-Up-Negative-Down (PUND) technique. At low temperatures, triangular-shaped -field pulses with 7 MV/m in amplitude and 50 ms in duration were applied. Above 280 K, however, the pulse duration was reduced to 1 ms due to the lower resistivity.
Magnetic force microscopy measurements. Magnetic force microscopy measurements were carried out with a commercially available scanning probe microscope (MFP-3D, Asylum Research) using Co-coated cantilever (MFMR-10, Nano World). For -field-dependent measurements, samples were poled to a single domain ME state using +3 MV/m and +4 kOe poling fields in configuration in a PPMS (for sample preparation see Supplementary Information). Static field (+3 MV/m or 3 MV/m) was applied to manipulate magnetic domains using a Keithley 6517A electrometer, and the MFM images were taken after the field was switched off. The sign and magnitude of MFM phase shift, , roughly correspond to those of the magnetization perpendicular to the plane.
Acknowledgements This research used resources at the High Flux Isotope Reactor, a DOE Office of Science User Facility operated by the Oak Ridge National Laboratory. This research was supported in part by the U.S.-Japan Cooperative Program on Neutron Scattering. Structural unit cell of the Y-type hexaferrite crystal was illustrated using the software VESTAMomma2011 . The authors are grateful for the technical assistance provided by Maximilian A. Hirschberger.
Author Contributions V.K., T.N., M.M., K.K., T.A. performed the measurements and analyzed the data; V.K., Y.K., A.K., Y. Tokunaga prepared the single crystal samples; J.T. investigated the O2 annealing; V.K., F.K. took the MFM images; V.K., Y. Taguchi wrote the manuscript; Y. Taguchi and Y. Tokura conceived the project; all the authors contributed to the discussion of the results.
References
- (1) Kimura, T., et al. Magnetic control of ferroelectric polarization. Nature 426, 55 (2003).
- (2) Hur, N., Sharma, P. A., Ahn, J. S., Guha, S. & Cheong, S.-W. Electric polarization reversal and memory in a multiferroic material induced by magnetic fields, Nature 429, 392-395 (2004).
- (3) Matsukura, F., Tokura, Y. & Ohno, H., Control of magnetism by electric fields. Nat. Nano. 10, 209-220 (2015).
- (4) Fusil, S., Garcia, V., Barthélémy, A. & Bibes, M. Magnetoelectric devices for spintronics. Ann. Rev. Mater. Res. 44, 91-116 (2014).
- (5) Tokunaga, Y., Taguchi, Y., Arima, T.-h. & Tokura, Y. Electric-field-induced generation and reversal of ferromagnetic moment in ferrites. Nat. Phys. 8, 838-844 (2012).
- (6) Chai, Y. S., et al. Electrical control of large magnetization reversal in a helimagnet. Nat. Commun. 5, 4208 (2014).
- (7) Zhai, K., et al. Giant magnetoelectric effects achieved by tuning spin cone symmetry in Y-type hexaferrites. Nat. Commun. 8, 519 (2017).
- (8) Chu, Y.-H., et al. Electric-field control of local ferromagnetism using a magnetoelectric multiferroic. Nat. Mater. 7, 478-482 (2008).
- (9) Heron, J. T., et al. Deterministic switching of ferromagnetism at room temperature using an electric field. Nature 516, 370-373 (2014).
- (10) Yamasaki, Y., et al. Electric control of spin helicity in a magnetic ferroelectric. Phys. Rev. Lett. 98, 147204 (2007).
- (11) Tokunaga, Y., et al. Multiferroic M-type hexaferrites with a room-temperature conical state and magnetically controllable spin helicity. Phys. Rev. Lett. 105, 257201 (2010).
- (12) Arima, T.-h. Magneto-electric optics in non-centrosymmetric ferromagnets. J. Phys. Condens. Matter 20, 434211 (2008).
- (13) Kézsmárki, I., et al. Enhanced Directional Dichroism of Terahertz Light in Resonance with Magnetic Excitations of the Multiferroic Ba2CoGe2O7 Oxide Compound. Phys. Rev. Lett. 106, 057403 (2011).
- (14) Khomskii, D. Classifying multiferroics: Mechanisms and effects. Physics 2, 20 (2009).
- (15) Sosnowska, I., et al. Crystal and magnetic structure in co-substituted BiFeO3. Inorg. Chem. 52, 13269-13277 (2013).
- (16) Hojo, H., et al. Ferromagnetism at room temperature induced by spin structure change in BiFe1-xCoxO3 thin films. Adv. Mater. 29, 1603131 (2017).
- (17) Tokunaga, M., et al. Magnetic control of transverse electric polarization in BiFeO3. Nat. Comm. 6, 5878 (2015).
- (18) Kimura, T., Lawes, G. & Ramirez, A. P. Electric polarization rotation in a hexaferrite with long-wavelength magnetic structures. Phys. Rev. Lett. 94, 137201 (2005).
- (19) Ishiwata, S., Taguchi, Y., Murakawa, H., Onose, Y. & Tokura, Y. Low-magnetic-field control of electric polarization vector in a helimagnet. Science 319, 1643-1646 (2008).
- (20) Ishiwata, S., et al. Neutron diffraction studies on the multiferroic conical magnet . Phys. Rev. B 81, 174418 (2010).
- (21) Kimura, T. Magnetoelectric hexaferrites. Annu. Rev. Condens. Matter Phys. 3, 93-110 (2012).
- (22) Nakajima, T., et al. Magnetic structures and excitations in a multiferroic Y-type hexaferrite BaSrCo2Fe11AlO22. Phys. Rev. B 94, 195154 (2016).
- (23) Kitagawa, Y., et al. Low-field magnetoelectric effect at room temperature. Nat. Mater. 9, 797 (2010).
- (24) Song, Y. Q., et al. Spin reorientation transition and near room-temperature multiferroic properties in a W-type hexaferrite SrZn1.15Co0.85Fe16O27. J. Appl. Phys. 115, 093905 (2014).
- (25) Chun, S. H., et al. Electric Field Control of Nonvolatile Four-State Magnetization at Room Temperature. Phys. Rev. Lett. 108, 177201 (2012).
- (26) Hirose, S., Haruki, K., Ando, A. & Kimura, T. Mutual control of magnetization and electrical polarization by electric and magnetic fields at room temperature in Y-type BaSrCo2-xZnxFe11AlO22 ceramics. Appl. Phys. Lett. 104, 022907 (2014).
- (27) Lee, H. B., et al. Field-induced incommensurate-to-commensurate phase transition in the magnetoelectric hexaferrite Ba0.5Sr1.5Zn2(Fe1-xAlx)12O22. Phys. Rev. B 83, 144425 (2011).
- (28) Chang, H., et al. Al doping effect on magnetic phase transitions of magnetoelectric hexaferrite Ba0.7Sr1.3Zn2(Fe1-xAlx)12O22. Phys. Rev. B 85, 064402 (2012).
- (29) Lee, H. B., et al. Heliconical magnetic order and field-induced multiferroicity of the Co2 Y-type hexaferrite Ba0.3Sr1.7Co2Fe12O22. Phys. Rev. B 86, 094435 (2012).
- (30) Sagayama, H., et al. Two distinct ferroelectric phases in the multiferroic -type hexaferrite Ba2Mg2Fe12O22. Phys. Rev. B 80, 180419 (2009).
- (31) Chun, S. H., et al. Realization of giant magnetoelectricity in helimagnets. Phys. Rev. Lett. 104, 037204 (2010).
- (32) Tokunaga, Y., et al. Composite domain walls in a multiferroic perovskite ferrite. Nat. Mater. 8, 558-562 (2009).
- (33) Inaguma, Y., et al. Synthesis and dielectric properties of a perovskite Bi1/2Ag1/2TiO3. Ferroelectrics 264, 127 (2001).
- (34) Momma, K. & Izumi, F., VESTA: a three-dimensional visualization system for electronic and structural analysis. J. Appl. Crystallogr. 41, 653-658 (2008).
Supplementary Material
Effect of oxygen annealing on resistivity
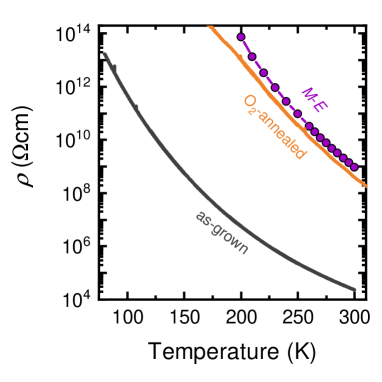
Sliced samples were annealed in 10 atm O2 at 1000 ∘C for 100 h in sealed quartz tubes, similarly to Ref. S, 1, by adopting the technique reported in Ref. S, 2 using Ag2O as oxygen source. Figure S1 presents the electrical resistivity of BSCFAO measured by a two-probe method before (black curve) and after (red curve) the O2 annealing procedure under constant voltage and 2 K/min temperature sweep rate. For the sake of comparison, the resistivity determined from the - curves simultaneously obtained during the - measurements at fixed temperatures are shown by orange coloured dots. Resistivity of BSCFAO shows semiconductor-like temperature dependence with an activation energy of 0.5 eV prior to the O2 heat-treatment. After the the O2 annealing, the activation energy is increased to 1 eV and the resistivity is enhanced by 5-6 orders of magnitude. The as-grown crystals have oxygen deficiencies, which indicates that the material has Fe2+ besides the Fe3+ ions, thereby leading to higher conductivity. The high-pressure annealing reduces the oxygen deficiencies and increases the resistivity.
Sample preparation procedures for magnetoelectric (ME) and magnetic force microscopy (MFM) mearurements
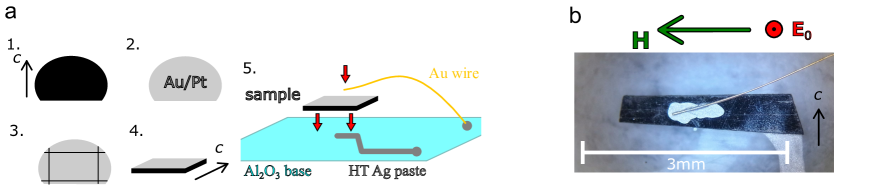
Sample preparation processes for the magnetoelectric measurements are illustrated in a step-by-step manner in Fig. S2a. Both for - and - measurements, single crystals were sliced so that the -axis is parallel to the surfaces, which were coated with Au/Pt electrodes, thus field was applied within the plane while the field was perpendicular to both the field and the axis (; ). In case of - measurements, coverage of the surfaces by the electrodes was crucial, as the of the uncovered parts cannot be reversed. Therefore, the edges of the samples were cut off in order to ensure the complete coverage. The cut samples were placed on sapphire plates, where the bottom electrode was prepared with heat-treatment silver paste (Dupont 7095), while the top electrode was connected with a gold wire and silver paste (Dupont 4922N). A photograph of the sample used in the - measurements is shown in Fig. S2b. field was applied perpendicular to the field and the axis along the lateral direction. This piece had 3 mm lateral dimension, 1.64 mm2 surface area, 70 m thickness, and 0.71 mg mass.
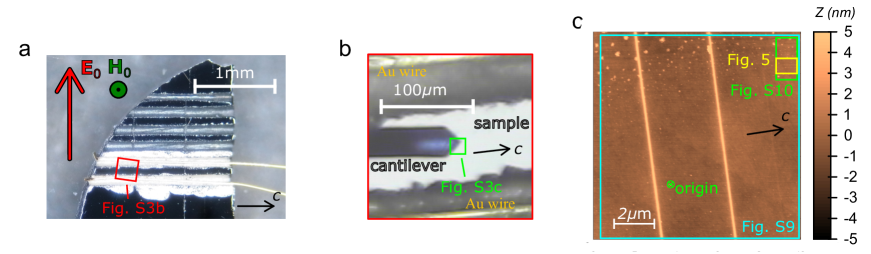
Photos of the sample for the -field dependent MFM measurements are presented in Fig. S3. The sample was prepared with the following method. First, high-quality surface needed for the experiment was obtained by mechano-chemical polishing with 0.050 m silica suspension on a BSCFAO sample with surface. Grooves were cut parallel to the axis in the surface with use of a wire saw (WS22, K.D. Unipress), and silver paste was used to form the electrodes and to fix gold wires. Distance between the electrodes in the present experiment is 80 m. During the poling procedure, the =3 MV/m and =4 kOe fields were applied within and perpendicular to the surface, respectively in the configuration, as shown in Fig. S3a.
Neutron diffraction measurements
Neutron diffraction measurements were performed on a thin plate (thickness 1 mm) of O2-annealed single crystals with 25 mm3 volume. Neutron diffraction profiles along direction at selected temperatures and the corresponding wavenumbers of the FE3, FE2’, ALC and PS magnetic orders are presented in Fig. S4a and S4b. In the paramagnetic phase, at =500 K, only the two nuclear reflections are present at =6 and =9. At =450 K, a strong magnetic peak appears at =7.5, which identifies the FE3 phase with commensurate =3/2 wavenumber (). At around =400 K, magnetic reflections with double-peak structure appear, corresponding to the commensurate =3/4 and incommensurate wavenumbers. These magnetic reflections represent the FE2’ and the ALC/PS phases, respectively. The wavenumber shows a weak and non-monotonous temperature dependence, while the wavenumbers of FE3 and the FE2’ phases remain fixed to commensurate positions (Fig. S4b).
In Fig. S4e, temperature dependence of the neutron diffraction integrated intensities is displayed. The spin structures of the FE3 and FE2’ phases are regarded as being composed of ferrimagnetic and cycloidal components that are parallel and perpendicular to the net magnetization direction, respectively, as depicted in Fig. 1 of Ref. S, 3. Therefore, the neutron intensities at and contain nuclear scattering and magnetic scattering from the ferrimagnetic component which has the same periodicity as the chemical lattice. As the temperature is decreased from 400 K to 300 K, the in-plane magnetization as well as the intensities at and are decreased, indicating that the =0 ferrimagnetic components are reduced. On the other hand, the magnetic reflections corresponding to the wave vectors of , and remain unchanged or rather increase in this temperature range, suggesting that the reduction of the intensities at and are ascribed solely to the disappearance of the FiM order. The gradual increase below 300 K can be explained by an increase of volume fraction of the FE2’ phase. In this series of Y-type hexaferrites, many previous studies have reported that PS or (alternating) longitudinal conical phase appears from the FiM phase as the temperature is lowered S (4, 5). Although it could be possible to consider that the FiM phase still survives at low temperatures, the volume fraction of the residual FiM phase is likely to be very small. Therefore, the FiM phase can simply be viewed as a collinear parent phase, from which PS/ALC or FE2’ emerges by spin canting or spin rotating at lower temperatures, and hence not relevant for the discussion on the observed magnetoelectric properties.
In Fig. S4f, half width at half maximum (HWHM) of each reflection is plotted against temperature. The nuclear peak serves as resolution limit for the HWHM of the magnetic peaks. As shown in Fig. S4f, the magnetic satellite peaks have larger HWHM than the nuclear peak, which implies the presence of magnetic domains. Moreover, respective magnetic satellite peaks have different HWHMs, indicating that the corresponding domain sizes may be different. If a third phase with multiple- existed instead of phase separation, these correlation lengths should have been the same value. Therefore, phase coexistence of single- magnetic phases is more likely.
MFM measurements after zero-field-cooling
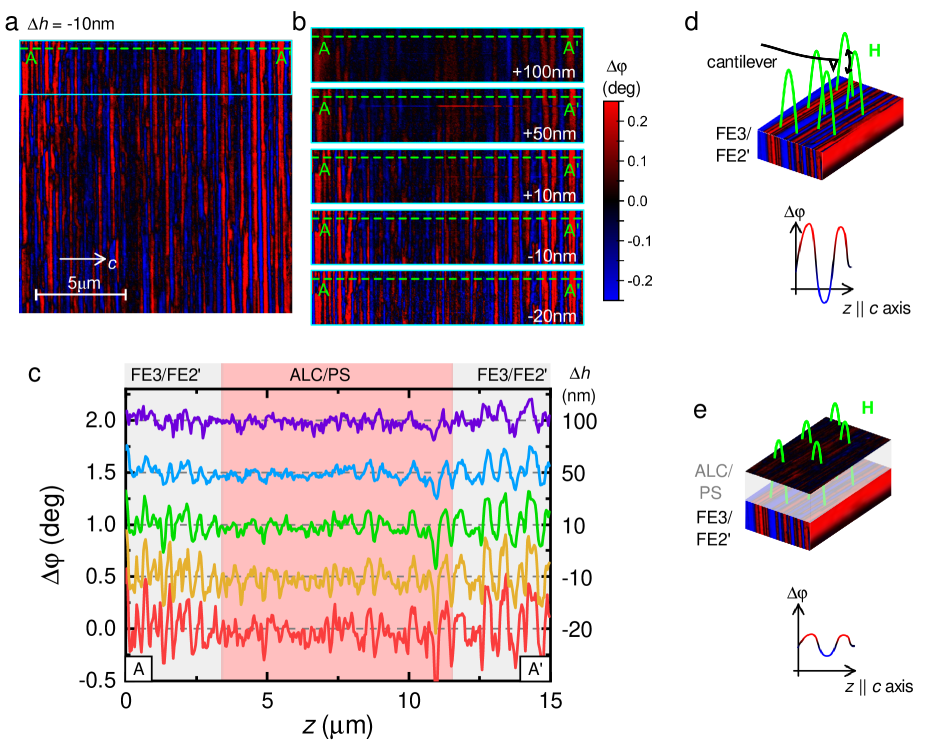
Zero-field MFM measurements were performed at room temperature on an O2 annealed sample with mechano-chemically polished surface. This sample is different from the one used for the -field dependent MFM experiments. Figures 1c and S5 demonstrate the spatial separation of the coexisting magnetic phases in BSCFAO. The striped regions correspond to the phase with large perpendicular to the surface of the sample (namely the FE3/FE2’), as the modulation of the MFM phase shift is large. On the other hand, the regions with low MFM signal are the incommensurate magnetic phases with small magnetization, namely the ALC/PS phases.
The magnetic phases were further investigated by changing the distance between the cantilever and the surface of the sample (, representing the difference in the cantilever height between the topography imaging and the MFM imaging). Figure S5b and S5c show the change in the MFM signal for different values of the . By increasing the distance from the surface, magnitude of the MFM signal decreases, however, this change is larger at those regions where the modulation is originally higher (Figs. S5b and S5c). This suggests that in the areas with low modulation, an FE3/FE2’ phase is buried beneath the the ALC/PS phase, as schematically illustrated in Figs. S5d and S5e.
In the present setup, the spatial resolution of the measurement is 30 nm, while the observed stripes have 200-300 nm in width along the axis and 10-20 m in length along the plane. Therefore it is justified to assume that the striped pattern observed by the MFM measurement represents the magnetic domain pattern, while precise determination of the thickness along the axis or the internal structures of the domain walls (DW) using MFM experiments alone is difficult.
Magnetic anisotropy
Information on the magnetic anisotropy is useful for the understanding of the magnetic domain and domain wall structures. The FE3 phase of BSCFAO has easy-plane magnetic anisotropy perpendicular to the crystallographic axis at =300 K (see Fig. S6a). When the magnetic field is rotated within the easy-plane (-plane), a six-fold modulation is expected in the angular dependence of the due to the trigonal crystal symmetry. As demonstrated in Figs. S6b and S6c, the magnetic anisotropy within the plane is negligibly small , where is the averaged magnitude of over 360∘. The six-fold modulation is as small as 0.1 of at 300 K and =1 kOe, where the system is in the FE3 phase, and remains less than 0.7 at =5 K. Therefore at room temperature, the net magnetic moment of the FE3 phase confined in the plane take arbitrary direction as a result of the small anisotropy within the plane.
Magnetoelectric poling procedure
Prior to the - and - measurements, a single-domain FE3 state was prepared by isothermal ME poling with fields applied in the ; configuration. In this poling procedure, the single-domain FE3 state is attained by decreasing the field, i.e. approaching from the high-field FiM phase, in the presence of field. In case of - measurements, MV/m and kOe poling fields were applied at =250 K, then the magnetic field was reduced to 5 kOe. After turning off the field, temperature was swept to the measurement temperature in the presence of the 5 kOe field. In case of - measurements, the MV/m and kOe poling fields were applied at the same temperature as the measurement was performed.
Measurement of -dependent polarization
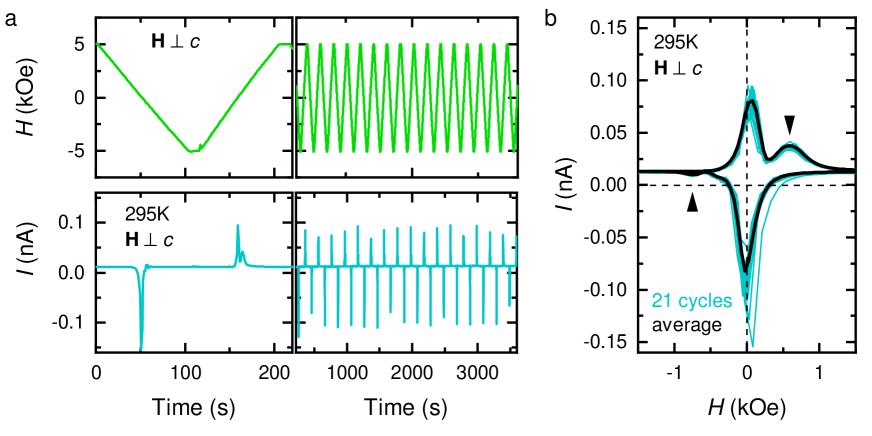
The spin-induced displacement current for repeated cycles at 295 K, used for the calculation of the - curve, is shown in Fig. S7. - measurements were started from a single domain ME state prepared by the isothermal poling procedure described before. The displacement current was monitored as the field was swept between 5 kOe with a rate of 100 Oe/s. When the is reversed from positive to negative, a large negative current peak was observed, indicating the reversal of the (Fig. S7a). For the sweep, current pulse with double-peak structure was detected, which is associated with the reversal of and the secondary hysteresis connected to the re-appearance of the FE3 phase. The displacement current was averaged for 21 cycles (orange curve) to obtain a single - loop (blue curve) in Fig. S7b, which was integrated to obtain , and the resultant - curve is presented in Fig. 3.
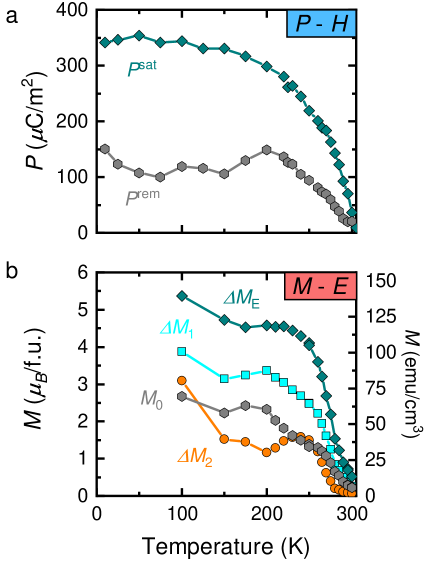
Temperature dependence of - and - properties in quasi-static measurement Figure S8 shows the temperature dependence of the direct and the converse ME effects obtained from the quasi-static measurements. The saturation () and remanent () values of the spin-induced , determined from - loops (see Fig. 3 and Fig. S7) are presented in Fig. S8a, while the initial , the , and changes, obtained from the - measurements (see Fig. 4c for the definitions), are shown in Fig. S8b. The - characteristics have different temperature dependence compared to the - characteristics, as discussed in the main text. and show gradual decrease towards 300 K, in contrast to , which completely disappears at 305 K. Magnitudes of the spin-induced and , as well as and are related to the volume fraction of the FE3 phase. However, and polarization values are those reversed by -field, and hence should be affected by the - coupling, while and are not since they are driven directly by pulsed -field, which explains the difference in the temperature dependence. Characteristic values associated with the - loops exhibit analogous temperature dependence between the quasi-static and pulsed field measurements. Moreover, the initial and the change follow similar temperature dependence to the and , respectively.
-field induced change in magnetic domains as revealed by MFM measurements
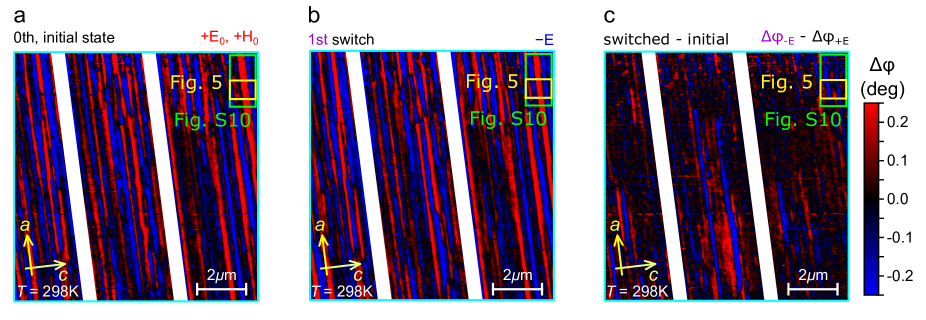
MFM measurements before and after the first application of field of 3 MV/m for the 1010 m2 area (shown in Fig. S3) are presented in Figs. S9a and S9b, respectively. The measurement was started from an ME-poled state with (,) fields in the ; configuration. Magnitudes of the poling fields were =3 MV/m and =4 kOe. Figure S9c shows the changes between the switched and initial images as a difference between the MFM phases. The two MFM data were brought to complete overlapping using the same feature in their corresponding topography images as a point of reference (origin in Fig. S3c). Although Figs. S9a and S9b look rather similar at a first glance, Fig. S9c highlights that there are many differences all over the measurement area, demonstrating that magnetic domains respond to the applied field, namely, there are many - clamped DWs.
Figure S10a shows the changes in the magnetic domain pattern for four consecutive applications of the field in a particular area with 12 m2 dimensions (see Fig. S3c). As described in the main text, the application of field causes several changes in the magnetic domain pattern. Firstly, the DW parallel to the plane shifts along the axis. The low anisotropy within the plane suggests that the net is gradually twisted along the axis within the DW. Secondly, a magnetization was reversed via the propagation of a DW within the plane. As the net of the FE3 phase is strongly confined to the plane, the local is twisted in a cycloidal manner within this type of DW. This type of DW is significantly wider (500 nm, see Fig. 5c in the main text) than the DWs between the stripe domains along the axis. Moreover, one example for reversible domain switching can be found in region R4 from the 2nd to the 4th switches in Fig. S10a. Both types of DW propagation contributes to the observed reversal, and the former can change the thickness along the axis of the domains, while the latter process can vary the area within the plane.
While there are many changes in the magnetic domain pattern, reversed magnetization is not so large at room temperature in the present compound. A possible explanation for this is provided by an example shown in Figs. S10b and S10c. In region R3, the MFM phase takes zero value in a broad area after the first application of field, and remains unchanged after the following switches. Figure S10d schematically illustrates what happens in this region. The DW between the FE3 (positive magnetization) and FE3 (negative magnetization) domains is turned into the ALC/PS state. It is possible that the ALC/PS phase never returns to the FE3 phase in response to field, therefore the - controllability is gradually deteriorated.
References
- S (1) Hirose, S., Haruki, K., Ando, A. & Kimura, T. Effect of high-pressure oxygen annealing on electrical and magnetoelectric properties of BaSrCo2Fe11AlO22 ceramics. J. Am. Ceram. Soc. 98, 2104-2111 (2015).
- S (2) Inaguma, Y., et al. Synthesis and dielectric properties of a perovskite Bi1/2Ag1/2TiO3. Ferroelectrics 264, 127 (2001).
- S (3) Nakajima, T., et al. Magnetic structures and excitations in a multiferroic Y-type hexaferrite BaSrCo2Fe11AlO22. Phys. Rev. B 94, 195154 (2016).
- S (4) Lee, H. B., et al. Field-induced incommensurate-to-commensurate phase transition in the magnetoelectric hexaferrite Ba0.5Sr1.5Zn2(Fe1-xAlx)12O22. Phys. Rev. B 83, 144425 (2011).
- S (5) Lee, H. B., et al. Heliconical magnetic order and field-induced multiferroicity of the Co2Y-type hexaferrite Ba0.3Sr1.7Co2Fe12O22. Phys. Rev. B 86, 094435 (2012).