NuSTAR MEASUREMENT OF CORONAL TEMPERATURE IN TWO LUMINOUS, HIGH REDSHIFT QSOs
Abstract
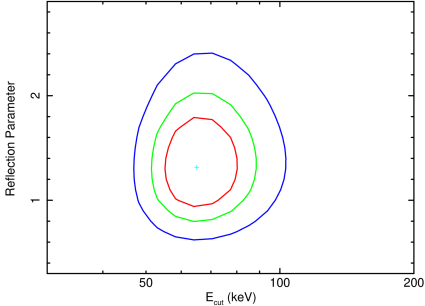
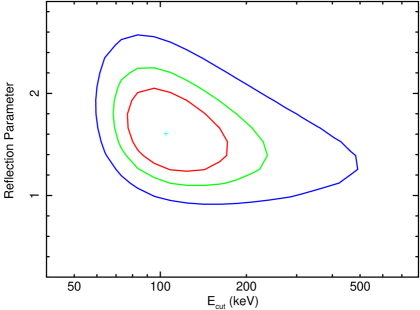
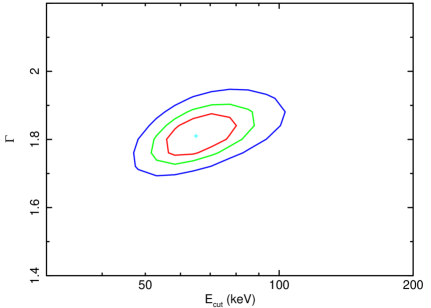
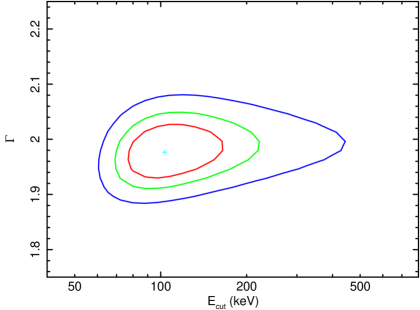
X-ray emission from AGN is believed to be produced via Comptonization of optical/UV seed photons emitted by the accretion disk, up-scattered by hot electrons in a corona surrounding the black hole. A critical compactness vs. temperature threshold is predicted above which any increase in the source luminosity, for a fixed size, would then generate positron-electron pairs rather than continue heating the coronal plasma. Current observations seem to confirm that all AGN populate the region below this critical line. These models, however, have never been probed by observations in the high-luminosity regime, where the critical line is expected to reach low temperatures. To fill this observational gap, we selected two luminous (log() erg/s) quasars, 2MASSJ1614346+470420 (z=1.86) and B1422+231 (z=3.62), and obtained XMM–Newton and NuSTAR deep observations for them. We performed detailed spectral analysis of their quasi-simultaneous soft and hard X-ray data, in order to constrain the parameters of their coronae. Using a phenomenological cut-off power-law model, with the inclusion of a reflection component, we derived rest-frame values of the high energy cut-off of keV and keV, respectively. Comptonization models consistently give as best-fit parameters electron temperatures of keV and keV, respectively, and optically thick coronae (). These low coronal temperatures fall in the limited region allowed at these luminosities to avoid runaway pair production.
iint \savesymboliiint \restoresymbolTXFiint \restoresymbolTXFiiint
1 Introduction
The primary X-ray emission in active galactic nuclei (AGN) is believed to be produced via Comptonization: optical/UV thermal photons emitted by the accretion disk are up-scattered by electrons in a hot ( K) corona surrounding the super-massive black hole (SMBH) (Haardt & Maraschi 1993). The resulting spectrum can be described as a cut-off power-law with a photon index and a high-energy cut-off (at energies around a few hundred keV) that depends on the electron temperature () and the optical depth () of the corona.
The characterization of the X-ray emission from AGN is therefore the best tool available to investigate the physical properties of the innermost regions around accreting SMBHs and to measure coronal properties such as temperature, optical depth and geometry. Recent X-ray reverberation studies (De Marco et al. 2013, Reis & Miller 2013, Cackett et al. 2014, Kara et al. 2016) suggest that the size of the hot corona producing the X-rays is in the range , where is the gravitational radius for a black hole of mass M. Such a range has also been independently confirmed via microlensing studies (e.g. Pooley et al. 2007, MacLeod et al. 2015, Chartas et al. 2016).
Since interactions between high-energy photons in compact systems produce electron-positron pairs, it was soon realized that pair production in AGN coronae may act as an effective thermostat (e.g., Svensson 1984, Stern et al. 1995). In fact, any rise in electron temperature or compactness (Cavaliere & Morrison 1980)111The dimensionless compactness is defined as the luminosity L over the size R of the emitting region, above a critical curve in the temperature-compactness plane, the so called “pair line”, would result in a runaway pair production, causing the temperature to drop.
Early studies were based on high-energy X-ray missions such as CGRO, BeppoSAX, Integral, Swift-BAT and Suzaku, mounting non-imaging instruments whose ability to obtain high S/N spectra and measure spectral cut-offs were limited to bright nearby sources ( ergs s cm). Yet, they showed that local Seyfert galaxies exhibit coronae with a broad range of temperatures (=50-500 keV, Perola et al. 2002, Dadina et al. 2008, Vasudevan et al. 2013, Malizia et al. 2014) in the luminosity range erg/s.
| Target | log | Edd. | XMM–Newton | NuSTAR | |||
| (erg/s) | (ks) | (ks) | |||||
| (1) | (2) | (3) | (4) | (5) | (6) | (7) | (8) |
| B1422 | 3.62 | 20 | 47.15 | 9.7 | 0.21 | 25 | 85 |
| 2MASSJ16 | 1.86 | – | 47.79 | 9.8 | 0.71 | 69 | 140 |
Notes. (1) Target Name, (2) Redshift, (3) Lensing factor (4) Log. of the Bolometric luminosity, (5) Log. of the SMBH mass in , (6) Eddington ratio, defined as /, (7) XMM–Newton-pn cleaned exposure time, (8) NuSTAR cleaned exposure time. Assef et al. (2011), derived from the de-lensed (20% conservative error estimate), from H. Shen et al. (2011), from Mg ii.
NuSTAR (Harrison et al. 2013) is now providing a major advance in the understanding of AGN coronae. Its bandwidth is limited to keV, but its sensitivity is orders of magnitude better than previous missions, allowing accurate measurements of the cut-off in local AGN. Fabian et al. (2015, F15 hereafter) compiled a list of all high-energy cut-offs measured by NuSTAR and investigated the vs. relation in detail. The temperature was derived assuming as found by Comptonization models for optically thin coronae (e.g. Petrucci et al. 2001) and was generally assumed to be . Most sources were found to be below the vs. critical line defining the region forbidden by the onset of pair production.
In general it is difficult to tightly constrain cut-off values exceeding the observed band pass (Parker et al. 2015) except for sources with very high photon statistics (see e.g. Matt et al. 2015, García et al. 2015). NuSTAR measurements, all performed so far in nearby () low luminosity log erg/s AGN, are in fact limited by the NuSTAR band-pass ( keV).
Therefore the high-, high- regime has never actually been probed. However, thanks to its greater sensitivity, NuSTAR is now capable of testing runaway pair-production models by measuring coronal properties in high redshift, high luminosity QSOs where larger values can be constrained thanks to the cosmological redshifting of the cut-off downward in observed-frame energy.
We present here the first firm measurement of in two high-redshift (), high-luminosity ( erg s) QSOs. The paper is organized as follows: Sec. 2 describes the target selection, Sec. 3 the data reduction. In Sec. 4 we report the different spectral models adopted and in Sec. 5 we summarize our results. We adopt the cosmological parameters km s Mpc, and . Errors are given at 90% confidence level.
2 Target selection and observations
In order to select luminous QSOs, bright enough in the X-ray band to allow for a good characterization of the high energy cut-off, we considered all known QSOs with ergs s cm at spectroscopic redshift , both lensed and non-lensed sources.
Lensed AGN were selected from the CASTLES catalog222See https://www.cfa.harvard.edu/castles. The brightest lensed source in this catalog is B1422+231 (B1422 hereafter). The lensing factor is estimated to be (Assef et al. 2011).
As for non lensed sources, we searched for the brigthest QSOs by cross-correlating the X-ray point-source catalogs from Chandra, XMM–Newton and ROSAT (CSC v2, 3XMM-DR6 and RASS-BSC), with the 12th SDSS-III data release. The brightest one is 2MASSJ1614346+470420 (2MASSJ16 hereafter). These two sources (B1422 and 2MASSJ16) were observed quasi-simultaneously with XMM–Newton and NuSTAR in 2017 as part of a NuSTAR Cycle 3 program (PI Lanzuisi)333B1422 has also been observed with Chandra several times, for a total of 125ks, the most recent one being in 2012. In order to avoid long-term variability issues (see e.g. Lanzuisi et al. 2016) we focus our analysis on the coeval XMM–Newton and NuSTAR data.. Their properties are summarized in Table 1.
We note that B1422 is classified as moderately radio loud (, Dadina et al. 2016) with a steep radio continuum (, Orienti et al. 2007), indicating that the source is highly inclined in the plane of the sky. In this case, the radio emission should be dominated by the lobes, and not by the jet, and the X-ray spectrum is not strongly contaminated by the jet component (see discussion in Dadina et al. 2016).
3 Data reduction
B1422 was observed by XMM–Newton on 2017-12-29 for 38 ks and by NuSTAR on 2017-12-30 for 101 ks. 2MASSJ16 was observed by XMM–Newton on 2017-08-05 for 98 ks, and followed up by NuSTAR on 2017-08-28 and 2017-10-09 for 106 and 48ks, respectively.
For both sources, XMM–Newton EPIC data were reduced using the standard software SAS v.16.1444https://www.cosmos.esa.int/web/xmm-newton/sas. A filter for periods of high background rate was adopted using a threshold of 0.5 and 0.2 counts per seconds in the 10-12 keV band, for pn and MOS, respectively. We selected only events corresponding to single and double pixel events (pattern 0-4 and 0-12 for pn and MOS respectively). The source spectra were extracted from circular regions of 40” radius, corresponding to encircled energy fraction. The background spectra were extracted from an area times larger than the source region, surrounding the QSO. The final exposure times were 25ks pn (35ks MOS) for B1422 and 69ks pn (84ks MOS) for 2MASSJ16.
The NuSTAR data were processed using the NuSTAR Data Analysis Software package (NuSTARDAS) v.1.8.0 within Heasoft v. 6.20 tools555https://heasarc.nasa.gov/lheasoft/. Calibrated and cleaned event files were produced using the calibration files in the NuSTAR CALDB (version 20170727) and standard filtering criteria with the Nupipeline task. We checked for high background period using the nustar_filter_lightcurve IDL script666https://github.com/NuSTAR/nustar-idl. The two NuSTAR observations for 2MASSJ16 were taken at 40 days distance, and we verified that no significant variability was detected before merging the two data-sets with standard Heasoft tools. The final, cleaned NuSTAR exposure times are 85ks for B1422 and 140ks for 2MASSJ16.
In order to reduce the background and increase the spectral signal to noise at high energies, we tested different extraction regions, and finally adopted a region of 40” radius, corresponding to of the encircled energy fraction for the NuSTAR PSF (An et al. 2014). This allowed us to detect the source at in the keV band in both sources, and better sample the high-energy range.
4 Spectral modeling
The final spectra have and total, 0.3-10 keV XMM–Newton counts and 1800 and 2300 total, 3-50 keV NuSTAR counts for B1422 an 2MASSJ16, respectively. The spectral modeling is performed with the package Xspec v. 12.9.1, using the the C-stat statistic (Cash 1979), and binning the spectra to 5 counts per bin, since NuSTAR spectra are in the low-counts regime. Given the quality of the available data we choose not to include in our analysis complex models such as relativistic reflection. All the models described below are modified by a Galactic column density of cm for B1422 and cm for 2MASSJ16, respectively (Kalberla et al. 2005).
4.1 Phenomenological model
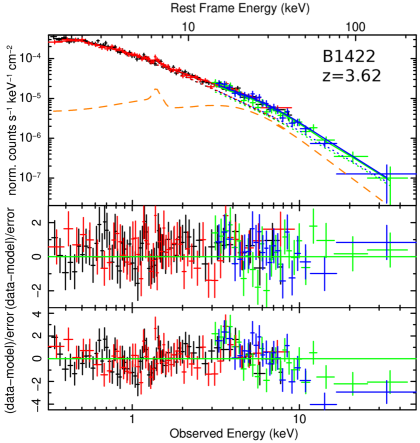
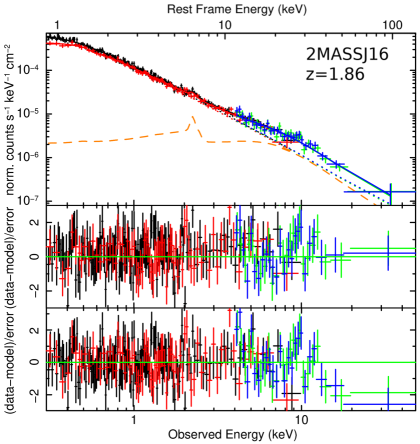
As a first step we fitted the XMM–Newton and NuSTAR spectra for both sources with a phenomenological model: a power-law with an exponential high-energy cut-off and Compton reflection from cold material in a slab geometry, including emission lines (model Pexmon in Xspec, Nandra et al. 2007). The intensity of the reflection is parametrized with R, defined as the solid angle covered by the cold, reflecting material, as visible from the Comptonizing source, in units of .
Given the possible degeneracy between spectral slope, intensity of the reflection and high-energy cut-off (Perola et al. 2002), all these component must be fitted simultaneously. The free parameters of the model are, therefore, the power-law photon index ; the high-energy cut-off ; the reflection parameter R and the continuum normalization. In neither source intrinsic cold absorption in addition to the Galactic value is required.
The model is the same for all the four data sets (pn, MOS1+MOS2777MOS1 and 2 spectra merged, and response matrices averaged with standard HEASARC ftools, http://heasarc.gsfc.nasa.gov/ftools/. and NuSTAR FPMA and FPMB) and a flux cross-calibration is applied between the different instruments with values always smaller than (the spectral slopes obtained fitting each instrument separately are consistent within errors).
We fixed all element abundances to solar values and fixed the inclination angle to . We tested that adopting a different inclination angle has a limited impact on the resulting (few % difference for and ), while it has a strong impact on the reflection parameter: R is a factor lower (higher) for ().
As can be seen from Fig. 1 (top left and right), the phenomenological model is able to fully reproduce the broa-band spectrum of both QSOs, and the NuSTAR data are crucial to constrain the high-energy cut-off of the continuum. The best-fit continuum parameters are summarized in Tab. 2.
| Target | R | log | C | C/C | ||||
| keV | ( cgs) | (erg/s) | ||||||
| (1) | (2) | (3) | (4) | (5) | (6) | (7) | (8) | (9) |
| B1422 | 45.30 | 1.03 | 1.02/1.11 | 1637/1668 | ||||
| 2MASSJ16 | 45.97 | 0.94 | 1.09/1.12 | 1705/1735 |
Notes. (1) Target Name, (2) photon index, (3) high energy cut-off in keV, (4) reflection parameter, (5) Observed XMM–Newton 0.5-10 keV flux in erg s cm, (6) Log. of the intrinsic (de-lensed) 2-10 keV luminosity in erg/s, (7) XMM–Newton MOS cross calibration with respect to pn, (8) NuSTAR FPMA/FPMB cross-calibration with respect to pn, (9) of the best-fit.