The composite nature of Dust-Obscured Galaxies (DOGs) at z2-3 in the COSMOS field: II. The AGN fraction
Abstract
We present the X-ray properties of 108 Dust-Obscured Galaxies (DOGs; F24μm/F 1000) in the COSMOS field, all of which detected in at least three far-infrared bands with the Herschel Observatory. Out of the entire sample, 22 are individually detected in the hard 2-8 keV X-ray band by the Chandra COSMOS Legacy survey, allowing us to classify them as AGN. Of them, 6 (27%) are Compton Thick AGN candidates with column densities NH1024 cm-2 while 15 are moderately obscured AGNs with 1022 NH 1024 cm-2. Additionally, we estimate AGN contributions to the IR luminosity (8-1000m rest-frame) greater than 20% for 19 DOGs based on SED decomposition using Spitzer/MIPS 24m and the five Herschel bands (100-500 m). Only 7 of these are detected in X-rays individually. We performed a X-ray stacking analysis for the 86 undetected DOGs. We find that the AGN fraction in DOGs increases with 24m flux and that it is higher than that of the general 24m population. However, no significant difference is found when considering only X-ray detections. This strongly motivates the combined use of X-ray and far-IR surveys to successfully probe a wider population of AGNs, particularly for the most obscured ones.
1 Introduction
Pioneering work with the Infrared Astronomical Satellite (IRAS) and the Infrared Space Observatory (ISO) established that at low redshifts the most luminous infrared (IR) sources tend to be increasingly dominated by active galactic nuclei (AGNs; Lutz et al., 1998; Genzel et al., 1998). However, at higher redshifts the high luminosity of ultra-luminous IR galaxies (ULIRGs; L1012 L) is not yet fully understood and significant diversity in the AGN-to-starburst ratio (e.g., Sanders, 1999; Joseph, 1999; Desai et al., 2007; Menéndez-Delmestre et al., 2009; Sani et al., 2010; Petric et al., 2011; Pozzi et al., 2012) remains a critical difficulty in our understanding of these sources. In an effort to address this and other questions, Dey et al. (2008) put forward color-based criteria to efficiently define a statistically-significant sample of dusty ULIRGs at z1.5-3. By taking advantage of the unprecedented sensitivity and angular resolution at IR wavelengths of the Spitzer Space Telescope, they selected a population of optically-faint (2227) and mid-IR bright (F24μm 0.3 mJy) “Dust Obscured Galaxies” (DOGs), defined as those sources having F24μm/FR1000.
The efficient selection of dust-obscured sources at high redshifts also had great impact on the search for hidden AGNs. Although X-ray surveys are a powerful tool to select unobscured and mildly-obscured AGNs, the current census of actively-growing supermassive black holes remains far from complete (e.g, Treister et al., 2004; Worsley et al., 2005; Tozzi et al., 2006; Page et al., 2006; Fiore et al., 2009; Juneau et al., 2011, 2013). The most obscured AGNs, in particular the deeply-embedded ones, are mostly absent in X-ray surveys. At these high column densities, the attenuation of X-rays is mainly due to Compton-scattering rather than photoelectric absorption; these sources are the so-called “Compton-thick” (CT) AGNs (NH 1.5 1024 cm -2), of which only a few have been identified in the local Universe (Burlon et al., 2011; Ricci et al., 2015, and references therein). At higher redshifts, hundreds of CT AGN candidates have been identified in X-rays thanks to XMM and Chandra observations at E10 keV (e.g., Comastri et al., 2011; Feruglio et al., 2011; Brightman et al., 2014; Buchner et al., 2015; Baronchelli et al., 2017) and NuSTAR data at higher X-ray energies (e.g., Civano et al., 2015; Mullaney et al., 2015; Lansbury et al., 2017).
While in principle CT sources are just the high obscuration end of the AGN population, recent studies have shown that they might represent a different and fundamental stage in setting up the super massive black hole (SMBH) growth-galaxy evolution connection. Indeed, Ricci et al. (2017) shows that there is a clear excess in the relative number of CT AGN in the last stages of major galaxy mergers, consistent with this being one of the early phases of rapid SMBH growth triggered by a major galaxy merger. Furthermore, a significant fraction of missed Compton thick accretion might hide an important part of the census of SMBH growth across cosmic history. Indeed, a significant fraction of heavily obscured and CT sources are invoked at all redshifts in order to reproduce the observed Cosmic X-ray Background (CXRB) at 20-30 keV (e.g., Comastri et al., 1995; Gilli et al., 2001; Ueda et al., 2003; Treister & Urry, 2005; Ballantyne et al., 2006; Gilli et al., 2007; Ueda et al., 2014). However, the exact number of CT sources required by the CXRB is still heavily debated and ranges from 30% (Gilli et al., 2007) to 10% (Treister et al., 2009a; Ballantyne et al., 2011). Hence, determining the space density of CT AGN remains a critical open issue in our understanding of the role of SMBH for galaxy evolution. Although a large proportion of the obscured AGN population still remains undetected, these objects can already account for a significant fraction of the total SMBH growth (70%; Treister & Urry 2005). Indeed, AGN synthesis models that can explain the spectral shape and intensity of the CXRB predict a large volume density of heavily obscured and CT AGNs to reconcile the “active” and “relic” SMBH mass functions (e.g., Gilli et al., 2001; Treister et al., 2004; Marconi et al., 2004; Treister & Urry, 2005; Gilli et al., 2007; Akylas et al., 2012).
Since it is clear then that X-ray surveys are not sufficient to probe the complete AGN population, alternative selection techniques have been developed. Recent work by Riguccini et al. (2015) showed that a sub-sample of DOGs with far-IR (100–500m) detection have a significant contribution from AGN activity at higher luminosities (Riguccini et al., 2015). This is consistent with recent work on mid-to-far IR Spectral Energy Distributions (SEDs) of luminous AGNs that have found that a higher AGN contribution in the far-IR, particularly at high AGN luminosities (e.g., Symeonidis et al., 2016; Symeonidis, 2017). Because they are selected based on their far-IR output i.e., at longer wavelengths than the AGNs selected by near-through-mid IR surveys far-IR selected DOGs can potentially represent a distinctly-defined population of AGN candidates.
Previous studies (e.g., Fiore et al., 2009; Treister et al., 2009b) have focused on selecting sizable samples of high luminosity CT AGNs to measure accurately their volume density and to understand whether their obscuration properties are similar to those of lower luminosity AGNs. In this work we adopt the following approach: based on a far-IR selection of DOGs with information on their AGN contribution (from a far-IR perspective) we exploit the Chandra COSMOS Legacy Survey (Civano et al., 2016) to assess the AGN fraction in DOGs using the most recent and exquisite combination of far-IR and X-ray data. Our main aim is to quantify the AGN fraction in this population of far-IR DOGs using a multi-wavelength approach based on X-ray flux measurements and broad-band SED fitting.
The paper is organized as follows: we describe our data in Sect. 2 and our results in Section 3. More detailed analysis and discussion are presented in Section 4 while our conclusions are summarized in section 5. Throughout this paper we assume a CDM cosmology with H0=70 km s-1, = 0.3, and = 0.7. Unless otherwise specified, magnitudes are given in the AB system.
2 Data
2.1 Far-IR
As a reference to build our parent sample, we use the catalogues provided by the PEP and HerMES Herschel surveys (Berta et al., 2011; Roseboom et al., 2010) to identify far IR-selected DOGs in the COSMOS field, detected in at least 3 of the 5 Herschel bands (cf Table 1 for a detailed explanation of the different selections). Those catalogues calculate source fluxes in each of the five Herschel bands by performing point spread function fitting at the positions of the 24m-detected sources from Le Floc’h et al. (2009). Our total sample hence contains 108 far-IR detected DOGs.
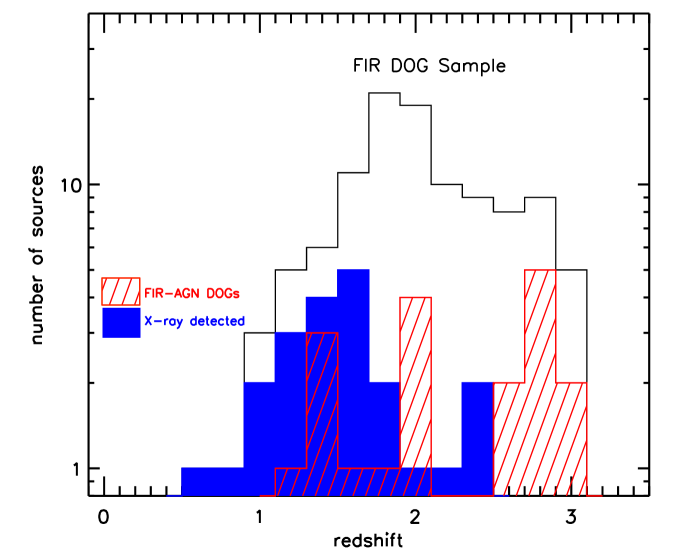
Among our sample of 108 far-IR selected DOGs, 22 sources have spectroscopic redshifts from Salvato et al. (in prep.). For the rest of our sample, we use the photometric redshifts determined by Riguccini et al. (2015) for their 95 DOGs based on SED fitting using the optical catalog of Ilbert et al. (2009) to access the photometry of these sources in the optical bands. We re-analyze the AGN contributions for these 22 DOGs using their spectroscopic redshifts, based on the approach described in Riguccini et al. (2015). Fig. 1 shows the redshift distribution of our sample of 108 far-IR detected DOGs, which include 22 DOGs with spectroscopic redshifts and 86 DOGs with photometric redshifts.
2.2 X-ray Data
We use the Chandra COSMOS Legacy Survey (Civano et al., 2016) to obtain the X-ray counterparts for the far-IR sources in our sample. The Chandra COSMOS Legacy Survey covers a total area of 2.2 deg2, uniformly covering the 1.7 deg2 COSMOS/HST field at a 160 ksec depth, expanding on the deep C-COSMOS area (1.45 vs 0.44 deg2) by a factor of 3 at 31016 erg cm-2 s-1. The deeper and wider coverage of the Chandra COSMOS Legacy survey compared to previous X-ray observations of the COSMOS field (e.g., Brusa et al., 2010, 2007; Salvato et al., 2009) allows us to detect new X-ray DOGs that have been missed by previous X-ray surveys.
From a two arc-second cross-match between the 108 far-IR detected DOGs and the Chandra COSMOS Legacy data (Civano et al., 2016) we identify X-ray counterparts for 22 of the sources in our sample, with a median X-ray flux of 10-16 erg s-1 in the soft band (0.5-2 keV). From these 22, 9 are detected in X-rays for the first time thanks to the increased field coverage of the Chandra COSMOS Legacy Survey. Riguccini et al. (2015) associated Herschel sources with their optical counterparts using Ilbert et al. (2009) and had then access to the ID from Capak et al. (2007); see Riguccini et al. (2015) for details on the matching method. As a sanity check, we cross-matched our results with the multi wavelength catalog (X-ray to near-IR) from Marchesi et al. (2016) and found the same optical ID.
3 Results
3.1 Source Classification
Taking advantage of the far-IR data, the AGN and host galaxy contributions to the total IR flux have been constrained by Riguccini et al. (2015) for 95 out of the 108 far-IR selected DOGs. They use the IDL-based SED-fitting procedure DecompIR, detailed in Mullaney et al. (2011) and combine 8 host-galaxy templates detailed in Riguccini et al. (2011) with an average AGN template. The validity of this procedure and of the AGN contributions to the IR luminosity obtained are discussed in Mullaney et al. (2011) and Riguccini et al. (2011). Riguccini et al. (2015) found that 75% of the far-IR DOGs are consistent with being dominated by star formation, while 16% have a far-IR output with a significant contribution from an AGN (i.e. contribution from an AGN to the host galaxy20%). The SED fitting procedure failed for their remaining 9 DOGs (out of their sample of 95 DOGs), probably due to uncertainties in redshift, even after probing the different possibilities indicated by the PDF. We note that Riguccini et al. (2015) focused their work on the subsample of DOGs a priori associated with star formation, systematically excluding the DOGs already-known to be AGNs with X-ray detections down to a flux limit of S0.5-2keV = 5 10-16 erg cm2 s-1. For the remainder of the paper DOGs that are dominated by star-formation following the SED-fitting decomposition procedure (i.e. labelled “host” in Table 2) will be named SF-DOGs while the DOGs with a 20% contribution to the IR 8-1000 m luminosity, derived according to the SED-fitting decomposition procedure (i.e. labelled “AGN” in Table 2), will be referred as far-IR AGN-DOGs.
We decompose the far-IR SED of the 22 X-ray detected DOGs into AGN and host galaxy components following the procedure described in Riguccini et al. (2015). Amongst these 22 X-ray DOGs, 9 of them have been included in Riguccini et al. (2015); however, taking advantage of the recent availability of spectroscopic redshifts for 22 of these we re-analyzed the SEDs of these sources. In the case of source DOG11 the re-analysis allowed for a satisfactory SED decomposition (in contrast with Riguccini et al., 2015), enabling us to classify it as dominated by a host galaxy component.
We find that only 7 out of the 22 X-ray detected DOGs are classified as AGNs based on their far-IR SED, i.e. AGN fraction 20%, cf Riguccini et al. (2015). With the exception of one source that could not be properly decomposed using this procedure most likely due to a wrong redshift, the remaining X-ray detected DOGs (2/3 of the sample) are all classified as dominated by a host galaxy SED component.
| 108 | DOGs with 80Jy and with a 3- detection in the 2 PACS bands and with a 3- detection in at least one of the 3 SPIRE bands |
|---|---|
| Sample used for the remainder of the paper | |
| Hereafter far-IR DOGs | |
| 19 | far-IR AGN-DOGs following the far-IR SED-fitting analysis from Riguccini et al. (2015) |
| 83 | far-IR DOGs with (e.g., Fiore et al., 2008, 2009) |
| 2 | far-IR AGN-DOGs but with |
| 22 | far-IR DOGs with an X-ray detection in the Chandra COSMOS Legacy survey (Civano et al., 2016) |
| 7 | far-IR DOGs with an X-ray detection in the Chandra COSMOS Legacy survey (Civano et al., 2016) have been classified as AGN-DOGs following the same procedure than in Riguccini et al. (2015) |
| 6 | potential Compton Thick AGN (NH 1024 cm-2) but only 2 of them are labelled far-IR AGN DOGs |
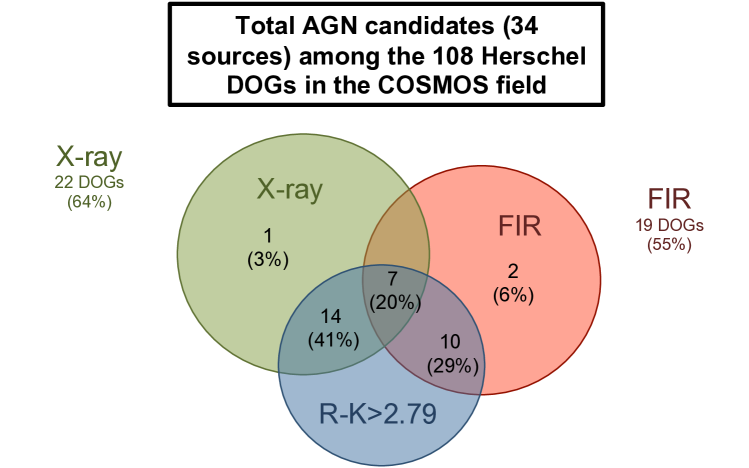
A summary of the AGN selections and the overlap between the different AGN criteria can be found on the Venn diagram presented on Fig. 2. The numbers are expressed with respect to the total number of AGN candidates among the Herschel DOG population, i.e. the AGN candidates selected from a hard X-ray detection and from the SED-fitting decomposition using FIR data.
3.2 X-ray Properties
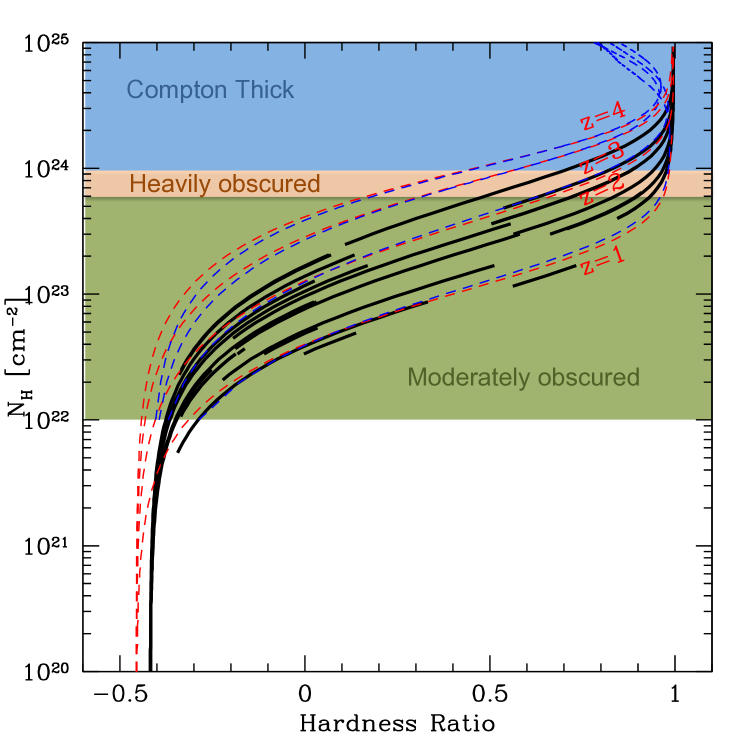
The X-ray properties of the 22 DOGs individually detected by Chandra are described in Table 2. Given the faint X-ray fluxes, which yield a relatively low number of counts, detailed fitting to the observed X-ray spectrum is not possible for the majority of these sources. However, we can estimate the neutral hydrogen column density along the line of sight () from the observed X-ray count rate, following the procedure described by Treister et al. (2009b). Briefly, this is done by assuming that the intrinsic spectrum is a power-law with spectral index =1.9 in agreement with the observed average AGN spectrum (e.g., Nandra & Pounds, 1994) and computing the expected hardness ratio (HR). In the case of Chandra, the observed HR is defined as (-)/(+), with defined as the count rate in the soft X-ray band (0.5-2 keV) and as the count rate in the hard band (2-8 keV). The expected HR is computed for each source individually considering the redshift of the source and a range in photoelectric absorption parametrized by the value. The corresponding value is then obtained by comparing the observed HR with the predicted ones. For mildly obscured sources, this is the same procedure followed by Marchesi et al. (2016) when there are fewer than 30 counts detected. For heavily obscured and CT sources, the observed X-ray spectrum can be more complicated than the simple power law and photoelectric absorption assumed before (e.g., Matt et al., 2000; Arévalo et al., 2014; Bauer et al., 2015). Hence, we further consider the predicted -HR relations using the physically-motived X-ray spectral libraries from Murphy & Yaqoob (2009), the so-called MYTorus models, which were not considered by Marchesi et al. (2016). The hence-derived values are presented in Table 2 and Figure 3.
| DOG ID | X-ray ID | SED-fitting | ra | dec | redshift | HR | NH | Lir |
|---|---|---|---|---|---|---|---|---|
| flag | 1022 cm-2 | (L⊙) | ||||||
| 9 | lid 3606 | host | 149.932 | 1.626 | 1.42 | 0.75 | 58.4 – 927 | 7.2 1011 |
| 11 | lid 2467 | host | 149.952 | 1.744 | 1.63 | -0.36 | 0.01 – 12.7 | 2.0 1012 |
| 42 | lid 4354 | host | 149.478 | 2.133 | 1.58 | 0.12 | 4.46 – 36.3 | 9.8 1011 |
| 56 | lid 2346 | host | 149.733 | 2.335 | 1.58 | -0.90 | 0.0 – 0.0 | 1.1 1012 |
| 60 | lid 3101 | host | 150.507 | 2.598 | 1.27 | 0.86 | 39.9 – 927 | 6.9 1011 |
| 73 | lid 319 | AGN | 150.426 | 2.725 | 1.20 | -0.04 | 5.39 – 8.69 | 5.0 1011 |
| 74 | lid 3055 | AGN | 150.021 | 2.775 | 2.09 | 0.62 | 30.0 – 927 | 7.3 1011 |
| 80 | lid 3931 | AGN | 149.562 | 2.696 | 1.89 | 0.65 | 36.3 – 103 | 1.1 1012 |
| 81 | lid 1806 | host | 149.682 | 2.652 | 2.34 | -0.13 | 2.29 – 20.5 | 1.5 1012 |
| 95 | lid 306 | host | 150.379 | 2.735 | 0.92 | 0.06 | 3.35 – 4.90 | 4.2 1011 |
| 96 | cid 201 | AGN | 149.906 | 1.917 | 1.49 | -0.25 | 1.07 – 3.35 | 6.7 1011 |
| 97 | cid 817 | host | 150.063 | 1.945 | 2.15 | -0.19 | 0.01 – 20.5 | 1.7 1012 |
| 98 | cid 1467 | host | 149.837 | 1.972 | 1.02 | -0.02 | 0.55 – 8.69 | 6.5 1011 |
| 99 | lid 2663 | – | 149.779 | 1.586 | 1.24 | 0.08 | 2.08 – 16.9 | -99 |
| 100 | cid 1091 | host | 150.106 | 2.014 | 1.88 | -0.16 | 0.34 – 16.9 | 2.8 1012 |
| 101 | lid 1646 | AGN | 150.787 | 2.151 | 1.47 | -0.17 | 3.35 – 3.68 | 3.7 1011 |
| 102 | lid 1565 | AGN | 150.547 | 1.619 | 1.59 | -0.30 | 0.88 – 2.52 | 6.5 1011 |
| 103 | lid 3587 | AGN | 149.931 | 1.735 | 1.43 | 0.77 | 30.0 – 64.3 | 9.4 1011 |
| 104 | cid 476 | host | 150.475 | 2.094 | 0.56 | 0.21 | 3.35 – 3.35 | 6.0 1011 |
| 105 | cid 593 | host | 150.472 | 2.324 | 0.89 | 0.64 | 11.6 – 16.9 | 3.3 1011 |
| 106 | cid 92 | host | 150.288 | 2.382 | 1.58 | -0.50 | 0.01 – 2.52 | 2.9 1012 |
| 107 | cid 1917 | host | 149.998 | 2.578 | 2.42 | 0.03 | 24.8 – 927 | 4.3 1012 |
NOTE: SED-fitting flag is based on far-IR SED decomposition (see Riguccini et al. 2015 for details).
As can be seen, there are no major differences between the simple obscured power law and the MYTorus models for moderately obscured sources, 1023 cm-2, up to 2, where most of our sources are located. However, as it is expected, MYTorus predict in general lower HR values (softer X-ray spectra) for CT sources. This implies that just using the hardness ratio it is hard to discriminate a heavily obscured 51023 cm-2 from a CT, 1024 cm-2, source. However, given the low number of counts detected for the X-ray sources in our sample, this procedure is the best we can do to attempt to identify CT AGN.
According to the X-ray classification based on the derived values, 6 out of the 22 X-ray detected DOGs (i.e. 27%) are plausible CT AGNs, namely DOG# 9, 60, 74, 80, 103 and 107. This is strictly an estimate, since as shown in Fig. 3, sources with a HR in the 0.6-0.8 range can either be moderately/heavily obscured at few1023 cm-2 or CT. Further, using this classification scheme, 15 are considered as moderately-obscured AGNs, while only one of the X-ray detected DOGs has a low HR (DOG 56) consistent with being unobscured. The fraction of CT AGNs that we find in our sample is in good agreement with previous reports. For example, Georgakakis et al. (2010) found that the X-ray spectral properties of a sample of “low-redshift DOGs analogues” are consistent with moderate levels of obscuration and found in their sample a similar fraction of moderately-obscured AGN than our work. Ricci et al. (2015) found that 274% of their sample of 834 AGNs selected from the 70-month Swift/BAT catalog in the local Universe corresponds to CT AGNs. This is somewhat larger than the value predicted by Aird et al. (2015) at low redshifts but still in good agreement with the report by Burlon et al. (2011) using a smaller sample of 200 AGNs. It would have been reasonable to expect that DOGs should have a higher fraction of CT sources because by definition they have dustier host galaxies. However, these results, combined with the evidence presented on section 4.4 appear to indicate that there is no significant difference with the general AGN population. Thus, we can speculate that the obscuration, at least in the most extreme cases has to be nuclear and roughly independent of the properties of the host galaxy, as also concluded by Ricci et al. (2017) for a hard X-ray selected AGN sample and using statistical arguments by Buchner & Bauer (2017).
3.3 X-ray stacking
Previous studies have shown that stacking in the X-ray is a powerful technique that allows the detection of emission from objects lying below the formal detection limit for individual sources (e.g., Brandt et al., 2001). Chandra is particularly well suited for this thanks to its very low and stable background. We perform X-ray stacking for the DOGs in the area covered by the COSMOS Chandra Legacy data using the web-based CSTACK code111http://cstack.ucsd.edu/ or http://lambic.astrosen.unam.mx/cstack/ developed by Takamitsu Miyaji. Stacking was performed in two bands independently: soft (0.5–2 keV) and hard (2– 5 keV). Chandra internal background being dominated by strong emission lines above 7 keV, we limit the high energy band threshold to 5 keV to limit the internal background. Prior to stacking, we removed all the sources that were individually detected by Chandra; this reduced our sample from 108 far-IR detected DOGs to 86. After removing DOGs that are too close to an X-ray source, the stacking with CSTACK was performed on 76 objects. The radius of the exclusion region varies with the off axis angle, corresponding to the 90% encircled counts fraction radii, with a minimum of 1.0 arcsec and a maximum of 7.0 arcsec. We obtain a mean count rate on the soft band of 8.561.8910-6 cts/s. In contrast, no significant detection is obtained in the hard band using a 3- threshold. We provide for different stacking approaches an estimate for the flux only when the detection is above 3- (see Table 3).
In order to convert count rates into fluxes we use the Portable, Interactive Multi-Mission Simulator (PIMMS) tool for the Chandra Observatory222http://cxc.harvard.edu/toolkit/pimms.jsp. Assuming the corresponding Chandra-Cycle 14 / ACIS response functions, an intrinsic power-law spectrum with = 1.9, a Galactic absorption value of 2.6 1020 cm-2 (Willingale et al., 2013) and a representative intrinsic absorption of 1023 cm-2 at =2 (median redshift of our sample of X-ray undetected DOGs), we find a conversion factor from counts-per-second to flux of 5.210-12 erg cm-2 s-1/(cts s-1) in the soft band. We find that the average observed X-ray flux for the X-ray undetected DOGs is S0.5-2keV=4.410-17 erg cm-2 s-1 in the soft band, a factor of 10 lower than the average value for the X-ray detected DOGs. The stacked signal in the hard band is below a 3- detection (cf Table 3).
4 Discussion
4.1 X-ray Stacking of Specific Population Sub-samples
In this section, we study the possible dependence of our X-ray stacking results on other parameters of the DOGs such as AGN activity, star formation, redshift and 24m flux. Our results are described in this section and summarized in Table 3.
| Subsample | Number of | Number of | median | Flux * | median | Flux * |
| sources used | FIR-AGN DOGs | count rate | Soft band | count rate | Hard band (2-8 keV) | |
| for stacking | used for stacking | Soft band | [erg/s/cm2] | 2-5 keV | [erg/s/cm2] | |
| (1e-06) | (1e-17) | (1e-06) | (1e-17) | |||
| all undetected | 76 | 10 | 8.56 1.89 | 4.43 | 6.01 2.24 | – |
| SF undetected | 59 | 0 | 7.39 2.05 | 3.82 | 6.52 2.55 | – |
| AGN undetected | 10 | 10 | 10.5 6.45 | – | 4.24 6.43 | – |
| R - K 2.79 | 69 | 10 | 8.94 2.02 | 4.62 | 7.24 2.41 | 1.76 |
| SFR200 | 55 | 6 | 8.83 2.18 | 4.57 | 5.03 2.63 | – |
| SFR300 | 38 | 5 | 10.1 2.86 | 5.65 | 4.72 3.16 | – |
| SFR400 | 23 | 4 | 5.63 3.40 | – | 1.94 3.86 | – |
| z1.9 | 28 | 0 | 9.53 3.01 | 4.94 | 7.18 3.91 | – |
| 1.9z2.3 | 24 | 2 | 10.5 3.42 | 5.43 | 8.70 4.17 | – |
| 2.3z3 | 25 | 8 | 7.57 3.41 | – | 7.22 3.63 | – |
| 0.09F240.36 | 30 | 1 | 7.14 2.77 | – | 7.20 3.56 | – |
| 0.36F240.60 | 26 | 1 | 5.58 3.27 | – | 4.08 3.76 | – |
| 0.60F244.74 | 21 | 8 | 15.6 4.19 | 8.08 | 3.81 4.45 | – |
* Fluxes are computed using PIMMS only when a detection 3- significant is achieved.
4.1.1 Effect of AGN activity on X-ray stacking
Following the far-IR classification of Riguccini et al. (2015), we stacked the sub-sample of “star-forming” DOGs (those dominated by a host SED component) and that of far-IR AGN DOGs. Out of the DOGs that are not detected in the X-rays, a total of 66 are classified as “host” DOGs by Riguccini et al. (2015) and 12 are classified as AGNs; note that only 10 sources of the latter were used to perform the stacking after eliminating two due to proximity to an X-ray source. The stacked signal in the soft band for the “host” DOGs is reported in Table 3. Most likely due to the low number of sources, no signal was detected either in the soft nor the hard band of the AGN far-IR DOGs.
Fiore et al. (2008, 2009) and Treister et al. (2009b) showed that imposing a color cut of R - K2.79 on a DOG sample increases the probability of selecting AGN DOGs. It is worth noting that we find similar results with our X-ray stacking analysis. Indeed the only subsample where we obtained a stacked emission in the hard band (i.e. with detection 3 ) is for the DOG population with R-K2.79, underlying a higher AGN activity in this subsample. Based on this result, we estimate the hardness ratio of the stacked signal for the R-K cut sample and obtain a value of 0.020.29. Considering this result and the redshifts of the sources that went into the stacking, we can see from Figure 3 that this contribution is likely associated with moderately-obscured AGN activity.
4.1.2 Effect of redshift and star-formation activity on X-ray stacking
In order to gauge the impact that redshift may have in our results, we divide our sample of 86 X-ray undetected DOGs roughly evenly into three redshift bins and perform X-ray stacking independently on these 3 sub-samples: 30 sources at z1.9, 27 sources with 1.9z2.3 and 29 sources with 2.3z3. After excluding DOGs that are too close to an X-ray source the stacking was performed on 28 sources at z1.9, 24 at 1.9z2.3 and 25 at 2.3z3, with corresponding median redshifts of 1.75, 2.0 and 2.7, respectively. Table 3 displays our findings, where quoted fluxes are calculated assuming a conversion factor of 5.18 10-12 erg cm-2s-1/(cts/s). The X-ray stacking procedure yielded significant detections (i.e., -) in the soft band for the two lower redshift bins, but not for the higher redshift bin probed in this study. We found no significant detections in the hard band for any of the redshift bins. Based on these results we do not find any evidence for a significant redshift evolution in the average soft X-ray flux of the sample.
We consider 3 bins of increasingly intense star formation activity SFR200yr-1 (55 sources), SFR300yr-1 (38 sources) and SFR400yr-1 (23 sources) neither of which present a signal in the hard band. We merely find a detection in the soft band for the bins with sources displaying SFR200yr-1 and SFR300yr-1. Based on these results we are unable to probe for any trends with respect to star formation activity.
4.1.3 Effect of 24m flux on X-ray stacking
To analyze the effect of the 24m flux on the X-ray properties of the DOGs, we split our sample in three 24m flux bins: 0.09F24(Jy)0.36, 0.36F24(Jy)0.60, 0.60F24(Jy)4.74 with mean redshifts of 2.1, 2.1 and 2.2 respectively. We performed X-ray stacking on these three sub-samples independently and only find a - detection for the brightest 24m in the soft band. However, based on tentative detections (-) for the fainter 24m bins, the soft band stacking results suggest a dependence on the 24m flux, with higher X-ray fluxes associated to brighter 24m sources. This is an expected trend, as earlier works (e.g., Treister et al., 2006; Riguccini et al., 2015) have shown that the AGN fraction increases strongly with 8m luminosity and hence with the 24m flux as well.
4.2 AGN Fraction
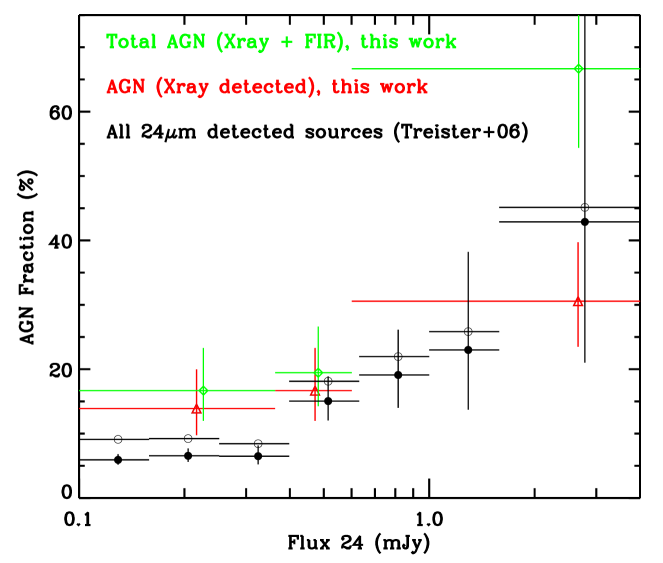
We show in Fig.4 the fraction of far-IR detected DOGs that are classified as AGNs as a function of the 24m flux, considering only X-ray classification (red triangles) and the combined X-ray and far-IR SED-based classification (green diamonds). We can see that the AGN fraction increases rapidly towards higher 24m fluxes, particularly when considering the combined far-IR and X-ray detected analysis. Brand et al. (2006) found that at the brightest 24m fluxes, 74%21% of their sample of LIRGs with z0.6 have their mid-IR emission dominated by an AGN. Compared to the entire 24m population in the GOODS field (see also, e.g., Treister et al. 2006), we only see a significant difference between the DOGs and the wider 24m population at the lowest 24m fluxes. However, the X-ray-based AGN fraction shown in Fig.4 is strictly based on considering merely those AGN DOGs with individual X-ray detections. In the light of our X-ray stacking results, we note that AGN activity is not limited to this sample of individually X-ray detected DOGs, but that a mix nature (AGN and star formation) exists within the population of the individually X-ray undetected DOGs. In an effort to constrain the contribution to the AGN fraction from the X-ray undetected population, we compared our stacked point with results from X-ray normal galaxies from Lehmer et al. (2016) and with our X-ray detected DOGs and found a contribution of 20% from AGN activity for the stacked sample. Considering that the X-ray undetected DOG sample in question is comprised of 76 DOGs, this translates into a potential increase of the AGN fraction by 15 significantly obscured DOGs.
Our stacking analysis showed that X-ray fluxes increase with 24m flux. This is consistent with the observed trend within the X-ray detected DOG population, with an observed increase of the total AGN fraction in the brightest 24m bins (see Fig.4), as previously reported by e.g., Dey et al. (2008) and Fiore et al. (2009). Taking into account the potential non-negligible fraction of highly obscured AGN missed even with our (X-ray + far-IR) combined analysis but revealed within our undetected DOG sample, we expect that the AGN fraction traced by the DOG population may be even higher within the brightest 24m bins. Combined with the observed difference in AGN fraction at the faintest 24m bins between the DOG population and the GOODS 24m population as a whole from Treister et al. (2006), these results point to the DOG population as an effective means of selecting AGNs, particularly so in the case of high obscuration.
4.3 Star Formation Rates
In order to identify a potential AGN contribution to the IR luminosity used to infer star formation rates, we first derive the AGN bolometric luminosity for the 22 X-ray detected DOGs (0.5-10 keV), estimating it from the intrinsic (i.e., absorption-corrected) X-ray luminosity and assuming a fixed factor of 10 for the bolometric correction, as reported by Rigby et al. (e.g., 2009); Vasudevan & Fabian (e.g., 2009). While a luminosity dependence of the bolometric correction has been claimed in the past (e.g., Marconi et al., 2004), more recent work (Lusso et al., 2012) shows that in the luminosity range spanned by our sample the expected changes in luminosity are relatively small, a factor of 2, and consistent with the observed dispersion, as can be seen in Figure 8 of Lusso et al. (2012), thus justifying our conservative choice of a constant bolometric correction. We then conclude that in most cases the AGN accounts for less than 50% of the IR luminosity, as can be seen in Fig. 5 for the 21 X-ray detected DOGs with a FIR-fit. This conclusion holds even considering a bolometric correction that is 2 higher for the most luminous sources. Hence, even in sources that contain an AGN, the nuclear emission does not make a significant contribution to the IR luminosity, which is most likely due to processes related to the star formation activity. In particular, we find that of all moderately obscured AGNs and all CT candidates display a % AGN contribution to the IR luminosity.
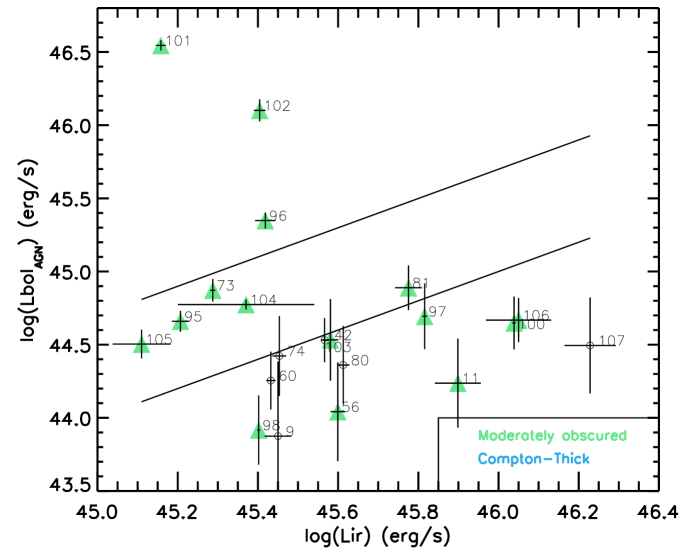
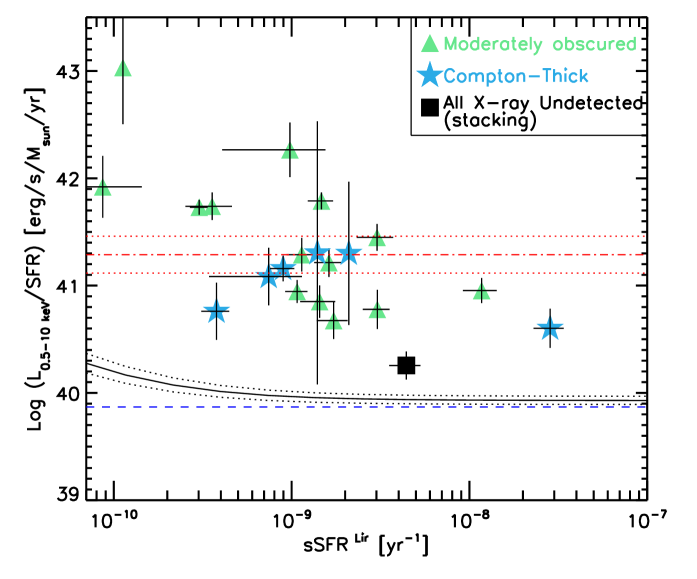
Fig. 6 displays the X-ray luminosity per unit of star formation rate, in units of erg s-1/[yr-1], as a function of the specific SFR (sSFR) for the 21 X-ray detected sources with FIR SED-decomposition fit. The stellar masses are taken from SED-fitting analyses using 30 bands in COSMOS from Ilbert et al. (2009). The SFR is obtained using the Kennicutt (1998) relation with IR luminosity. We use the IR luminosity obtained in this work with SED-fitting taking into account the contribution of an AGN component to the host galaxy. We are confident in our stellar masses and SFR estimates since they are in very good agreement with the recent work of Suh et al. (2017) on Type 2 AGN host galaxies in the Chandra COSMOS Legacy Survey. Our stellar masses (median log M∗ = 11.260.07) agree within the error bars with their value (median log M∗,Suh = 11.000.20) and our median SFR (13139 M⊙yr-1) agrees with their median value as well (173 M⊙yr-1). The black dotted lines on Fig. 6 delimits the area populated by normal galaxies from Lehmer et al. (2016, orange area). The fact that all of the sources in our sample are above the line found for normal (i.e., non-AGN) galaxies, as reported by Mineo et al. (2014), in most cases by more than an order of magnitude indicates that the X-ray emission is most likely dominated by the AGN emission, even if the IR is not.
We further include in Fig. 6 the results of our stacking analysis for all X-ray undetected DOGs. In order to do this, we used the PIMMS tool to convert the flux of the X-ray undetected DOGs stacked sample from Table 3 into the extrapolated 5-10 keV X-ray luminosity with a median redshift of z2. The stacked sample has a median sSFR of 4.420.8810-9 [yr-1]. We are quantifying the AGN contribution to the X-ray undetected DOG population using the stacked point in this figure. If the stacked sample was only star-formation activity, it would be located on the black solid curve with log (Lx/SFR) 39.93 [erg/s/M⊙/yr] at the median sSFR of the Xray undetected sample . If it was only coming from AGN activity (i.e. 100% contribution) it would be located on the red dashed-dotted line (i.e. log (Lx/SFR) =41.28 [erg/s/M⊙/yr]). We then estimate the AGN contribution of the stacked sample at 20%. We note here that we found a similar AGN contribution using the R-K2.79 X-ray undetected DOGs sample.
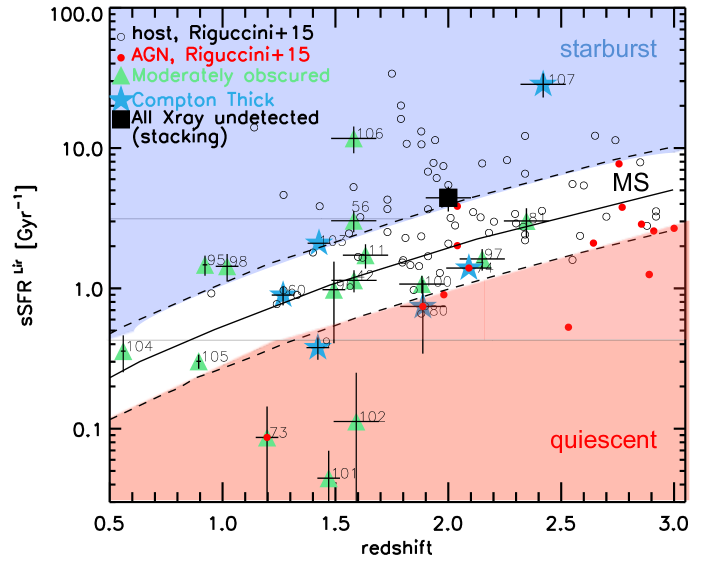
4.4 Specific star formation rate of the DOG population: where do the AGN-DOGs lie with respect to the main sequence?
Recent studies have pointed to the existence of a so-called “main sequence” (MS) of star forming galaxies up to where galaxies undergoing star formation activity typically lie within a well-defined region in the SFR-stellar mass diagram (e.g., Tacconi et al., 2017; Genzel et al., 2015; Whitaker et al., 2012; Elbaz et al., 2011; Daddi et al., 2007). Riguccini et al. (2015) showed, based on the MS definition of Elbaz et al. (2011), that far-IR AGN DOGs mainly lie on or below the MS, while DOGs dominated by a host component lie on the MS and above it, within the starburst regime. These results underline the diversity found in the DOG population. Taking advantage of the Herschel data, we can derive, using SED-fitting at far-IR wavelengths, reliable IR luminosities and hence star formation rates, and potential AGN contributions in the IR for the DOGs in our sample.
Fig. 7 shows the evolution of the specific SFR (sSFR) of DOGs with cosmic time. The AGN-DOGs (both X-ray and far-IR) appear to present a lower sSFR than SF-DOGs. We run a KS test to verify how distinct the distributions in sSFRs are and find a low probability of 1.6 10-4 that they arise from the same parent distribution. The majority of the AGNs-DOGs (both far-IR and X-ray) populate the area around and below the MS, with only two sources lying well above it: one CT candidate and a moderately obscured AGN.
We do not see clear differences in behavior between the CT candidates and the moderately obscured AGNs in Fig. 7. According to the evolutionary scenario of Treister et al. (2010), the highly obscured CT AGNs correspond to the early, very dust-enshrouded, SMBH growth phase in a major galaxy merger; moderately obscured AGNs correspond in turn to a later stage in this evolutionary scenario, when the energetic feedback related to the SMBH accretion have already started heating up the dust and gas of the galaxy, shutting down star formation activity. In this picture, we expect the CT candidates to lie slightly above the moderately-obscured AGNs in the sSFR-redshift diagram, which does not appear to be the case. This surprising result that CT AGN are not preferentially found above the MS has been found as well in spectroscopically selected CT sample (e.g., Georgantopoulos et al., 2013; Lanzuisi et al., 2015). Hence, this further confirms the scenario presented on section 3.2, suggesting that at least for the most extreme sources, the obscuration has to be nuclear and thus not directly connected to the evolutionary stage of the host galaxy.
We note that the large uncertainties on the determinations make it hard to discriminate between CT and moderately obscured AGNs. This in turn also affects the derivation of the AGN contribution and have an impact in LIR and SFR estimates. This could potentially explain the lack of an observed difference of behavior between the two populations of X-ray detected AGNs. However, we have to consider the detectability of those sources. Assuming that the far-IR AGN have the same X-ray luminosity as the X-ray detected ones but they are lying at higher redshifts and hence have lower fluxes, we run C-stack on 19 random undetected DOGs to check if those far-IR AGN DOGs would have been detected by X-ray stacking, finding no significant detection.
5 Conclusions
Searching for obscured Active Galactic Nuclei (AGN) is of main importance since AGN synthesis models for the Cosmic X-ray background (CXRB) predict a large number of obscured AGNs including CT AGNs. However, even the deepest Chandra and XMM-Newton surveys were able to detect only a few of them until nowadays. Our study combine exquisite new Chandra data with far-infrared Herschel data to catch obscured AGNs at z2. In this work we aimed to characterize the X-ray properties of the dust-obscured galaxy (DOG; F24μm/FR1000) population with far-IR detections by the Herschel Space Telescope. Our sample is composed of 108 DOGs in the COSMOS field and we relied on the Chandra COSMOS Legacy Survey X-ray and on the Herschel Observatory data to undertake our analysis.
Out of 108 DOGs, 22 (i.e., 20% of the sample) are individually detected in the X-ray soft and hard bands thanks to the increased coverage in area and sensitivity of the Chandra COSMOS Legacy Survey observations. Based on our estimates of the corresponding neutral hydrogen column density along the line of sight (), we find that 6 of these X-ray detected DOGs (i.e., 27%) are CT candidates, 15 (68%) are moderately obscured AGNs and one is consistent with being unobscured. Our results are in excellent agreement with previous reports (i.e., Ricci et al., 2015), who found a fraction of CT AGNs of 274%. This suggests that the fraction of CT sources is not different than that of the general AGN population and hence the obscuration, at least in the most extreme cases, appears to be independent of the amount of dust in the host likely and hence most likely nuclear.
We study the spectral energy distribution (SED) of the 22 X-ray detected DOGs, based on (rest-frame) optical-through-IR data, and find that only 7 are classified as AGN following the SED-fitting method described in Riguccini et al. (2015). We note that out of the 19 far-IR AGN DOGs identified by Riguccini et al. (2015), these 7 are the only ones with Chandra X-ray detection. This clearly shows how using far-IR to select obscured AGN is crucial to complement a X-ray analysis allow us to probe a wider range of AGNs.
Our main results are the following:
-
1.
We find that the X-ray detected AGN DOGs and the far-IR AGN DOGs typically display similar near-IR and mid-to-far IR colors. Both populations are also typically found on the main-sequence of star-forming galaxies or below it. The main difference these populations appear to display is in their redshift distributions, with the far-IR AGN DOGs being typically found at larger distances. Together, these results suggest that the two populations share most of their physical properties and that the lack of detection in the X-ray band for the bulk of far-IR AGN DOGs is explained by the difference in redshift distributions. This strongly underline the critical need of multi-wavelength studies in order to obtain a more complete census of the obscured AGN population out to higher redshifts.
-
2.
Based on earlier findings by Fiore et al. (2008, 2009) and Treister et al. (2009b), who showed that a color cut of R-K2.79 on a DOG sample increases the probability of selecting AGNs, we stacked all individually-undetected DOGs above this color cut. This resulted in the strongest stacked signal from our sub-sample stacking, pointing to a higher AGN fraction, likely associated with moderately-obscured AGN activity.
-
3.
We demonstrate that the combined population of X-ray detected and far-IR DOGs is effective at selecting AGNs, compared to the 24m population as a whole (as done within the GOODs field by e.g., Treister et al., 2006). Moreover, X-ray stacking of individually-undetected DOGs points to a mix between AGN activity and star formation, where X-ray-undetected DOGs. We want to stress here how much our AGN far-IR Herschel SED-based classification is important. Indeed, if only considering X-ray detections, DOGs would have the same AGN fraction or even lower than a 24m-selected population. This shows the critical need of deep far-IR surveys to probe AGN activity in star-forming galaxies samples.
This work emphasizes the important role that the DOG population, in particular the combined X-ray and far-IR detected DOG population, plays in the effort to get a more complete census of the AGN population at high redshift, particularly for the highly obscured population.
PACS has been developed by a consortium of institutes led by MPE (Germany) and including UVIE (Austria); KU Leuven, CSL, IMEC (Belgium); CEA, LAM (France); MPIA (Germany); INAF-IFSI/OAA/OAP/OAT, LENS, SISSA (Italy); IAC (Spain). This development has been supported by the funding agencies BMVIT (Austria), ESA-PRODEX (Belgium), CEA/CNES (France), DLR (Germany), ASI/INAF (Italy), and CICYT/MCYT (Spain).
SPIRE has been developed by a consortium of institutes led by Cardiff University (UK) and including University of Lethbridge (Canada), NAOC (China), CEA, LAM (France), IFSI, University of Padua (Italy), IAC (Spain), Stockholm Observatory (Sweden), Imperial College London, RAL, UCL-MSSL, UKATC, University of Sussex (UK), Caltech, JPL, NHSC, University of Colorado (USA). This development has been supported by national funding agencies: CSA (Canada); NAOC (China); CEA, CNES, CNRS (France); ASI (Italy); MCINN (Spain); SNSB (Sweden); STFC, UKSA (UK) and NASA (USA). SPIRE has been developed by a consortium of institutes led by Cardiff Univ. (UK) and including Univ. Lethbridge (Canada); NAOC (China); CEA, LAM (France); IFSI, Univ. Padua (Italy); IAC (Spain); Stockholm Observatory (Sweden); Imperial College London, RAL, UCL-MSSL, UKATC, Univ. Sussex (UK); Caltech, JPL, NHSC, Univ. Colorado (USA). This development has been supported by national funding agencies: CSA (Canada); NAOC (China); CEA, CNES, CNRS (France); ASI (Italy); MCINN (Spain); SNSB (Sweden); STFC, UKSA (UK); and NASA (USA).
ET acknowledges support from: CONICYT-Chile grants Basal-CATA PFB-06/2007 and AFB-170002, FONDECYT Regular 1160999 and 1190818, and Anillo de ciencia y tecnología ACT1720033. KMD and TSG thank the support of the Productivity in Research Grant of the Brazilian National Council for Scientific and Technological Development (CNPq). T. Miyaji and the development of CSTACK are supported by CONACyT IB 252531 and UNAM-DGAPA PAPIIT IN104216 E.L. is supported by a European Union COFUND/Durham Junior Research Fellowship (under EU grant agreement no. 609412) GL acknowledges support from the FP7 Career Integration Grant “eEASy” (CIG 321913) and grant ASI/INAF I/037/12/0-011/13. CR acknowledge financial support from FONDECYT 1141218, Basal-CATA PFB–06/2007 and the China-CONICYT fund.
References
- Aird et al. (2015) Aird, J., Coil, A. L., Georgakakis, A., et al. 2015, MNRAS, 451, 1892, doi: 10.1093/mnras/stv1062
- Akylas et al. (2012) Akylas, A., Georgakakis, A., Georgantopoulos, I., Brightman, M., & Nandra, K. 2012, A&A, 546, A98, doi: 10.1051/0004-6361/201219387
- Arévalo et al. (2014) Arévalo, P., Bauer, F. E., Puccetti, S., et al. 2014, ApJ, 791, 81, doi: 10.1088/0004-637X/791/2/81
- Ballantyne et al. (2011) Ballantyne, D. R., Draper, A. R., Madsen, K. K., Rigby, J. R., & Treister, E. 2011, ApJ, 736, 56, doi: 10.1088/0004-637X/736/1/56
- Ballantyne et al. (2006) Ballantyne, D. R., Everett, J. E., & Murray, N. 2006, ApJ, 639, 740, doi: 10.1086/499558
- Baronchelli et al. (2017) Baronchelli, L., Koss, M., Schawinski, K., et al. 2017, MNRAS, 471, 364, doi: 10.1093/mnras/stx1561
- Bauer et al. (2015) Bauer, F. E., Arévalo, P., Walton, D. J., et al. 2015, ApJ, 812, 116, doi: 10.1088/0004-637X/812/2/116
- Berta et al. (2011) Berta, S., Magnelli, B., Nordon, R., et al. 2011, A&A, 532, A49, doi: 10.1051/0004-6361/201116844
- Brand et al. (2006) Brand, K., Dey, A., Weedman, D., et al. 2006, ApJ, 644, 143, doi: 10.1086/503416
- Brandt et al. (2001) Brandt, W. N., Hornschemeier, A. E., Schneider, D. P., et al. 2001, ApJ, 558, L5, doi: 10.1086/323570
- Brightman et al. (2014) Brightman, M., Nandra, K., Salvato, M., et al. 2014, MNRAS, 443, 1999, doi: 10.1093/mnras/stu1175
- Brusa et al. (2007) Brusa, M., Zamorani, G., Comastri, A., et al. 2007, ApJs, 172, 353, doi: 10.1086/516575
- Brusa et al. (2010) Brusa, M., Civano, F., Comastri, A., et al. 2010, ApJ, 716, 348, doi: 10.1088/0004-637X/716/1/348
- Buchner & Bauer (2017) Buchner, J., & Bauer, F. E. 2017, MNRAS, 465, 4348, doi: 10.1093/mnras/stw2955
- Buchner et al. (2015) Buchner, J., Georgakakis, A., Nandra, K., et al. 2015, ApJ, 802, 89, doi: 10.1088/0004-637X/802/2/89
- Burlon et al. (2011) Burlon, D., Ajello, M., Greiner, J., et al. 2011, ApJ, 728, 58, doi: 10.1088/0004-637X/728/1/58
- Civano et al. (2015) Civano, F., Hickox, R. C., Puccetti, S., et al. 2015, ApJ, 808, 185, doi: 10.1088/0004-637X/808/2/185
- Civano et al. (2016) Civano, F., Marchesi, S., Comastri, A., et al. 2016, ApJ, 819, 62, doi: 10.3847/0004-637X/819/1/62
- Comastri et al. (1995) Comastri, A., Setti, G., Zamorani, G., & Hasinger, G. 1995, A&A, 296, 1
- Comastri et al. (2011) Comastri, A., Ranalli, P., Iwasawa, K., et al. 2011, A&A, 526, L9, doi: 10.1051/0004-6361/201016119
- Daddi et al. (2007) Daddi, E., Dickinson, M., Morrison, G., et al. 2007, ApJ, 670, 156, doi: 10.1086/521818
- Desai et al. (2007) Desai, V., Armus, L., Spoon, H. W. W., et al. 2007, ApJ, 669, 810, doi: 10.1086/522104
- Dey et al. (2008) Dey, A., Soifer, B. T., Desai, V., et al. 2008, ApJ, 677, 943, doi: 10.1086/529516
- Elbaz et al. (2011) Elbaz, D., Dickinson, M., Hwang, H. S., et al. 2011, A&A, 533, A119, doi: 10.1051/0004-6361/201117239
- Feruglio et al. (2011) Feruglio, C., Daddi, E., Fiore, F., et al. 2011, ApJl, 729, L4, doi: 10.1088/2041-8205/729/1/L4
- Fiore et al. (2008) Fiore, F., Grazian, A., Santini, P., et al. 2008, ApJ, 672, 94, doi: 10.1086/523348
- Fiore et al. (2009) Fiore, F., Puccetti, S., Brusa, M., et al. 2009, ApJ, 693, 447, doi: 10.1088/0004-637X/693/1/447
- Genzel et al. (1998) Genzel, R., Lutz, D., Sturm, E., et al. 1998, ApJ, 498, 579, doi: 10.1086/305576
- Genzel et al. (2015) Genzel, R., Tacconi, L. J., Lutz, D., et al. 2015, ApJ, 800, 20, doi: 10.1088/0004-637X/800/1/20
- Georgakakis et al. (2010) Georgakakis, A., Rowan-Robinson, M., Nandra, K., et al. 2010, MNRAS, 406, 420, doi: 10.1111/j.1365-2966.2010.16727.x
- Georgantopoulos et al. (2013) Georgantopoulos, I., Comastri, A., Vignali, C., et al. 2013, A&A, 555, A43, doi: 10.1051/0004-6361/201220828
- Gilli et al. (2007) Gilli, R., Comastri, A., & Hasinger, G. 2007, A&A, 463, 79, doi: 10.1051/0004-6361:20066334
- Gilli et al. (2001) Gilli, R., Salvati, M., & Hasinger, G. 2001, A&A, 366, 407, doi: 10.1051/0004-6361:20000105
- Ilbert et al. (2009) Ilbert, O., Capak, P., Salvato, M., et al. 2009, ApJ, 690, 1236, doi: 10.1088/0004-637X/690/2/1236
- Joseph (1999) Joseph, R. D. 1999, APSS, 266, 321
- Juneau et al. (2011) Juneau, S., Dickinson, M., Alexander, D. M., & Salim, S. 2011, ApJ, 736, 104, doi: 10.1088/0004-637X/736/2/104
- Juneau et al. (2013) Juneau, S., Dickinson, M., Bournaud, F., et al. 2013, ApJ, 764, 176, doi: 10.1088/0004-637X/764/2/176
- Kennicutt (1998) Kennicutt, Jr., R. C. 1998, ApJ, 498, 541, doi: 10.1086/305588
- Lansbury et al. (2017) Lansbury, G. B., Stern, D., Aird, J., et al. 2017, ApJ, 836, 99, doi: 10.3847/1538-4357/836/1/99
- Lanzuisi et al. (2015) Lanzuisi, G., Ranalli, P., Georgantopoulos, I., et al. 2015, A&A, 573, A137, doi: 10.1051/0004-6361/201424924
- Le Floc’h et al. (2009) Le Floc’h, E., Aussel, H., Ilbert, O., et al. 2009, ApJ, 703, 222, doi: 10.1088/0004-637X/703/1/222
- Lehmer et al. (2016) Lehmer, B. D., Basu-Zych, A. R., Mineo, S., et al. 2016, ApJ, 825, 7, doi: 10.3847/0004-637X/825/1/7
- Lusso et al. (2012) Lusso, E., Comastri, A., Simmons, B. D., et al. 2012, MNRAS, 425, 623, doi: 10.1111/j.1365-2966.2012.21513.x
- Lutz et al. (1998) Lutz, D., Spoon, H. W. W., Rigopoulou, D., Moorwood, A. F. M., & Genzel, R. 1998, ApJL, 505, L103, doi: 10.1086/311614
- Marchesi et al. (2016) Marchesi, S., Lanzuisi, G., Civano, F., et al. 2016, ApJ, 830, 100, doi: 10.3847/0004-637X/830/2/100
- Marconi et al. (2004) Marconi, A., Risaliti, G., Gilli, R., et al. 2004, MNRAS, 351, 169, doi: 10.1111/j.1365-2966.2004.07765.x
- Matt et al. (2000) Matt, G., Fabian, A. C., Guainazzi, M., et al. 2000, MNRAS, 318, 173, doi: 10.1046/j.1365-8711.2000.03721.x
- Menéndez-Delmestre et al. (2009) Menéndez-Delmestre, K., Blain, A. W., Smail, I., et al. 2009, ApJ, 699, 667, doi: 10.1088/0004-637X/699/1/667
- Mineo et al. (2014) Mineo, S., Gilfanov, M., Lehmer, B. D., Morrison, G. E., & Sunyaev, R. 2014, MNRAS, 437, 1698, doi: 10.1093/mnras/stt1999
- Mullaney et al. (2011) Mullaney, J. R., Alexander, D. M., Goulding, A. D., & Hickox, R. C. 2011, MNRAS, 414, 1082, doi: 10.1111/j.1365-2966.2011.18448.x
- Mullaney et al. (2015) Mullaney, J. R., Del-Moro, A., Aird, J., et al. 2015, ApJ, 808, 184, doi: 10.1088/0004-637X/808/2/184
- Murphy & Yaqoob (2009) Murphy, K. D., & Yaqoob, T. 2009, MNRAS, 397, 1549, doi: 10.1111/j.1365-2966.2009.15025.x
- Nandra & Pounds (1994) Nandra, K., & Pounds, K. A. 1994, MNRAS, 268, 405, doi: 10.1093/mnras/268.2.405
- Page et al. (2006) Page, M. J., Loaring, N. S., Dwelly, T., et al. 2006, MNRAS, 369, 156, doi: 10.1111/j.1365-2966.2006.10278.x
- Petric et al. (2011) Petric, A. O., Armus, L., Howell, J., et al. 2011, ApJ, 730, 28, doi: 10.1088/0004-637X/730/1/28
- Pozzi et al. (2012) Pozzi, F., Vignali, C., Gruppioni, C., et al. 2012, MNRAS, 423, 1909, doi: 10.1111/j.1365-2966.2012.21015.x
- Ricci et al. (2015) Ricci, C., Ueda, Y., Koss, M. J., et al. 2015, ApJL, 815, L13, doi: 10.1088/2041-8205/815/1/L13
- Ricci et al. (2017) Ricci, C., Bauer, F. E., Treister, E., et al. 2017, MNRAS, 468, 1273, doi: 10.1093/mnras/stx173
- Rigby et al. (2009) Rigby, J. R., Diamond-Stanic, A. M., & Aniano, G. 2009, ApJ, 700, 1878, doi: 10.1088/0004-637X/700/2/1878
- Riguccini et al. (2011) Riguccini, L., Le Floc’h, E., Ilbert, O., et al. 2011, A&A, 534, A81, doi: 10.1051/0004-6361/201116950
- Riguccini et al. (2015) Riguccini, L., Le Floc’h, E., Mullaney, J. R., et al. 2015, MNRAS, 452, 470, doi: 10.1093/mnras/stv1297
- Roseboom et al. (2010) Roseboom, I. G., Oliver, S. J., Kunz, M., et al. 2010, MNRAS, 409, 48, doi: 10.1111/j.1365-2966.2010.17634.x
- Salvato et al. (2009) Salvato, M., Hasinger, G., Ilbert, O., et al. 2009, ApJ, 690, 1250, doi: 10.1088/0004-637X/690/2/1250
- Sanders (1999) Sanders, D. B. 1999, APSS, 266, 331
- Sani et al. (2010) Sani, E., Lutz, D., Risaliti, G., et al. 2010, MNRAS, 403, 1246, doi: 10.1111/j.1365-2966.2009.16217.x
- Suh et al. (2017) Suh, H., Civano, F., Hasinger, G., et al. 2017, ArXiv e-prints. https://arxiv.org/abs/1705.03890
- Symeonidis (2017) Symeonidis, M. 2017, MNRAS, 465, 1401, doi: 10.1093/mnras/stw2784
- Symeonidis et al. (2016) Symeonidis, M., Giblin, B. M., Page, M. J., et al. 2016, MNRAS, 459, 257, doi: 10.1093/mnras/stw667
- Tacconi et al. (2017) Tacconi, L. J., Genzel, R., Saintonge, A., et al. 2017, ArXiv e-prints. https://arxiv.org/abs/1702.01140
- Tozzi et al. (2006) Tozzi, P., Gilli, R., Mainieri, V., et al. 2006, A&A, 451, 457, doi: 10.1051/0004-6361:20042592
- Treister & Urry (2005) Treister, E., & Urry, C. M. 2005, ApJ, 630, 115, doi: 10.1086/431892
- Treister et al. (2010) Treister, E., Urry, C. M., Schawinski, K., Cardamone, C. N., & Sanders, D. B. 2010, ApJL, 722, L238, doi: 10.1088/2041-8205/722/2/L238
- Treister et al. (2009a) Treister, E., Urry, C. M., & Virani, S. 2009a, ApJ, 696, 110, doi: 10.1088/0004-637X/696/1/110
- Treister et al. (2004) Treister, E., Urry, C. M., Chatzichristou, E., et al. 2004, ApJ, 616, 123, doi: 10.1086/424891
- Treister et al. (2006) Treister, E., Urry, C. M., Van Duyne, J., et al. 2006, ApJ, 640, 603, doi: 10.1086/500237
- Treister et al. (2009b) Treister, E., Cardamone, C. N., Schawinski, K., et al. 2009b, ApJ, 706, 535, doi: 10.1088/0004-637X/706/1/535
- Ueda et al. (2014) Ueda, Y., Akiyama, M., Hasinger, G., Miyaji, T., & Watson, M. G. 2014, ApJ, 786, 104, doi: 10.1088/0004-637X/786/2/104
- Ueda et al. (2003) Ueda, Y., Akiyama, M., Ohta, K., & Miyaji, T. 2003, ApJ, 598, 886, doi: 10.1086/378940
- Vasudevan & Fabian (2009) Vasudevan, R. V., & Fabian, A. C. 2009, MNRAS, 392, 1124, doi: 10.1111/j.1365-2966.2008.14108.x
- Whitaker et al. (2012) Whitaker, K. E., van Dokkum, P. G., Brammer, G., & Franx, M. 2012, ApJL, 754, L29, doi: 10.1088/2041-8205/754/2/L29
- Willingale et al. (2013) Willingale, R., Starling, R. L. C., Beardmore, A. P., Tanvir, N. R., & O’Brien, P. T. 2013, MNRAS, 431, 394, doi: 10.1093/mnras/stt175
- Worsley et al. (2005) Worsley, M. A., Fabian, A. C., Bauer, F. E., et al. 2005, MNRAS, 357, 1281, doi: 10.1111/j.1365-2966.2005.08731.x