An initial overview of the extent and structure of recent star formation within the Serpens Molecular Cloud using Gaia Data Release 2
Abstract
The dense clusters within the Serpens Molecular Cloud are among the most active regions of nearby star formation. In this paper, we use Gaia DR2 parallaxes and proper motions to statistically measure kinematic members of Serpens, few of which were previously identified, to evaluate the star formation history of the complex. The optical members of Serpens are concentrated in three distinct groups located at 380–480 pc; the densest clusters are still highly obscured by optically-thick dust and have few optical members. The total population of young stars and protostars in Serpens is at least 2000 stars, including past surveys that were most sensitive to protostars and disks, and may be far higher. Distances to dark clouds measured from deficits in star counts are consistent with the distances to the optical star clusters. The Serpens Molecular Cloud is seen in the foreground of the Aquila Rift, dark clouds located at 600–700 pc, and behind patchy extinction, here called the Serpens Cirrus, located at pc. Based on the lack of a distributed population of older stars, the star formation rate throughout the Serpens Molecular Cloud increased by at least a factor of 20 within the past Myr. The optically bright stars in Serpens Northeast are visible because their natal molecular cloud has been eroded and not because they were flung outwards from a central factory of star formation. The separation between subclusters of 20–100 pc and the absence of an older population leads to speculation that an external forcing was needed to trigger the active star formation.
Subject headings:
open clusters and associations: general — stars: pre-main sequence — stars: planetary systems: protoplanetary disks matter — stars: low-mass1. INTRODUCTION
The spatial distribution of young star clusters provide constraints for theoretical explanations for the growth of molecular clouds and subsequent star formation (e.g., Vázquez-Semadeni et al., 2018; Cunningham et al., 2018). Our descriptions of these star-forming regions are built upon a census of the cloud complexes and stellar population. The Serpens Molecular Cloud, one of the most active sites of ongoing star formation within 500 pc, is particularly challenging for membership analyses because the region is seen against the crowded background of the galactic plane, is visually located against a long swath of extinction, and suffers from historical uncertainties in the distances to the different clouds. The Gaia satellite (Gaia Collaboration et al., 2016, 2018) is now revolutionizing the description of star-forming regions. Initial results from Gaia DR2 have described the star formation history of the Orion molecular cloud complexes (Kounkel et al., 2018), the expansion of individual young clusters (Kuhn et al., 2018), of individual sub-clusters in the Vela OB2 Association (Cantat-Gaudin et al., 2018b), and of the Gould Belt (Dzib et al., 2018; Zari et al., 2018), the distinction between sub-groups within single regions (Beccari et al., 2018; Roccatagliata et al., 2018), and memberships of specific regions for analysis of disk fractions (Manara et al., 2018) and older populations (Damiani et al., 2018; Luhman, 2018).
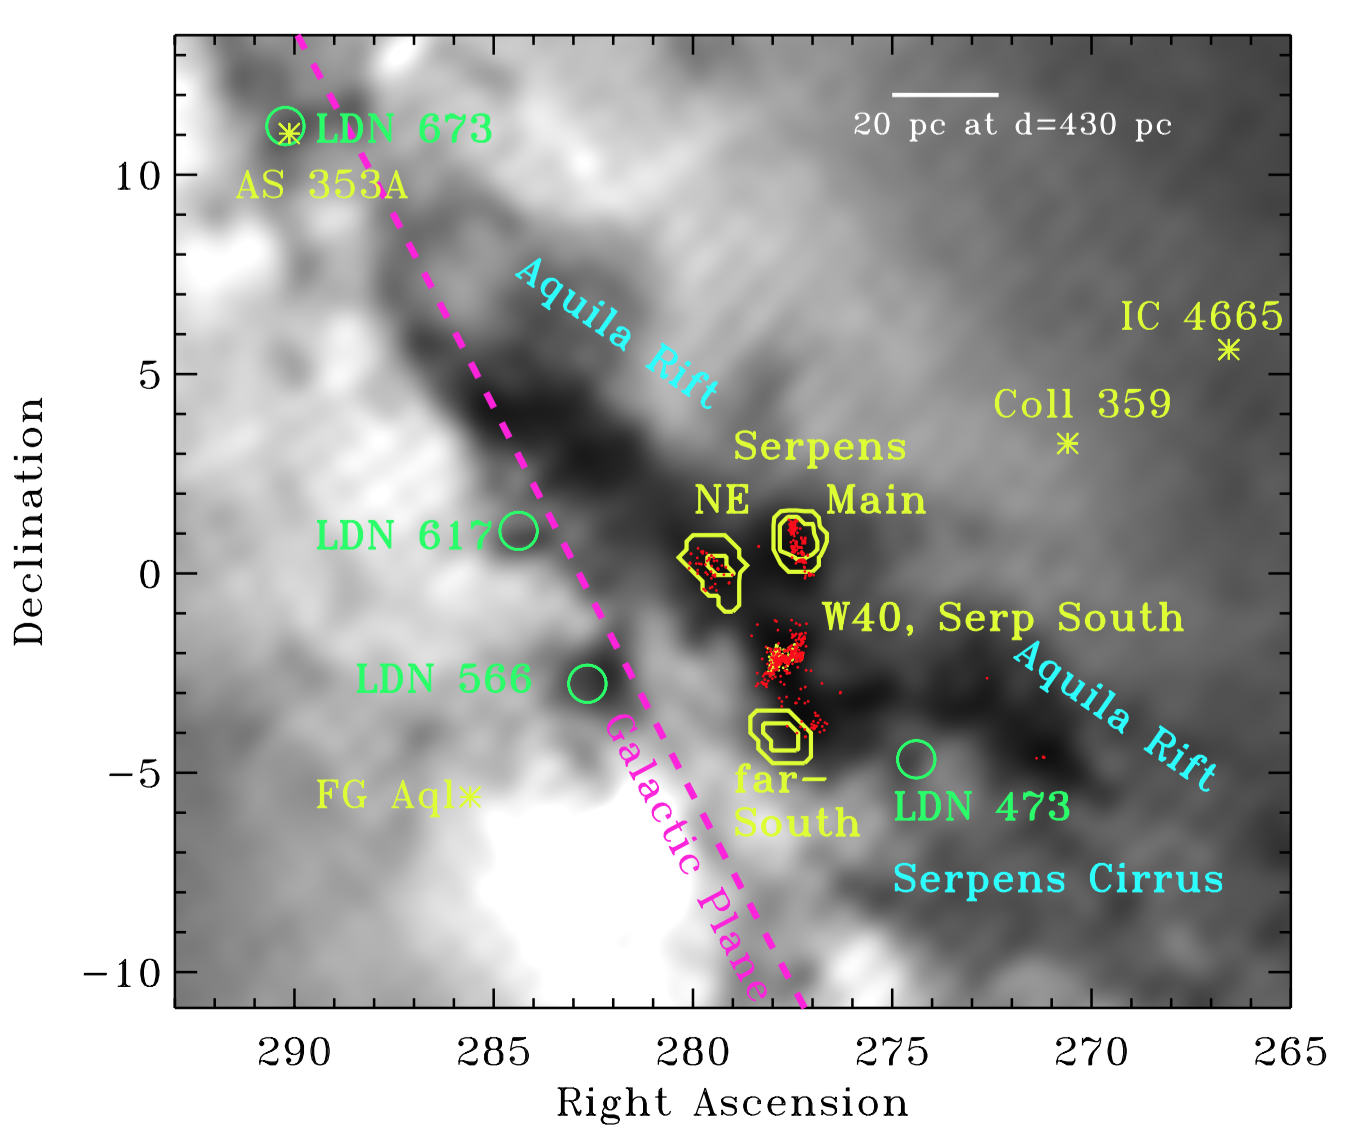
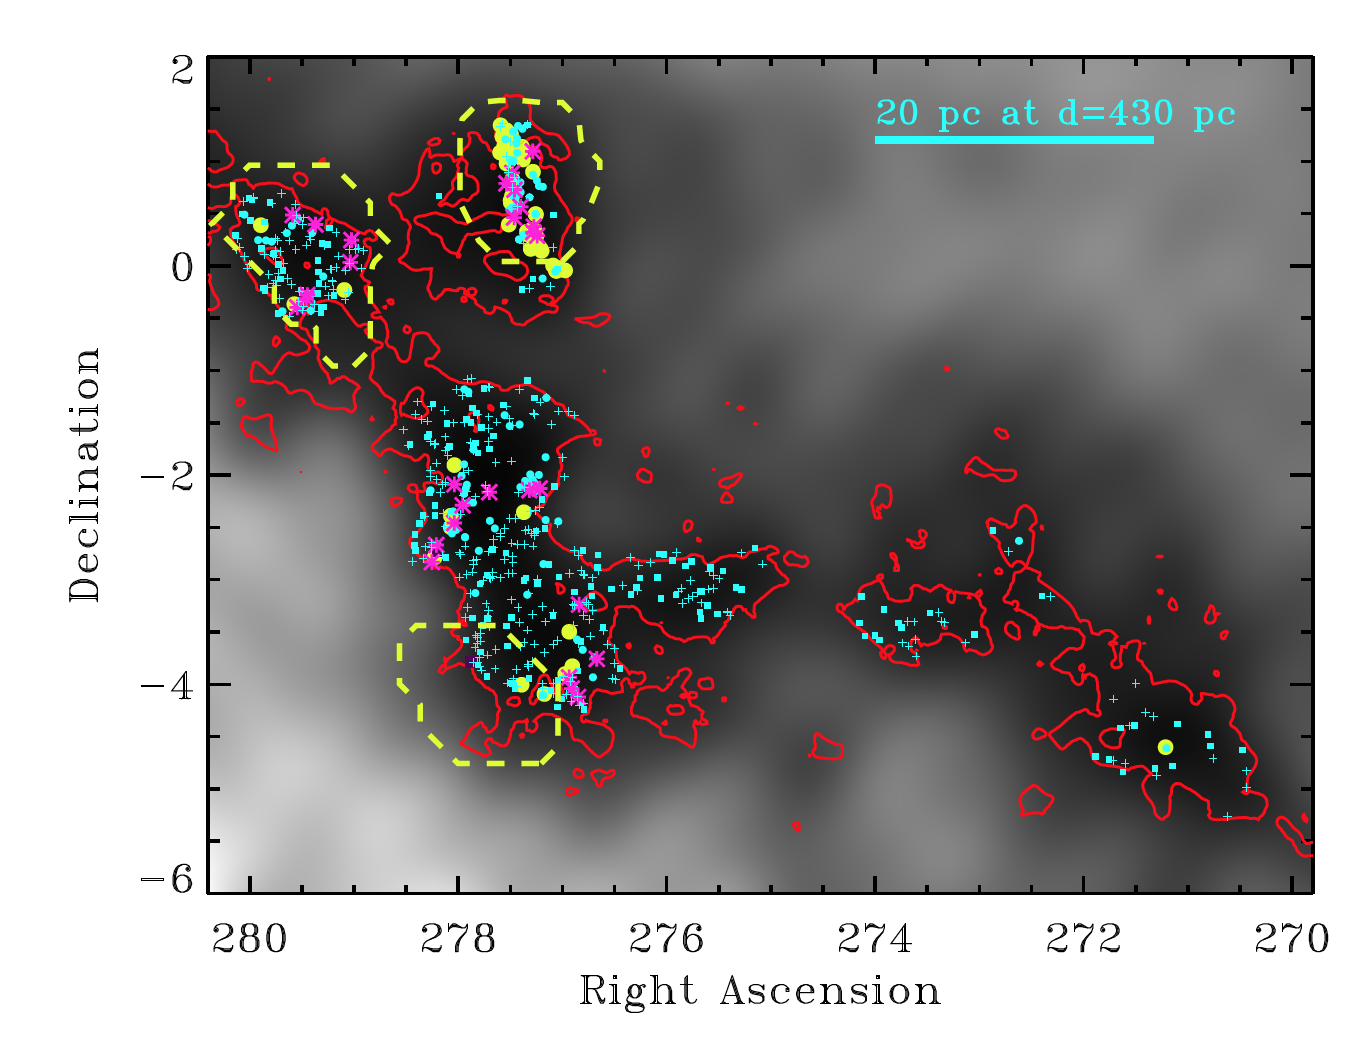
In this paper, we apply the power of Gaia astrometry to star formation in the Serpens-Aquila complex. This collection of cloud complexes111We adopt the following nomenclature for this region: Serpens is the collection of star-forming regions and optically-thick molecular clouds at 370–500 pc, located roughly in a rectangle from 276–281 deg in right ascension and from -5 to +2 deg in declination. The Aquila Rift is the elongated swath of extinction that cuts diagonally across most of our field and is located at 600–700 pc. Serpens Cirrus is a more diffuse cloud to the southwest of Serpens and is located at pc. can be subdivided into several distinct clouds and star-forming regions (see the map of Gaia DR2 star counts in Figure 1 and extinction maps in Cambrésy 1999 and Green et al. 2015). The Serpens Main star-forming region, located on the northern side of the rift, has historically been the most well-studied site of active star formation within the complex (see review by Eiroa et al., 2008). About 3∘ to the south of Serpens Main, a separate cloud contains the H II region W40 on its east side and Serpens South to the west. W40, discovered in surveys of 22 cm radio continuum emission and H emission (Westerhout, 1958; Sharpless, 1959), includes a compact cluster of 500 candidate young stars (Kuhn et al., 2010; Mallick et al., 2013) and is ionized by several OB stars (Smith et al., 1985; Shuping et al., 2012). Serpens South, a dense embedded cluster in a massive molecular filament, was discovered in the Spitzer survey of Gutermuth et al. (2008) and is rich in protostars (see also Dunham et al., 2015; Könyves et al., 2015). Some young stars and H II regions are also located in a region around MWC 297 (e.g. Bontemps et al., 2010; Dunham et al., 2015; Rumble et al., 2015), hereafter called Serpens far-South. A fourth group of the cloud complex, which we designate Serpens Northeast based on its location 1∘ east of Serpens Main, was found by Dunham et al. (2015) to have its own population of young stars. These groups of young stars are visually interspersed within the Aquila Rift, a set of dark molecular clouds elongated across on the sky (260 pc at a distance of 600 pc).
The physical connection between these complexes has been questioned, in part because the distances to Serpens Main, Serpens South and W40, and the Aquila Rift have been controversial (see discussions in Eiroa et al. 2008, Prato et al. 2008, and Rodney & Reipurth 2008). The VLBI parallax measurements of masers by Ortiz-León et al. (2017) lead to (separate) distances of 436 pc to Serpens Main and to W40. The similarity in velocities indicate that the entire region is located at the same distance (see discussion in Ortiz-León et al., 2017). However, a recent analysis of the X-ray luminosity function of Serpens South placed the cluster at 260 pc (Winston et al., 2018), consistent with the previous identificiation of an extinction wall at pc to both Serpens Main and the Aquila Rift (Straižys et al., 1996, 2003). In the 3D structure of the Milky Way from the velocity analysis of Lallement et al. (2014), the Aquila Rift is also placed at pc. The possible connections in the wider complex have also suffered from uneven accounting of stellar membership; many dedicated surveys on smaller regions (e.g. Kuhn et al., 2010; Povich et al., 2013; Mallick et al., 2013; Dunham et al., 2015) miss most optical members of Serpens Northeast and Serpens far-South that are found in this paper.
With all-sky coverage, Gaia DR2 provides a consistent and near-complete, magnitude-limited set of astrometry and photometry over a full field of interest. When compared to past membership studies, our application of Gaia DR2 astrometry is particularly sensitive to the lightly-absorbed population, including the disk-free (Class III) young stars that are missed in searches based on excess infrared emission. Our search over a wide field of view probes both recent star formation and any population of older stars from in past epochs of star formation. In this paper, we use Gaia DR2 almost exclusively to identify and analyze the population of young stars in the Serpens star-forming regions, and the lack of young stars in the Serpens Cirrus. Distances to different subclusters and to dust extinction regions confirm the accurate VLBI distance measurements of Ortiz-León et al. (2017) to the Serpens star-forming regions222A contemporaneous and independent paper by Ortiz-León et al. (2018) uses Gaia DR2 data to confirm the VLBI distances to Serpens Main, Serpens South, and W40, consistent with our results. and reveal the presence of some dust at 250 pc that is not actively forming stars. Most of the optically-thick dust outside of the active Serpens star-forming regions are located at pc.
2. Sample and Data
Our analysis in this paper is based primarily on data from Gaia DR2. We downloaded all stars in the Gaia DR2 archive (Arenou et al., 2018) in a large area around the star-formation complexes. We began by downloading 1 square degree around both Serpens Main and W40/Serpens South clusters. Our desire to describe the dust extinction in the context of the broader cloud led us to download the surrounding few square degrees. Several iterations later, we had downloaded all million objects in square degrees around Serpens-Aquila, from to degrees in right ascension and to degrees in declination. Star count maps demonstrate that the Aquila Rift extends beyond this region, but we had to stop for our own sanity and so that IDL could run with data arrays of the entire population.
The most relevant data are the stellar positions, proper motions, parallaxes, and , , and -band magnitudes, along with the associated errors and the excess astrometric noise (Lindegren et al., 2018; Evans et al., 2018). The optical photometry from Gaia is supplemented with 2MASS (Cutri et al., 2003). Objects fainter than mag are not considered in the bulk analysis because the unreliability of small parallaxes of faint objects leads to an artificially large population of stars at pc, even after accounting for the listed errors.333 The star-count map for all stars with does not show any evidence for optical extinction until – pc to the Serpens star-formation complex; however, for fainter stars, the extinction regions are prominent in density maps of stars with parallaxes mas ( pc). The tail of the error distribution in parallaxes leads to a background population that would be interpreted as nearby objects. Most analyses in this paper are also restricted to stars with excess astrometric noise less than 2 mas and to stars with parallaxes measured to a signal-to-noise greater than 5–20, depending on the analysis. However, fainter stars and stars with parallaxes consistent with 0 are used when evaluating membership of candidates selected from past surveys. The systematic error of mas in Gaia DR2 parallax measurements (e.g. Luri et al., 2018; Leung & Bovy, 2019) is ignored in our analysis and is applied only in the final measurements of distance.
All star count maps created from Gaia observations in this region include diagonal dips in the number of stars brighter than . These features must be related to some loss in sensitivity or astrometric accuracy, presumably at the edges of the Gaia field of view, as Gaia scans across the sky. The depth and accuracy also depends on star density, which varies strongly across our field. We ignore these systematic problems.
For ease of reference, at 430 pc a distance of one degree corresponds to 7.5 pc, while a proper motion of 1 mas/yr corresponds to 2 km/s.
3. A search for young stars in Serpens
In this section, we identify several young clusters within our field in a search of the 5-D phase space of location, proper motion, and distance. The ability to separate the young stars in the Serpens in both distance and proper motion provides us with the leverage to distinguish the young star population from the field population, without resorting to spectroscopic or even photometric criteria (see, e.g. seminal papers by Blaauw, 1956; de Zeeuw et al., 1999). Photometry is not directly used in these selections, beyond the initial Gaia selection of targets and our brightness requirement of mag. However, the stars in these clusters are located above the main sequence in color-magnitude diagrams (see Section 5.2), which reinforces the conclusion that they are young.
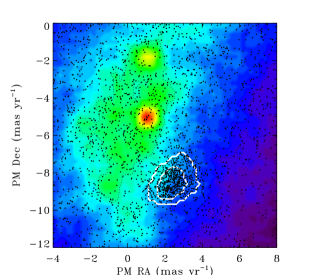
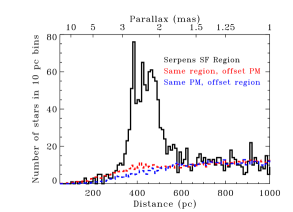
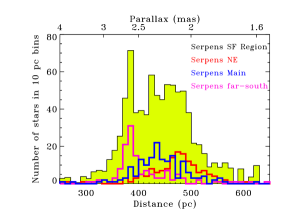
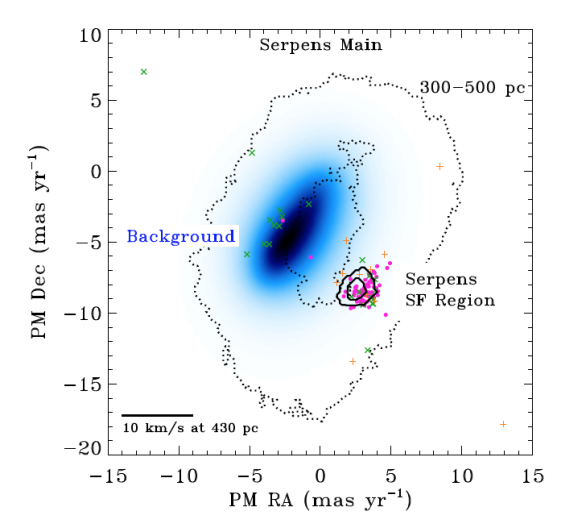
Although the density of stars is high towards Serpens, the members of the star-forming regions and young clusters are readily identified in both proper motion and distance. Figure 2 shows the proper motions of all stars in the full field with distances pc (see Fig. 3 for this circular logic) and parallaxes measured to better than , for the full field (except Serpens) and for a box around Serpens, between to degrees in right ascension and to degrees in declination. A clear over-density of stars is visible at PM(RA) mas/yr and PM(Dec) mas/yr. In this initial analysis, this Serpens box includes 470 stars with proper motions within 1 mas/yr of the Serpens centroid; the same distribution as the rest of the field would have yielded only stars in the same region. The distribution of parallaxes of stars within this box (Figure 3) shows a large excess at 350–500 pc, the expected distance for the Serpens star-forming region.
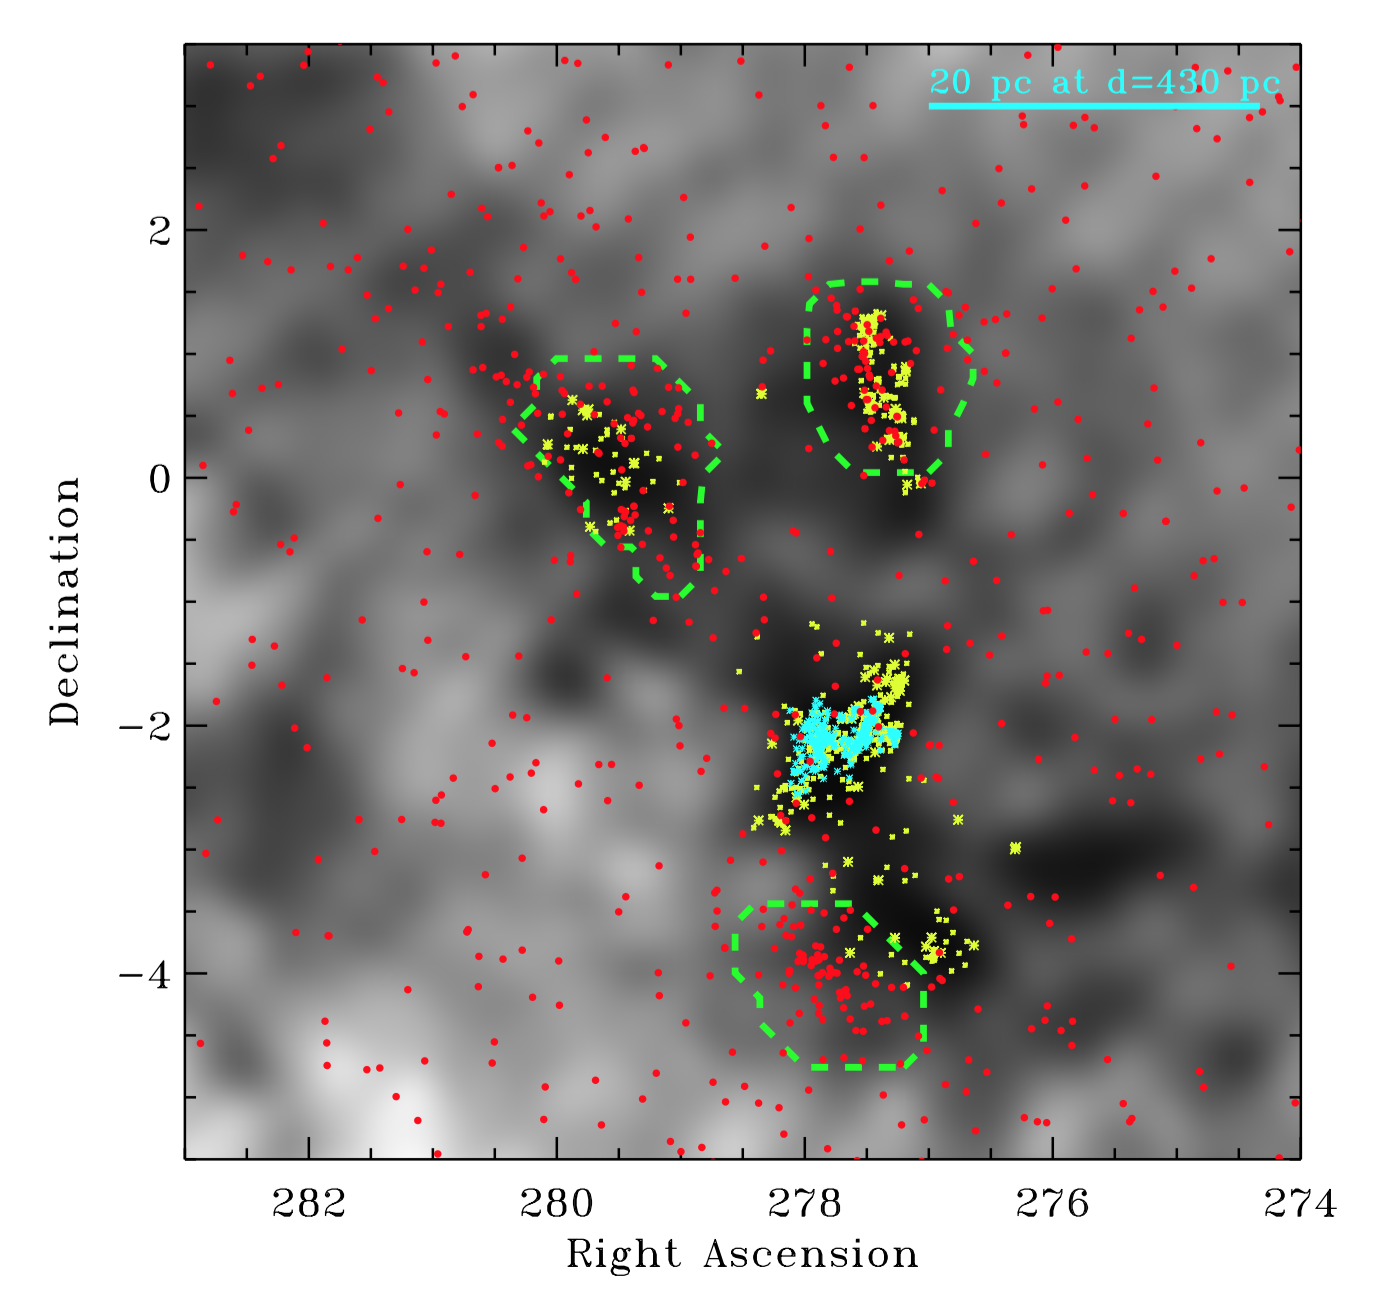
This overdensity in proper motion and parallax space corresponds to the optical members of the Serpens star-forming region. Figure 4 shows the spatial distribution of stars between 350-550 pc and with a proper motion within 2 mas/yr of the centroid proper motion. Three distinct regions stand out: the optical counterparts of Serpens Main and Serpens Northeast, as well as a region associated with MWC 297 and Sh 2-62, here called Serpens far-South (also sometimes called the MWC 297 group or region, Rumble et al. 2015). The intervening drop in stellar density between Serpens Main and Serpens Northeast does not correspond to any increase in extinction, which demonstrates that the two subclusters are distinct.
The properties of each sub-cluster are listed in Table 1. The distance, location, and proper motion are first estimated with loose distance and proper motion criteria for a sample of stars with parallax measured to . The distance is then refined from parallaxes of a restricted candidate membership criteria, restricted to stars with (here is the scatter in proper motions, not an uncertainty) of the proper motion centroid and within – degrees of the spatial centroid of the cluster. The proper motion is refined with a similar membership criteria, with a restriction in distance rather than proper motion. The final proper motion median and standard deviation is calculated by fitting a Gaussian profile to the proper motion in both right ascension and declination. The final distance measurement is calculated by a weighted average of the parallax, with a statistical uncertainty of 1–2 pc. The listed standard deviation in the distance is the standard deviation in a distance spread that is required to reproduce the observed spread in parallaxes. The distance spread for Serpens far-South is 2 pc, indicating that the measured distance spread is nearly consistent with the spread expected from only the parallax errors of the members. Other regions have distance spreads that are larger than the projected radius of the cluster, which indicates that either the parallax errors are underestimated, that a population of distributed young stars within Serpens contaminates the sub-cluster population, or that the sub-clusters are elongated along our line of sight.
3.1. The Total Optically Bright Population of the Serpens Star-forming Regions
In this subsection, we estimate the total number of stars in our sample that are located within each of the sub-clusters identified above, as well as the total number of stars within the Serpens Star-forming region. These populations measured by estimating a radial size of the cluster using star counts and subsequently measuring the number of stars from the distribution of proper motions within a circular area (Table 2). The stars are best separated from field stars in the proper motion in declination, so the total number of stars is measured by fitting a Gaussian profile to that distribution within some circular area on the sky. Figure 5 shows that the stars extend to (26 pc) for 90% completeness, from an approximate center of and . No significant population of young stars is detected between 3.5–4.5∘ of this location. A small population of young stars in Serpens is located beyond and is discussed in §3.2.
The Serpens star-forming region includes 1167 members (evaluated statistically) with Gaia DR2 parallaxes with . Roughly 60% of those stars are located within one of the three main optical clusters; a few additional stars are likely members of the W40/Serpens South cluster. The remaining stars are distributed throughout the region. The accounting of optical members likely misses at least half of the full membership, for many reasons. The color-magnitude diagrams (discussed in §5) indicate a sensitivity to stars with masses larger than 0.2–0.3 M⊙. The embedded protostars are optically-faint and not detectable with Gaia (see §6.1). Our accounting also misses almost all members of W40 and Serpens South (Povich et al., 2013; Mallick et al., 2013; Dunham et al., 2015), including any diskless population, because they are buried deep in the molecular cloud. Any stars on the back side of dark clouds would also be too faint for Gaia.
| Name | RA | Dec | PM(RA) | (PM RA)b | PM(Dec) | (PM Dec)b | c | ||
| deg | deg | deg | mas/yr | mas/yr | mas/yr | mas/yr | pc | pc | |
| Serpens Main | 0.5 | 277.51 | 1.08 | 3.08 | 0.57 | -8.55 | 0.61 | 438 | 11 |
| Serpens Northeast | 0.8 | 279.54 | 0.37 | 2.61 | 0.41 | -8.05 | 0.40 | 478 | 6 |
| Serpens far-South | 0.7 | 277.91 | -3.88 | 2.05 | 0.25 | -8.96 | 0.28 | 383 | 2 |
| LDN 673a | 0.5 | 290.25 | 11.28 | 2.46 | 0.32 | -10.25 | 0.24 | 407 | 16 |
| a: values calculated for all sources with parallaxes of . | |||||||||
| b for proper motions are the standard deviation of the population. | |||||||||
| c for distance is the standard deviation of the population, after correcting for uncertainties in parallax. | |||||||||
| The systematic error in parallax of 0.1 mas dominates the uncertainty in the distance. | |||||||||
| Name | (deg) | ||
| Serpens Main | 81 | 265 | 1.2 |
| Serpens Northeast | 80 | 251 | 1.5 |
| Serpens far-South | 73 | 132 | 1.3 |
| Distributed | 105 | 519 | – |
| Total Serpens Populationb | 339 | 1167 | 3.6 |
| and : number of members with and . | |||
| Uncertainties , see text | |||
| b Includes the three sub-clusters and the distributed population | |||
While the statistical measurement on the number of members is accurate, the membership probability for any individual star depends on the field population. This probability is higher for stars with parallaxes measured with and for those with proper motions and locations near the respective centroids of each cluster. The total population from this specific analysis is accurate to , with the uncertainty dominated by the uncertainty in defining the region in physical, proper motion, and distance space. The subtraction of field stars does not significantly contribute to these errors. More advanced techniques will eventually assess membership probabilities and then analyze cluster properties based on those probabilities, but the use of python codes is beyond the scope of the career of the first author.
This approach to identifying cluster members excludes any runaway stars that were ejected with proper motions larger than 2 mas/yr (4 km/s) away from the centroid proper motion of the cluster. While such stars are interesting for understanding cluster dynamics, they comprise a negligible fraction of the total population of a young cluster. The distribution of proper motions for these young clusters yield a 90% completeness within 4 km s-1. Our analysis also preferentially excludes many stars with disks that are viewed edge-on. Variable young stars with associated nebulosity also have unreliable astrometry (e.g., V883 Ori, Lee et al. 2018; Sz 102, Fang et al. 2018), and would therefore tend to have high astrometric errors and/or proper motions and parallaxes that suggest non-membership. Many binaries will also have been excluded from the Gaia DR2 astrometric catalog.
3.2. Searching for isolated groups of stars
In the previous subsections we identify subclusters and distributed populations of young stars in the Serpens Molecular Cloud. Past epochs of star formation may have produced populations that have since traveled away from the current epoch of star formation. The absence of these older populations places strong constraints on the star formation history, discussed in §5.4.
Some small groups of stars that are distant from the general boundaries of the active Serpens star-forming region may also be related to Serpens. A small overdensity of stars related to Serpens Northeast extends deg (16 pc) northeast of the main cluster, while the Serpens far-South overdensity extends deg to the southwest. A group of stars around LDN 673, including AS 353Aab, and a group of 5 stars around FG Aql have proper motions and distances consistent with Serpens membership, but are located pc away on the sky. These small groups are identified here only because of prior knowledge of their likely youth (Rice et al., 2006), and they would otherwise be challenging to detect. Other small groups of 5–20 young stars are likely to be present throughout the Serpens-Aquila field.
Expanding the proper motion cut to 5–10 mas/yr within the centroid of Serpens leads to the identification of IC 4665, IC 4756, and NGC 6633 (e.g. Dias et al., 2002). The proper motions and ages of these clusters444The ages of Dias et al. (2002) should be accurate, since their pre-Gaia distances are within 5% of their Gaia DR2 distances. together indicate that they are not directly associated with the clouds that are now forming stars in Serpens. Searching for clusters from to pc yields Collinder 359 (e.g. Lodieu et al., 2006; Cantat-Gaudin et al., 2018a), a young cluster located pc that may be related a previous epoch of star formation in Serpens.
No significant sub-clusters of young stars are identified in Serpens Cirrus, located at pc (see §4). Our blind search may have missed clusters at proper motions more than 5 mas/yr away from the centroid of the Serpens proper motion. However, the stars between 225–275 pc () are distributed smoothly across the downloaded area. When divided into square degree regions, the stellar distribution is nearly consistent with a Poisson distribution with 6.5 stars per 0.25 square degree. The proper motion distribution also does not show any significant excess. A small number of young stars may be present and distributed across the region, however, no clusters are present with young stars.
Our search for young stars does not include a rigorous evaluation of populations at pc, including whether any young stars or star formation is associated with the Aquila Rift ( pc).
4. Measuring the distance to dust extinction
In the previous section, we identified likely members of the Serpens-Aquila star-forming region, located at 350–500 pc and sharing a common proper motion. Dust extinction occurs over much wider areas than the stellar clusters. Clouds may be located at different distances than the visually-associated stellar clusters, and in any star formation region with a distance spread, the optical counterparts of a molecular cloud will be biased to members that are in the foreground of the cloud. In this section, we exploit the stellar distances of field stars to quantify the location and distance to dust extinction in the Serpens and Aquila clouds.
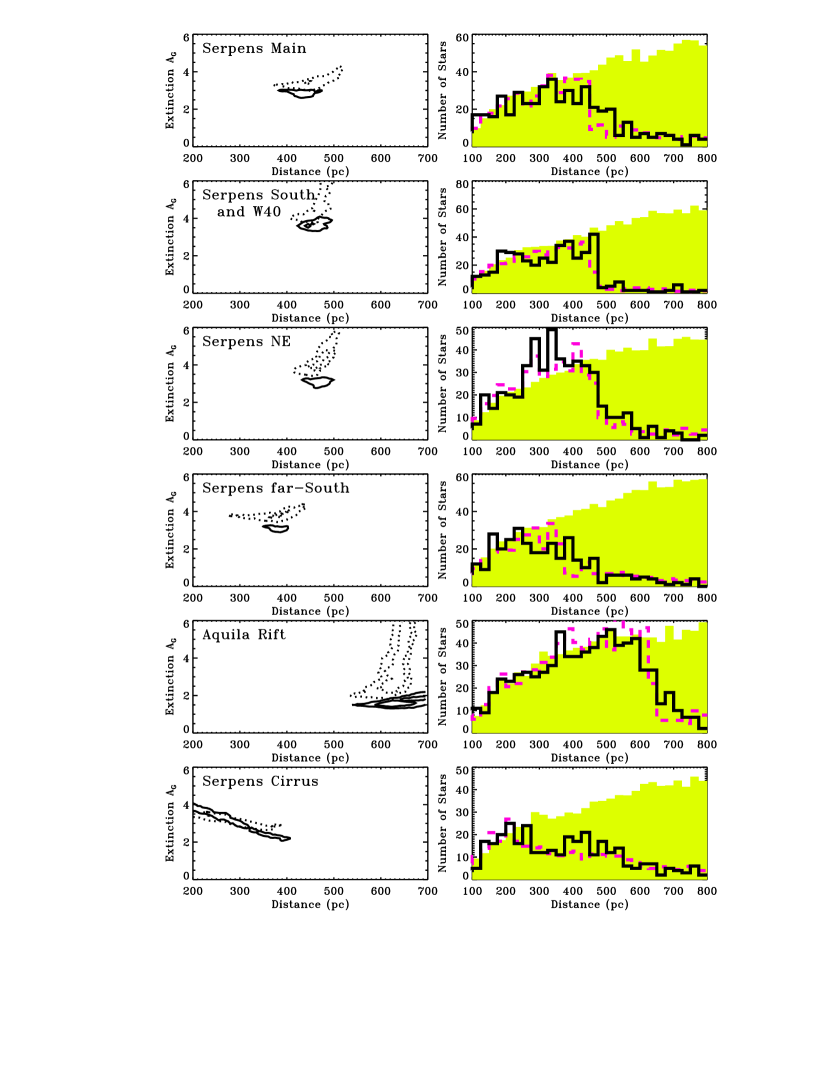
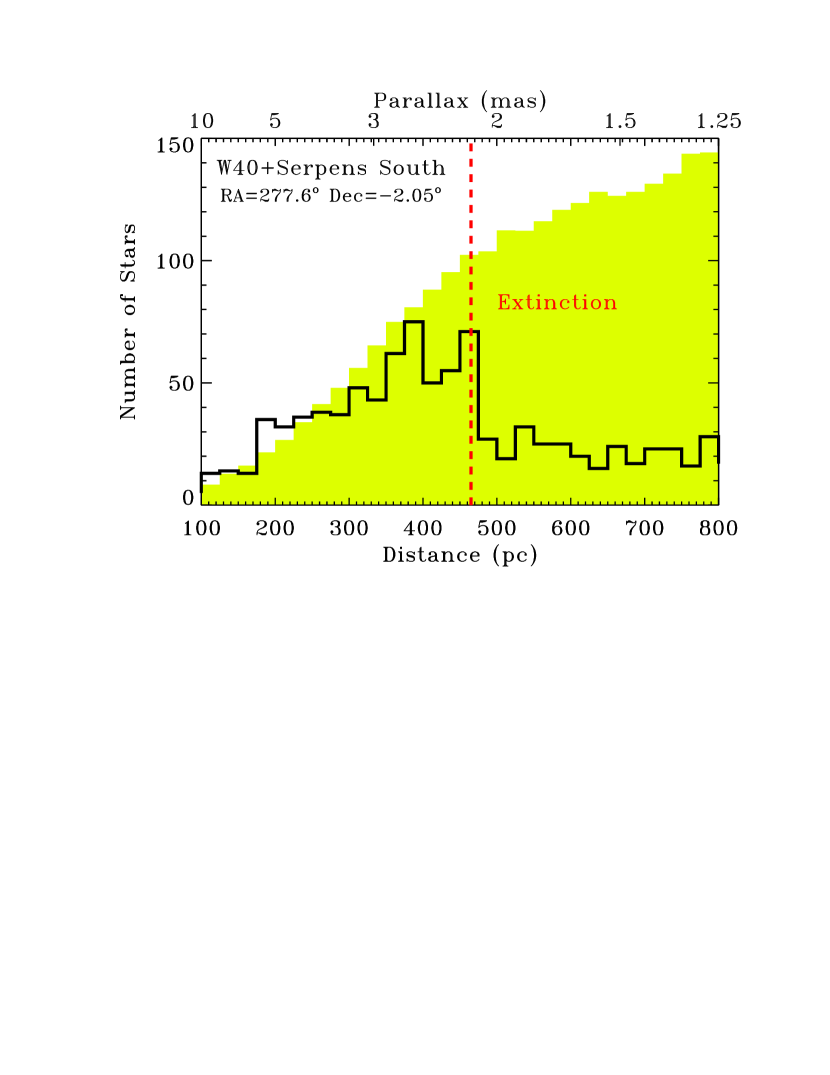
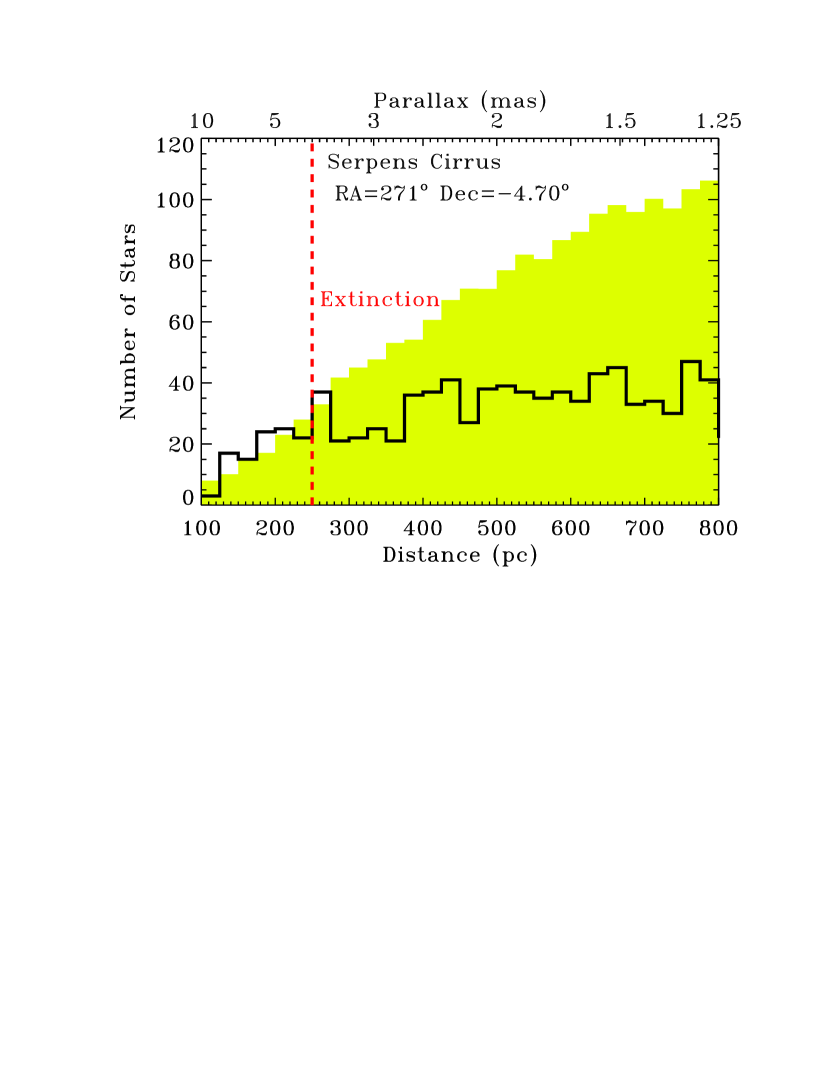
Figure 6 shows histograms of star counts versus distance for stars within a region, compared to an off-cloud from within in galactic latitude located south of the galactic plane. The star counts include stars with proper motions more than 3 mas/yr (6 km/s at 400 pc) from the centroid proper motion of Serpens members and with parallaxes with . The proper motion cut ensures that our selection focuses on field stars and is not influenced by any increase in young stars that are associated with the Serpens-Aquila complex. For stars within degrees of Serpens South, the star counts drop dramatically at pc, indicating that the dust extinction occurs at approximately that distance. On the other hand, southwest of Serpens, the star counts deviate from the off-cloud region at pc.
This comparison establishes that clouds are present at multiple distances, and that measuring cloud distances with star counts is feasible. In this section, we first map the star counts with different distance cuts to determine the extent of the Aquila and Serpens clouds. We then quantify the distance to the dust extinction by simulating populations in different lines-of-sight.
4.1. Three-dimensional maps of dust
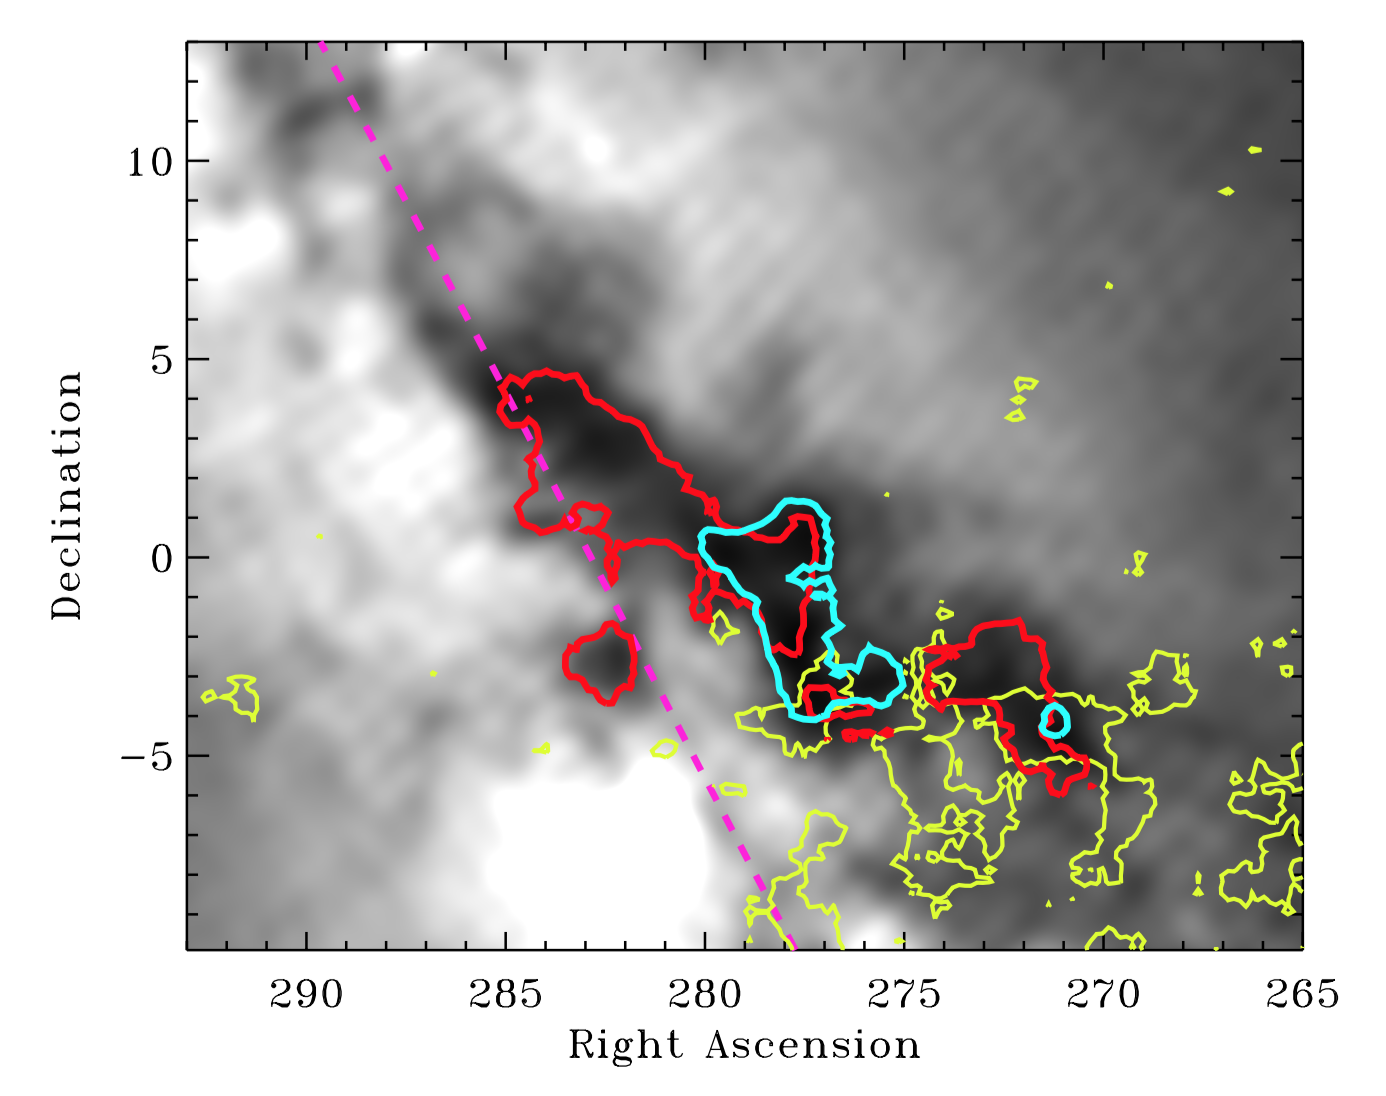
Figure 7 shows contours of the ratio of star counts with a range of distances, as a proxy for extinction at pc, pc, and pc. At each location in the map, the total number of stars555 and proper motion mas/yr from the Serpens centroid. within some distance range is divided by the number of stars within some more nearby range of distance. For example, the dark clouds in Serpens can be seen in the ratio of the number of stars between pc, , divided by the number of stars between pc, . All ratios are normalized by the median ratio from regions in our map that are assumed to be free of extinction.
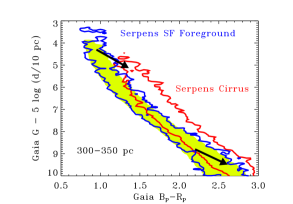
The contours of star count ratios show the locations where extinction occurs between those two distances666The location of these dust features are robust to different choices for the expected ratio of number of stars in each distance bin, including corrections for galactic latitude.. The prominent extinction features associated with the Serpens star-forming compexes are located at 400–500 pc. Most of the extinction to the northeast of the Serpens star-forming cluster and in some adjacent dark clouds occurs at pc, called the Aquila Rift. Star counts at distances beyond pc demonstate that the Aquila Rift extends across our entire field-of-view. The region to the southwest of Serpens star-forming regions, here called Serpens Cirrus, has a deficit of stars between 300–400 pc, relative to the number between 30–250 pc. The color-magnitude diagram of stars toward Serpens Cirrus (Figure 8) confirms the pc distance to this dusty region, with a stellar locus that is offset by mag in from the downloaded area (see Appendix A for the calculation of extinction vectors). The stars in front of the Serpens star-forming regions are not reddened relative to off-cloud regions, indicating the absence of any significant foreground extinction.
These comparisons provide an accurate assessment for the distance to the closest location that extinction occurs along the line-of-sight, if the extinction is sufficiently opaque. Extinctions of may not be readily detectable in such star count ratios for nearby regions, but significantly alter the detected distribution of apparent magnitudes. Such star count maps may therefore create the misperception that an optically-thin, nearby cloud is actually located at a much larger distance.
4.2. Quantifying the distance to individual clouds
The star count maps described above reveal regions with significant extinction. To quantify the distance to regions of extinction, we compare the measured star counts versus distance to simulated star counts from off-cloud regions, after introducing a cloud at a given distance. Because the astrometric accuracy depends on brightness, the populations need to be simulated to quantify the distance and distance uncertainty to the extinction region. Appendix B describes our simulations of star counts versus distance for a sheet of extinction at some distance.
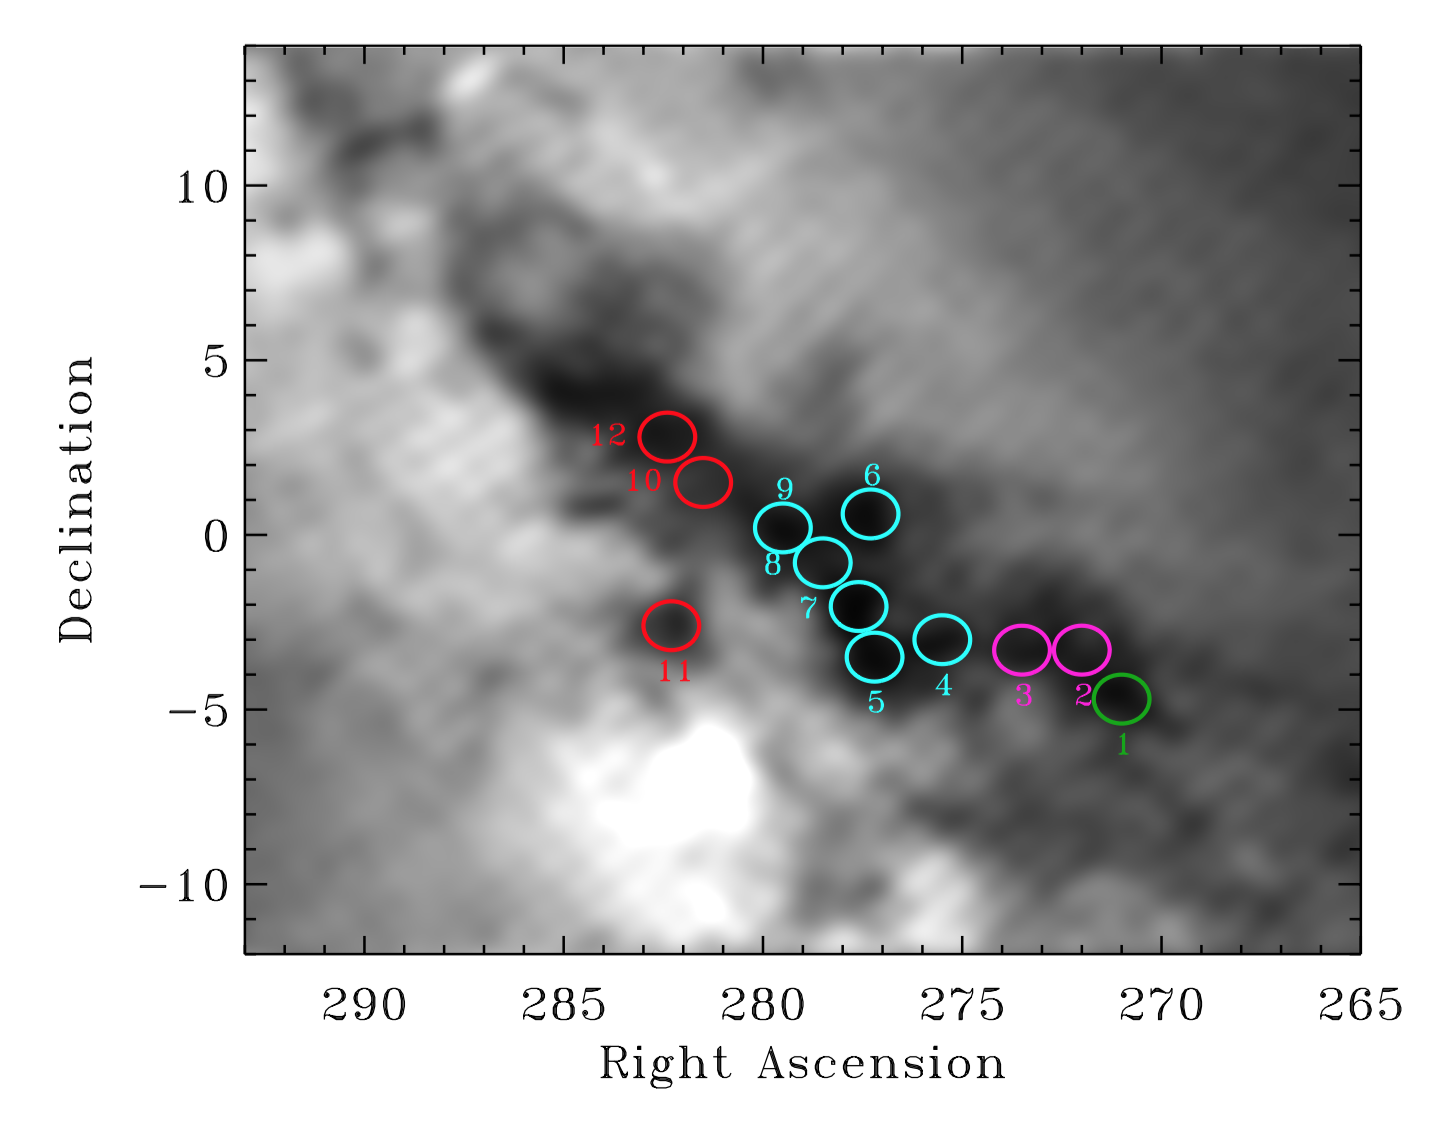
Table 3 and Figure 18 present our distance measurements to dust extinction for 12 circular areas on the sky. The dark clouds associated with young star clusters all have distances that are consistent with the measured distances to the young clusters (see §3). Along the Aquila Rift, the optically-thick clouds are located at pc to the southwest and to the northeast of Serpens. Serpens Cirrus is located closer to us than the Serpens star-forming clouds, as suggested in §4.1. The star counts to Serpens South and Serpens Main appear to have a deficit at pc, which is well explained by simulating Gaia data from off-cloud populations for a single, optically-thick cloud at pc and should not be interpreted as indicating the presence of foreground dust at the distance of Serpens Cirrus (see also Figure 8). Stars that are in the foreground of the cloud may have a measured parallax (after accounting for uncertainties in parallax) that leads to a distance behind the cloud. Most stars that are physically behind the cloud are too faint to be detected by Gaia, and therefore no corresponding population of background stars has measured parallaxes that would place them in front of the cloud.
These distances are calculated by estimating the probability that the star counts for each region are from the same sample as the extinction-corrected off-cloud population. The probability is evaluated with a Kolmogorov-Smirnov test, for simulations with distance and extinction in a grid with a spacing of 5 pc and 0.1 mag. The star counts used for the Kolmogorov-Smirnov test have parallaxes with distances from 100–800 pc, measured with . The adopted distance in Table 3 corresponds to the grid point with the highest probability in the Kolmogorov-Smirnov test. The contours in Figure 18 show the parameter space that can be ruled out at and confidence. The and are then evaluated as the minimum and maximum distances that cannot be ruled out at the 95% confidence level. These 12 regions are selected in part because their best-fit extinction is mag, which generates tighter constraints on the distance than if the extinction were lower; a few areas within our downloaded dataset have high extinction but were also excluded.
The parent population for these measurements is obtained from regions that are thought to be unaffected by extinction and are located at a similar galactic latitude (within of the centroid), but south of the galactic plane. Most extinction in the downloaded Serpens-Aquila area occurs at north galactic latitude. In simulations with off-cloud populations located in north of the galactic plane or separately in annuli around each region, the distances are similar but extinctions are smaller.
The distance to a dark cloud corresponds to the front of that cloud, where the stellar density initially drops. Most dust structures in our image extend deg ( pc)in diameter on the sky and are therefore not deep along our line-of-sight. The assumption that these dust clouds are located at a single distance is reasonable, unless the structures are 1-dimensional filaments aligned along our line-of-sight. However, each region may include multiple clouds located at different distances, and the clouds themselves are likely filamentary.
| Number | Name | RA | Dec | (pc) | (pc) | (pc) | |
| 1 | Serpens Cirrus | 271.00 | -4.70 | 235 | 200 | 405 | 3.4 |
| 2 | LDN 486d | 272.00 | -3.30 | 515 | 430 | 575 | 2.7 |
| 3 | LDN 500d | 273.50 | -3.30 | 495 | 200 | 585 | 2.6 |
| 4 | LDN 505d | 275.50 | -3.00 | 445 | 365 | 480 | 3.3 |
| 5 | Serpens far-South | 277.20 | -3.50 | 370 | 350 | 400 | 3.7 |
| 6 | Serpens Main | 277.30 | 0.60 | 445 | 385 | 475 | 3.4 |
| 7 | Serpens South/W40 | 277.60 | -2.05 | 460 | 425 | 495 | 4.4 |
| 8 | Serpens | 278.50 | -0.80 | 415 | 375 | 470 | 3.0 |
| 9 | Serpens NE | 279.50 | 0.20 | 465 | 435 | 495 | 4.0 |
| 10 | LDN 603d | 281.50 | 1.50 | 585 | 480 | 590 | 2.0 |
| 11 | LDN 566 | 282.30 | -2.60 | 590 | 540 | 695 | 2.0 |
| 12 | LDN 610 | 282.40 | 2.80 | 630 | 540 | 695 | 2.7 |
| aCalculated for projected circles with radii of deg from the listed center | |||||||
| b and are minumum and maximum distances | |||||||
| ! that cannot be ruled out at 95% confidence, see Figure 18. | |||||||
| cExtinction values are an average over the full region and are not reliable. | |||||||
| cLDN association is approximate. | |||||||
5. Discussion and Speculation
The Gaia DR2 view of the Serpens star-forming regions and the Aquila Rift reveals a complex set of star clusters and molecular clouds. The young stars are distributed across five different sub-clusters, three of which are detected by Gaia DR2 and have measured distances of 383–478 pc. The subclusters that are furthest apart, Serpens far-south and Serpens Northeast, are separated by 35 pc in projected space but by 95 pc along our line of sight. These clusters are likely part of the same cloud complex, since the molecular gas is located at similar velocities (Dame & Thaddeus, 1985; Dame et al., 2001; Davis et al., 1999). The Serpens star-forming cloud complex is therefore elongated along our line of sight, and may be a branch of the much larger set of molecular clouds in the Aquila Rift, which has a distance of 600–700 pc to the northeast of the Serpens star-forming regions and pc to the southwest of the active star-formation.
Some light extinction also occurs to the southwest of the main Serpens complexes at pc, called Serpens Cirrus. The distance to Serpens Cirrus confirms the accuracy of distance measurements to dust extinction from the maps of Straižys et al. (2003). However, this distance should not be applied to any known clusters of young stars, consistent with the conclusions of Prato et al. (2008). Serpens Cirrus is not entirely devoid of ongoing star formation; the dark cloud L483 hosts a protostar (e.g. Tafalla et al., 2000) and with an approximate distance of 250 pc seems to be associated with Serpens Cirrus. Some candidates identified by Dunham et al. (2015) in the southwestern-most region of their map, around (,), may also be young stars. The separation in distance between the main Serpens star-forming clouds and the Serpens Cirrus is also consistent with the 3D extinction maps of Lallement et al. (2014).
The distances listed here are calculated from parallax measurements that have systematic uncertainties of mas (Luri et al., 2018). The accuracy of VLBI measurements therefore exceeds that of Gaia DR2. The distance to two sources in Serpens Main777The VLBI distance to Serpens Main excludes the star GFM 65, which has a distance and proper motion that are highly discrepant from the Serpens Main cluster, indicating either that the observational uncertainties are underestimated for this source, that it is a remarkable runaway, or that it is a non-member. The distance would place the star in front of the cloud. of pc, as obtained from VLBI measurements of maser emission (Ortiz-León et al., 2017), is consistent with our distance of (statistical error) pc (systematic) to cluster members and pc (error bar corresponds to 95% confidence interval) to the cloud extinction. The VLBI distance to four sources in W40 and Serpens South of pc is also consistent with the distance of pc to the dust extinction to W40 and Serpens South. The number and color-magnitude diagram of stars in this region at pc indicates a lack of optically-thick dust within those distances, thereby excluding the possibility that Serpens South is located in the foreground.
Only five stars have astrometry from both Gaia and VLBI, and three of those stars have high astrometric noise, so we cannot evaluate systematic differences. The average proper motion of Serpens Main calculated here is consistent with the VLBI proper motions of GFM 11 and EC 95. Of the four VLBI astrometric measurements in in W40 and Serpens South, three have proper motions that are offset by a few mas/yr from the motion of the other Serpens clusters, consistent with a possible offset of km s-1 in proper motion of faint candidate members (see §5.3.2).
The distances to the Serpens star-forming clouds are consistent with the distances estimated by Green et al. 2015 from 3D dust maps obtained with Pan-STARRS (see also Green et al., 2018). However, the stilism (Capitanio et al., 2017) map of extinction suggests that the Serpens clouds are located at pc, perhaps because of cloud confusion. Our distances are also remarkably consistent with the supposedly-crude pc photometric distance to HD 170634, located in Serpens Main, by Racine (1968) and Strom et al. (1974).
5.1. Evaluating Selected Past Membership Surveys
Gaia astrometry allows us to evaluate the optically-bright candidate members of Serpens that have been identified by past surveys. Table 6 lists the number of objects in selected papers with a Gaia match888Including all Gaia DR2 targets with astrometry, with no limit on but restricted to targets with excess astrometric noise mas, with statistics following the classification of each match as either a robust non-member or as consistent with kinematic membership. The contamination rates described here are generally measured to stars that are not located deep within the clouds. In regions with high densities of members, the contamination rates are likely much lower. On the other hand, in regions with low densities of members but with dark clouds, the contamination rates are likely underestimated because background objects will be too faint for detection by Gaia.
Non-membership is assessed if the proper motion is more than 2 mas/yr () away from the Serpens centroid or if the distance is away from the 370–490 pc range. Stars that have kinematics consistent with membership have proper motions within those ranges. Consistency with the Serpens distance is ignored if the parallax uncertainty is larger than mas, although inconsistency may be assessed for any parallax uncertainty. Gaia stars are considered a match if they are within of a Spitzer mid-IR position and of a near-IR or X-ray position. Most stars that are listed in catalogs but not matched with Gaia targets are optically-faint, likely because they are located within or behind molecular clouds, because they are embedded in a dense envelope, or both.
The evaluation of memberships described here is based primarily on the census of Serpens from Spitzer maps of Dunham et al. (2015), which cover a wide area on the sky999Dunham et al. (2015) splits the population into Serpens, which includes Serpens Main and Serpens Northeast, and Aquila, which includes Serpens South, Serpens far-South, and regions along the Aquila Rift to the southeast of Serpens. We divide these regions visually into additional sub-regions, see Table 6.. Since the Dunham et al. (2015) catalog establishes membership for most of the Gould Belt, this evaluation helps to inform us of the reliability of different aspects of that catalog. Serpens Main and Serpens South have additional membership catalogs that are also evaluated here. For regions with optically-thick dust, the Gaia matches are optically bright and are therefore more likely to be foreground non-members than either members or background contaminants, so contamination rates for the youngest regions are unreliable. Gaia kinematics are also unable to probe the protostellar population, though the contamination rate of that population is likely to be low; Heiderman & Evans (2015) confirmed that 90% of protostar candidates in the Dunham et al. (2015) catalog have envelopes.
Most previously known stars with Gaia kinematics consistent with membership are located in Serpens Main. The Gaia-matched Class II objects from Dunham et al. (2015) have a membership probability of 86%, while the evolved (Class III) objects have a 50% probability of membership. Other IR and X-ray surveys have similar contamination rates. The 47% contamination rate for 74 Gaia-matched objects in the Eiroa et al. (2008) catalog is higher than expected. Inspection of these contaminants indicate that many were classified as candidates from near-IR photometry and lack spectroscopic confirmation.
For Serpens South and W40, very few sources that have been previously identified as candidate members can be evaluated with Gaia. The rejection rates from samples of disks and X-ray emitters (Kuhn et al., 2010; Dunham et al., 2015; Getman et al., 2017; Winston et al., 2018) with Gaia matches are 60%, while the rejection rate for Povich et al. (2013) is 80%. However, many of the objects in this region are clustered in proper motion and are offset by 5 km s-1 from the proper motion centroid of the three main optical clusters. These objects may be young, if the proper motion of Serpens South and W40 are offset from the rest of the Serpens complex (see further discussion in §5.3.2).
In most locations beyond the dense clusters, the Gaia matches to the Dunham et al. (2015) catalog demonstrate that the candidates are non-members, most with kinematics consistent with the background population. The classification of stars as background AGB stars by Dunham et al. (2015) are almost all confirmed. Most evolved stars outside of Serpens Main and Serpens South are also classified here as background objects; this category was intended to include diskless (class III) young stars with an expected contamination rate of 25–90%. The protostars in Serpens Northeast and Serpens far-South are likely robust. The one protostar and other matches to the southwest of the main Serpens clusters may be coincidental.
These contamination rates in the Spitzer-based population of Serpens and the Aquila Rift are likely not significant for some other regions evaluated by Dunham et al. (2015). The background population of AGB stars is much higher for Serpens, seen against the galactic plane, than for other nearby regions in the Gould Belt, which have higher galactic latitude. However, the Spitzer-based census of the Lupus V and VI star-forming region suffers from similar contamination of background stars, when evaluated with Gaia DR2 astrometry (Manara et al., 2018). The contamination in these populations will affect ratios of pre-main sequence stars in different stages of evolution.
5.2. -band Excess Disk Fractions of the Gaia members
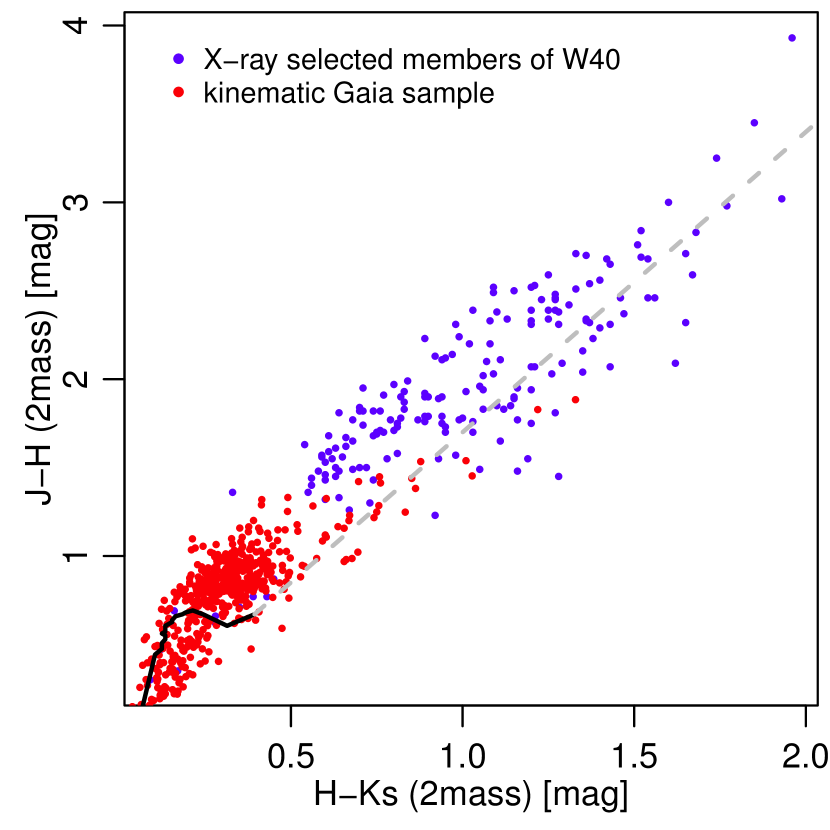
For young pre-main-sequence stellar populations, disk fractions may be used as a proxy for relative stellar ages (e.g. Haisch et al., 2001; Hernández et al., 2008; Mamajek, 2009; Fang et al., 2013; Richert et al., 2018). In this analysis, we use 2MASS JHKs photometry (Cutri et al., 2003) to directly compare the inner disk fraction of the Gaia-selected kinematic members of Serpens to the disk fraction analysis of W40 by Kuhn et al. (2010). Excess emission in the band is used here as a proxy for emission from hot inner disks (see, e.g., Meyer et al., 1997). Although less sensitive than a mid-IR survey, 2MASS photometry covers the full region (unlike Spitzer), has fewer problems with blending and saturation in W40, and may be directly compared to a previous analysis of W40 using the same methodology.
Figure 10 shows kinematically-selected sources from this work and X-ray-selected sources from Kuhn et al. (2010) on a versus color-color diagram. Following Kuhn et al. (2010), the 1 Myr Siess et al. (2000) isochrone is drawn and a reddending vector from 0.2 is used as an approximate separation between sources with and without -band excess. The majority of the stars within W40 are more deeply embedded than the population seen by Gaia. In W40, the -excess fraction of 50% (after correcting for selection effects), while for the Gaia-selected sample the Ks excess fraction is %. The Gaia sources that do lie to the right also tend to be subject to higher extinction than the majority of the Gaia sources.
The lower inner disk fraction for the Gaia kinematic sample is consistent with the expectation that the optically-bright populations are older stars, while the younger stars and protostars are located deep within the molecular cloud. This radial age gradient is often seen in star-forming regions (Getman et al., 2014, 2018; Jose et al., 2016), either because older stars drift outward or because the molecular material rapidly disperses after forming stars (see §5.3.3). This comparison of near-IR disk fractions are also influenced by selection effects, since local extinction from circumstellar disks may hamper the sensitivity of Gaia, and by differences in applying this technique to samples with very different extinctions and mass distributions (see also Soderblom et al. 2014 for a description of the uncertainties in using disk fractions for age estimates). An evaluation of disk presence with mid-IR photometry would yield higher disk fractions. Nevertheless, the 4% fraction of stars with inner disks is much lower than would be expected for a very young region, such as W40, and may indicate that the optically bright population has an average age of 5–10 Myr. The more embedded regions that were not detected by Gaia have much younger ages.
5.3. Describing the clusters
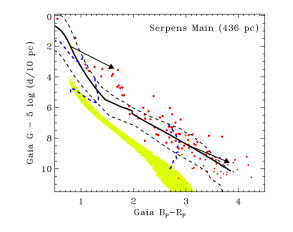
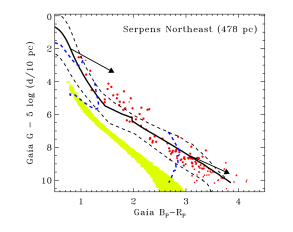
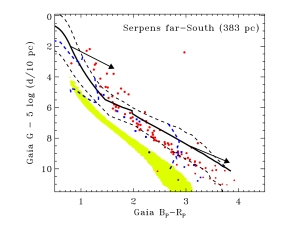
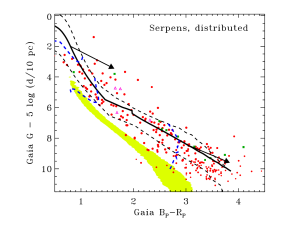
The young stars in Serpens are preferentially located in a few clusters. Figure 11 shows color-magnitude diagrams for the three optical clusters and for the distributed population of young stars in the region. The magnitudes are corrected for the average distance to each cloud but are not corrected for extinction. Individual stellar distances are used for the distributed population.
Almost all candidate members are located above the main sequence and are consistent with the pre-main sequence locus, despite a selection that did not include photometry. These candidates therefore have a very high membership probability, even without spectroscopic confirmation. Table 7 provides the Gaia DR2 astrometry and photometry for these high-probability objects. A complete (rather than a statistical) sample of members would require spectroscopic confirmation of stars with low-to-modest probability of membership.
The stellar positions of likely members are compared to the unreddened PARSEC isochrones (Bressan et al., 2012; Marigo et al., 2017) using the BT-Settl colors (Allard, 2014). If we infer a typical extinction of mag (neglecting differential reddening within a cluster and the effects of accretion), then this Gaia DR2 identification of members is sensitive to M⊙, with a completeness that is high in low-extinction regions and for higher masses. The estimated cluster ages for this extinction range from Myr for Serpens Main to Myr for Serpens far-South and the distributed Serpens population. These ages are younger than expected for the (-band excess) disk fraction of 4%. Resolving this tension will require analyses of individual stars, which is beyond the scope of this paper, and the resolution of long-standing challenges with ages of young stars (see review by Soderblom et al., 2014). However, even if the oldest populations have ages of 10 Myr, the challenges described below are still robust, just scaled to an older age.
5.3.1 Serpens Main
Serpens Main was the first young sub-cluster in this region to be systematically evaluated (Eiroa & Casali, 1992). The dust extinction distance of pc is consistent with the stellar distance of 438 pc and the VLBI distance of 436 pc from Ortiz-León et al. (2017). The HR diagram reveals a luminous population, indicating a young ( Myr) age, and a large dispersion in luminosity expected for such a young cluster (see discussion in Soderblom et al., 2014).
The cluster is rich in both protostars and disks, with the protostars concentrated in small regions within this cloud. If the Gaia-based contamination rate applies to the disks and diskless populations from Dunham et al. (2015), the protostar/disk fraction would be and the disk/diskless fraction would be . This sub-cluster is evolved enough for many members to be optically-bright. No gradient in proper motion is detected, so most of the visible stars have not traveled far from their birth location.
5.3.2 Serpens South and W40
W40 and Serpens South is the most populous region in the Serpens region. However, the protostars in Serpens South are located deep within the molecular cloud, which is why it was not recognized as such an active region of star formation until mid-IR surveys (Gutermuth et al., 2008). Dunham et al. (2015) identify 374 IR-excess sources (protostars and disks), while Povich et al. (2013) and Mallick et al. (2013) identified 983 and 1202 likely members from 2MASS and IRAC analyses, respectively101010The Mallick et al. (2013) sample is a superset of the Povich et al. (2013) sample. Dunham et al. (2015) required a detection in the MIPS 24 m band, while Povich et al. (2013) and Mallick et al. (2013) required Spitzer detections only in IRAC 3.6 and 4.5 m images. Many additional protostar candidates have been identified with Herschel (Bontemps et al., 2010; Könyves et al., 2015). All samples produce targets that are clustered along the filaments associated with Serpens South and W40.. The total population of Serpens South and W40 may be similar to the total membership of other Serpens clusters, depending on the contamination rate.
The combined W40 and Serpens South region has a VLBI parallax distance of 436 pc (Ortiz-León et al., 2017). The optically-thick extinction to this combined region occurs at pc. We therefore conclude that the W40 and Serpens South clusters are likely located at the same distance, as inferred by Ortiz-León et al. (2017), so that their VLBI parallax distance should be adopted for both Serpens South and W40 (see also an independent analysis of Gaia DR2 astrometry by Ortiz-León et al., 2018). Only a few candidate young stars in this area are detected by Gaia DR2, with typical distances of pc. These stars may be biased to a distributed population of young stars in the foreground of the dark cloud.
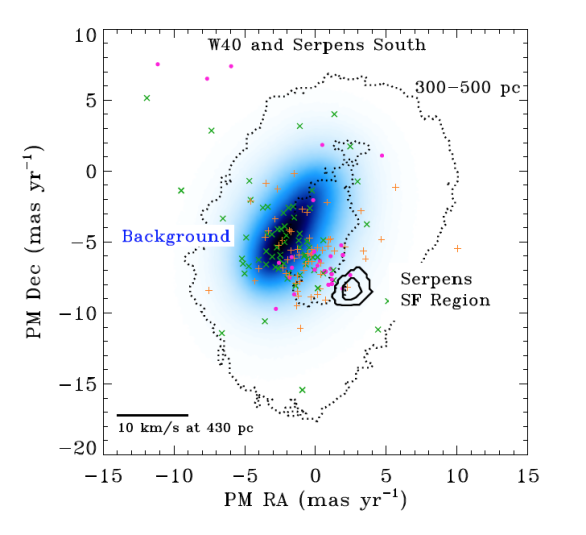
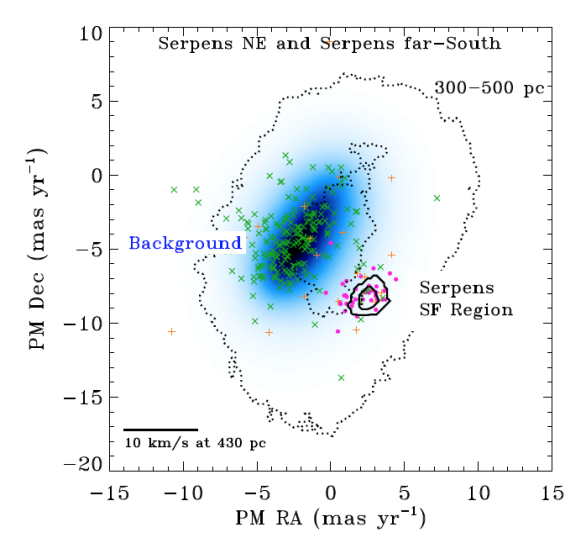
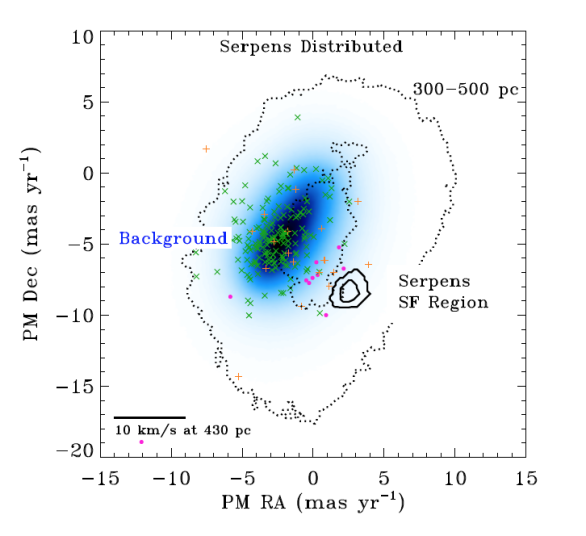
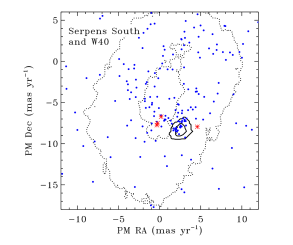
Objects in Povich et al. (2013) and Dunham et al. (2015) with spatial locations and parallaxes consistent with Serpens membership have proper motions that are offset from the Serpens centroid by mas, or 5 km s-1 (see Figure 9). Three of the four stars W40 and Serpens South with VLBI astrometry also have proper motions consistent with this offset in proper motion. In contrast, Figure 13 shows that a cluster of stars (brighter than ) have proper motions consistent with the wider Serpens region. No other overdensity is detected at the visual location of Serpens South and W40 (for stars with the offset proper motion) or in proper motion (for stars located in W40 and Serpens South).
One interpretation is that Serpens South and W40 have projected velocities on the sky that are offset by 5 km s-1 from the other clusters within Serpens. Most of the candidate members from the Povich et al. 2013 and Dunham et al. (2015) catalogs are optically faint ( and are excluded our broader overview. The candidate members with proper motions consistent with the larger Serpens complex would then be distributed members, located in the foreground of the dark cloud rather than within the active star-forming clouds. An alternate explanation is that the candidate members with offset proper motions in Figure 9 are field stars, since they overlap with the distribution of proper motions for stars from 300–500 pc over the full downloaded area. The offset of km s-1 on the sky is larger than expected based on the similarity of line-of-sight velocities to cold gas in the W40 and Serpens South molecular clouds (Nakamura et al., 2011; Shimoikura et al., 2015), compared to the velocities of Serpens Main and Serpens far-South (Dame & Thaddeus, 1985; Davis et al., 1999). However, some expansion is seen in the gas in W40, related to the H II bubble (Zhu et al., 2006; Pirogov et al., 2013; Shimoikura et al., 2015), and may contribute to a larger dispersion in proper motions for newly-formed stars. The proper motions of the faintest objects may also suffer from larger systematic errors than expected. Distinguishing between these explanations will require spectroscopy of candidate members to evaluate youth.
5.3.3 Serpens Northeast
The stellar population of Serpens Northeast is located at 478 pc, consistent with the dust extinction distance of pc. This subcluster is the most distance cluster of young stars within the Serpens star-forming cloud complex, as defined in this paper. Much of the optically-thick dust in the Aquila Rift is also located to the north and east of Serpens Main. This distance may indicate some connection between Serpens Star-Forming Regions and the Aquila Rift, since the clouds in the Aquila Rift nearby to Serpens Northeast are located at pc. Serpens Northeast includes some stars deg (16 pc) northeast of the main optical cluster, located along the direction of the Aquila Rift dust cloud.
The optical appearance of Serpens West is visually split into two by an optically-thick dust cloud, like a dust sandwich with the optically-bright stars around the dust. Some protostars and disks are present within the cloud (Dunham et al., 2015). The location of stars on the color-magnitude diagram as well as the (candidate) protostar/disk ratio, which suggests that Serpens Northeast is older than Serpens Main but younger than Serpens far-South. The populations north and south of the cloud are indistinguishable in distance.
The projected morphology of Serpens Northeast, with an optically-bright population around the dust, may be explained if the stars were either formed in a centralized factory and flung outward, or if the stars were born near their current location and have been eroding the nearby cloud. The stars in the northern half of the sandwich have proper motions of mas/yr, relative to the proper motions of southern stars (Table 4). However, if both populations had formed at the same spatial location, they would have had to have been flung out Myr ago, older than the age estimated from the color-magnitude diagram. Even more challenging, the standard deviation in the proper motions is mas/yr, so many of the stars in the north are traveling south, and vice versa, at a velocity consistent with the velocity dispersion measured for protostars (e.g. Kirk et al., 2010; Heiderman & Evans, 2015). Populations to the east and west also do not correspond to a past origin in some centralized location within the present-day cloud.
Some of these stars have either come from the opposite direction of the current location of the dark cloud, or their proper motions have already been altered by internal dynamics within the small cluster. The optically-bright stars have likely formed out of what is now an eroded cloud, while a few protostars are still forming where the cloud is still optically-thick. This erosion does not conflict with the possibility that stars are also being flung out from the birth filament at the lower velocities that have been observed in the Orion Nebula (Mairs et al., 2016; Stutz & Gould, 2016).
| N | RA Range | Dec Range | PM(RA) | PM(Dec) | ||||
| 21 | 279.2 to 279.6 | -0.6 to -0.1 | 2.69 | 0.35 | -8.18 | 0.40 | 472 | 15 |
| 30 | 279.2 to 279.6 | 0.2 to 0.8 | 2.51 | 0.38 | -8.05 | 0.39 | 489 | 20 |
| 20 | 279.65 to 280.1 | 0.0 to 1.0 | 2.42 | 0.40 | -8.21 | 0.31 | 484 | 19 |
| 12 | 278.8 to 279.2 | 0.0 to 1.0 | 2.93 | 0.38 | -8.03 | 0.81 | 482 | 21 |
| aFor stars with , from 440–530 pc, and within 1.7 mas/yr of the proper motion centroid. | ||||||||

5.3.4 Serpens far-South
This cluster pokes out of the extreme southern end of the dark cloud, directly south of the Serpens Main and Serpens South clusters. The optical cluster is located southeast of the optically-thick dust in Serpens far-South, where some protostars are present (Rumble et al., 2015). This region is not well studied. The Spitzer observations of Serpens (e.g. Dunham et al., 2015) were defined by the dust maps and therefore missed the optical counterparts. Sh 2-62, powered by the Herbig Be star MWC 297, is located on the eastern end of the cluster. The H II region Sh 2-61, powered by the Herbig Be star HBC 284, is projected on the southwest edge of the cluster but has Gaia astrometry consistent with a background object. Many of candidate young stars in the Dunham et al. (2015) catalog are found to be non-members. Based on the color-magnitude diagrams, this region is the oldest of the active star-forming complexes in Serpens.
An overdensity of stars extends 2.8 deg (19 pc) to the southwest of the main optical cluster, ending in a group of stars located at deg, to deg. The proper motion of this small group of PM(RA)=1.7 mas/yr and PM(Dec)= mas/yr is offset by 0.7 mas/yr from the main cluster, so this may be a distinct group from Serpens far-South. The location of these stars on the color-magnitude diagram indicate a similar age as the Serpens far-South cluster.
5.3.5 LDN 673
This dark cloud is located pc from the main Serpens star-forming regions. The cloud has formed members bright enough to be identified with Gaia, with a mean distance of 407 pc and a mean proper motion similar to that of Serpens (see also identification of this group by Rice et al., 2006). The members of this sub-cluster, including AS 353A (with the associated HH object HH 32 discovered by Mundt et al. 1983) and V536 Aql, have similar colors and distance-corrected brightness as those in other Serpens regions.
5.3.6 FG Aql Group
We identify 5 stars, called here the FG Aql Group, with distances of pc and proper motions consistent with Serpens. On the sky, this small group is located pc southeast of the ongoing star formation. This small group of stars is identified here only because Prato et al. (2008) listed them as possible young stars, following past identification and incorporation into the Herbig & Bell (1988) catalog111111Candidate members HBC 684 and FG Aql/G3 have astrometry consistent with background objects and are likely non-members, as do several other candidate young stars in this region that are listed the Herbig & Bell (1988) catalogue.. This group would have been detected with an analysis that combined a nearest neighbor criterion and photometry.
5.4. The Star Formation History of the Serpens Molecular Cloud
Within the Serpens cloud complex, about 60% of the optically-bright stars are located within one of the three main (optical) clusters. These past bursts of star formation, and the ongoing burst in Serpens South, are concentrated in specific spatial locations. Some additional star formation has also occurred beyond this projected region, including in LDN 673 and the FG Aql Group.
The population found by the Gaia astrometric selection is likely older than the members that are located deep in the molecular cloud. An age gradient is present within the full Serpens star-forming region, with Serpens South as the youngest sub-cluster and Serpens far-South as the oldest. An age gradient is also present within each sub-cluster. In Serpens Northeast and Serpens far-South sub-clusters, the protostellar population found by Dunham et al. (2015); Rumble et al. (2015) is still located within the cloud, while the optical population is likely older. Such age gradients are widely observed on other star-forming regions (e.g. Mairs et al., 2016; Getman et al., 2018).
The age gradients may be caused by cluster dynamics or a by change in the site of active star formation. In the hierarchical star formation scenario of Vázquez-Semadeni et al. (2018), an age gradient is expected, but is most apparent for Myr old stars, because given a scatter in initial velocities, the older stars have longer time to disperse. However, the standard deviation in proper motions of mas/yr ( km s-1) within each subclusters is inconsistent with a dynamical explanation for an age gradient; neither are the optically-bright stars the ones that happened to be flung out. Instead, feedback from these stars (e.g. Cunningham et al., 2018) has likely eroded away the nearby molecular material over several Myr.
A cluster located at 430 pc with a velocity dispersion of km s-1, with no internal dynamics, would expand by deg every 10 Myr. Over Myr, any clustered star formation would likely remain in a cluster and would likely not move far from the birth site, unless the velocity dispersion were significantly larger than those observed here. Two older clusters, Collinder 359 and IC 4665, were found here with Gaia DR2 astrometry (see also Cantat-Gaudin et al., 2018a) and may be related to a burst of star formation tens of Myr ago. Collinder 359, located at a distance of 551 pc, is visually separated by 85 pc on the sky from the northern clusters of Serpens. Given the relative proper motions (Cantat-Gaudin et al., 2018a), the cluster would have overlapped with Serpens Northeast (in projected space) 16 Myr ago, which is likely younger than the cluster age, estimated to be Myr by Lodieu et al. (2006). IC 4665, located at 350 pc, is a less promising candidate. The cluster, located at a distance of pc, has a proper motion that would have also placed it visually northeast of the Serpens clouds 13 Myr ago, much younger than the estimated age of 40 Myr by (Dias et al., 2002). Any visual association between IC 4665 and Serpens is likely coincidental, while the relationship between Collinder 359 and Serpens is unclear.
The lack of clusters and young stars beyond this immediate region indicate that the star formation in Serpens is a recent burst. Because our selection of Serpens members is independent of any photometric criterion (other than sufficient brightness for accurate astrometry in Gaia DR2), we would have detected any significant star formation that occurred in the recent past. Even if the distributed young stars are entirely from a previous epoch, the star formation rate over the past 50 Myr must have been at least times lower than the current rate. Thus it seems likely that the recent bursts of star formation are the first generation of stars in this cloud complex. The possibility that a small burst 30-60 Myr ago in Serpens could have created Collinder 359 would reinforce that the star formation is very bursty.
The current epoch of star formation began within a few Myr of each other in regions that are separated by distances of 20–100 pc. The typical sound speed in a molecular cloud of km s-1 leads to a crossing time of 100–500 Myr (see, e.g., discussion of Upper Sco in Preibisch & Zinnecker, 1999; Slesnick et al., 2008); a shock would therefore need to travel at – km s-1 to connect these distant regions on a Myr timescale. The large separations between these groups is one of the more difficult-to-explain aspects of star-formation in this region. This situation is not unique to the Serpens-Aquila region, as many massive star-forming regions contain several discrete clusters of stars separated by tens of parsecs (Kuhn et al., 2014). A prominent example is the NGC 6357 star-forming region, which contains three Orion-like clusters separated by 10–15 pc (Townsley et al., 2014). NGC 6357 itself is separated from the star-forming region NGC 6334 in the same giant-molecular cloud complex by a projected distance of 60 pc. On the other hand, the Orion Nebula Cluster and the broader Orion Region have undergone several distinct epochs of star formation (e.g. Beccari et al., 2017; Kounkel et al., 2018). This puzzle for Serpens is exacerbated, or at least now better established, by the lack of young stars from previous epochs of star formation, as would be seen over a very large area on the sky.
Several mechanisms could potentially induce near-simultaneous star-formation at different locations in molecular clouds. For example, gravitational instabilities in a long, filamentary cloud can produce regularly spaced regions of star formation activity (Gehman et al., 1996). Alternatively, the assembly of giant molecular clouds through a series of cloud-cloud collisions (e.g., Ibáñez-Mejía et al., 2017) could produce multiple sites of star formation. In both Serpens Main and W40/Serpens South, kinematic studies of clouds suggest a history of cloud-cloud collisions (Duarte-Cabral et al., 2010; Nakamura et al., 2017; Shimoikura et al., 2018). However, while cloud-cloud collisions may be the local trigger for a burst, it is hard to imagine any sort of cloud-cloud collision could occur at specific sites spread over such large distances, without any star-forming collisions in the recent past elsewhere along the clouds.
In principle, compression from a shockwave from a supernova or winds from hot stars could have triggered star formation in all three regions of the molecular cloud. However, there are no indicators that a nearby supernova has occured. The 40 Myr old cluster IC 4665 (Dias et al., 2002) and Collinder 359 may have had a sufficient number of hot stars for winds to sweep up some gas, thereby precipitating local cloud-cloud collisions across a wide region on a timescale consistent with requirements on the travel time for a shock, though this explanation seems overly ad hoc. In any case, given the large available gas resevoir in the Serpens-Aquila region (Zeilik & Lada, 1978; André et al., 2010) and the extreme youth of the stellar population of the region, it is likely that the region is still in the early stages of its star formation history, the star formation rate is accelerating, and the observed stars are just the first to form.
6. Conclusions and Prospects for the Future
We have performed an initial evaluation of the Serpens star-forming complexes and the Aquila Rift using Gaia DR2 astrometry. The optically-bright young stars are concentrated in three clusters in the Serpens star-forming region, with distances from 383–478 pc and relative velocities between the clusters of km s-1. Some young stars are distributed throughout the region and may have formed in smaller groups. The distances to optically-thick dust extinction of these regions are consistent with the distance to the stellar populations. While Serpens members are identified using only astrometry, the Gaia photometry establishes that a tight selection in proper motion and distance generates a robust sample of young stars. The populations identified here are older and more widely distributed than had been known previously, complementing past mid-IR surveys that had identified populations within the dark molecular clouds that are not detectable with Gaia.
Some dust is present in the Serpens Cirrus, located to the southwest of the Serpens star-forming regions, has a distance of pc, consistent with past distance measurements to dust extinction in this region by (Straižys et al., 2003). The Serpens Cirrus dust is not very opaque ( mag when averaged over a large region) and is not associated with significant star formation, although the protostar L483-mm and perhaps a few other young objects are forming in this area. The dust in the Aquila Rift is located at pc to the northeast and at pc to the southwest of Serpens. Since the distance of the Aquila Rift tends to increase smoothly from the southwest to the northeast, the Aquila Rift may be one huge complex that includes Serpens star-forming regions. While it might seem surprising for the cloud to extend 300 pc along our line-of-sight, the Aquila Rift spans at least 250 pc across our full field of view, when projected on the sky.
The active star formation in Serpens over the past few Myr has occured across a distance of pc, in distinct sites that are typically pc across. The absence of an older population indicates that little star formation occurred prior to this current activity. This strongly suggests some sort of external trigger traveling at 20-100 km s-1 to generate the star formation. If the ages are older than inferred here, then the speed of the trigger could be reduced but would not alter the general picture.
In Serpens Northeast, several protostars are located within the optically thick cloud, while optically bright stars are located north and south of the cloud, like a dust sandwich. The proper motions of these optically-bright stars indicates that they were likely formed near their present locations and have eroded way their parent molecular cloud. Their positions and proper motions are inconsistent with having been formed in a central star formation factory and then flung out to their current location.
This evaluation should be treated as an initial analysis of the Gaia view of the Serpens-Aquila region. Future data releases will improve astrometric precision for optically fainter sources, which will allow us to increase sample sizes and thereby better probe the low-mass and embedded populations. The analysis of line-of-sight dust extinction should improve by adding multiple regions of dust and by incorporating the brightness and colors of objects, rather than just star counts. A full census of the population should assign membership probabilities to each star. Analyses of individual stars would improve age and mass estimates.
Despite these caveats to our work, we are still able to identify a new, optically bright population in Serpens that was not previously known, as well as resolve nagging doubts about the distances to W40/Serpens South and other regions in the Aquila Rift and Serpens Cirrus. This work was performed almost exclusively with Gaia data.
7. Acknowledgements
We request that any citation to this paper also cite the primary papers that describe Gaia DR2 data, because our own work is at best a minimal intellectual contribution to understanding this region with Gaia.
We thank the anonymous referee for clear, careful, and thoughtful comments, which have improved the quality of the paper. GJH and MK thank Lynne Hillenbrand for discussions about Gaia and on the draft, including detailed suggestions on figures and captions. GJH also thanks Kaitlin Kratter for a discussion of star formation theory, Logan Francis for an initial discussion of extinction maps in comparison to Gaia star count maps, Neal Evans for a discussion of L483, and Martin Smith for many discussions about Gaia.
This work has made use of data from the European Space Agency (ESA) mission Gaia (https://www.cosmos.esa.int/gaia), processed by the Gaia Data Processing and Analysis Consortium (DPAC, https://www.cosmos.esa.int/web/gaia/dpac/consortium). Funding for the DPAC has been provided by national institutions, in particular the institutions participating in the Gaia Multilateral Agreement. This research has made use of the Spanish Virtual Observatory (http://svo.cab.inta-csic.es) supported from the Spanish MINECO/FEDER through grant AyA2014-55216
GJH is supported by general grants 11773002 and 11473005 awarded by the National Science Foundation of China. CFM is supported by an ESO Fellowship. DJ is supported by the National Research Council Canada and by an NSERC Discovery Grant. AB acknowledges the research grant awarded by the National Natural Science Foundation of China through a Research Fund for International Young Scientists and China post-doctoral General grant.
| T (K) | |||||||
|---|---|---|---|---|---|---|---|
| 2600 | |||||||
| 2800 | |||||||
| 3000 | |||||||
| 3200 | |||||||
| 3400 | |||||||
| 3600 | |||||||
| 3800 | |||||||
| 4000 | |||||||
| 4200 | |||||||
| 4400 | |||||||
| 4500 | |||||||
| 5000 | |||||||
| 5500 | |||||||
| 6000 | |||||||
| 6500 | |||||||
| 7000 | |||||||
| 8000 | |||||||
| 9000 | |||||||
| 10000 | |||||||
| 25000 | |||||||
| 33000 | |||||||
| 41000 | |||||||
| 49000 | |||||||
| 57000 | |||||||
| 65000 | |||||||
| Calculated from synthetic spectra, as described in Appendix A. | |||||||
8. Appendix A: Extinction Vectors for Gaia photometry
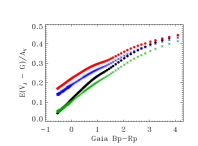
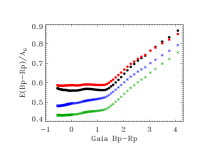
The Gaia photometric bands are broad enough to introduce large differences in the color change caused by extinction as a function of the instrinsic stellar color. We calculate extinction vectors by applying extinction curves of Fitzpatrick (1999) to synthetic stellar spectra from the Phoenix/NEXTGEN grid (BT-Settl version from Allard et al. 2012 with solar abundances from Anders & Grevesse 1989 and ), and subsequently convolving the reddened spectrum in photon units with the filter transmission curve. Filter curves for Gaia DR2 and the spectral templates were obtained from the Spanish Virtual Observatory.
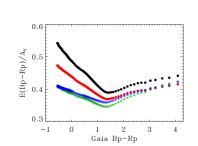
Figure 15 shows the change in Gaia , , and magnitudes for extinctions of and mag and total-to-selective extinction coefficients of =3.1 (adopted in this paper) and 5.5 (see also Table 5). The change in versus is less for redder stars because most of the -band photons are red and suffer less from extinction. The change in shows a sharp increases versus extinction for stars cooler than , because the -band photons also dominate the -band photometry. The / curve varies much less (within 0.1 mag) for stars with intrinsic colors between between and . For low-mass pre-main sequence stars, the effect of extinction on versus is nearly parallel to isochrones, as is also the case with versus (e.g. Sicilia-Aguilar et al., 2005).
9. Appendix B: The distance and extinction to a sheet of dust

In this appendix, we describe our code to measure the distance to dust extinction. Dark clouds extinguish emission from background stars, thereby making them fainter and redder. We assume that the cloud is a thin sheet of dust at a single distance, and subsequently simulate stellar populations to estimate the distance and extinction of the sheet. This idea is similar to distance measurements to dark clouds using Gaia DR2 by Yan et al. (2019) and Zucker et al. (2019), Gaia DR1 by Voirin et al. (2018), and Hipparcos by Whittet et al. (1997), among others, with differences in implementation.
Each simulation includes 500,000 stars that are randomly selected from a parent (or off-cloud) population. If a star is in front of the dust, then the measured stellar parallax, parallax error, and brightness are adopted. If a star is behind the dust, then the Gaia -band photometry is made fainter by . A new parallax error for this fainter star is adopted by randomly selecting the parallax error for the -band photometry, based on the distribution of parallax errors in our full dataset (Figure 16). All parallaxes, for stars in front of and behind the cloud121212Stars with negative parallaxes in the parent sample are assumed to have a parallax equal to 0 mas. This choice does not affect our final results, since the clouds are located within 1 kpc., are then adjusted by adding the parallax error multipled by a number randomly selected from a Gaussian distribution.
The parent population is the population that would be present along the line of sight, if extinction were not present. Within the region downloaded for this paper, 28 million stars have and are located in regions that are not heavily extincted. The stellar density depends on the distance from the galactic plane. More stars are located south of the plane, likely because of modest extinction along and just north of the plane. Simulations are therefore run for three different parent populations: stars with the same galactic latitude, stars with the opposite galactic latitude, and stars within some annulus around the region.
The simulated distribution is then compared to the observed distribution of stars in the line of sight using a two-sided Kolmogorov-Smirnov test. The distribution is scaled to the number of observed stars. Since the clouds in the Serpens Star-Forming Region are located at pc, the comparison is restricted to stars with distances (or simulated distances) less than 1000 pc that are measured (or simulated to be measured) to better than 5% and are brighter (or simulated to be brighter) than mag. Separate simulations are run for sources with parallaxes measured to better than 20%. The comparison avoids stars with proper motions within 2 mas/yr of the Serpens clusters. Sources with excess astrometric noise of greater than 2 mas are excluded from the parent sample.
Figure 18 shows results for six different regions. In the simulations, the dropoff in stars versus distance is somewhat gradual, with a cloud distance that is roughly in the center of the dropoff. The width of this dropoff increases as the average of a sample decreases. Even for optically thick clouds, the dropoff can occur at distances closer than expected: stars that are closer than the cloud have errors that can make them appear at larger distances, but there are no stars at larger distances that may appear closer than the cloud. Clouds are often patchy, with a range of extinctions; multiple clouds within some region may also be spread across a range of distances. Moreover, the use of samples with ( and produce different extinctions because they are sensitive to different types of stars. The extinctions measured here are therefore not reliable. Distances obtained from different samples and parallax care always consistent.
This simulation assumes that the errors are accurately evaluated. The parallax error is assumed to be independent of object distance and object color. The excess astrometric noise is also assumed to be independent of distance and color. The parent distribution of Gaia sources is assumed to be independent of crowding. The comparison between the simulated and observed distribution is restricted to the distribution of distances in the two samples, so the total number of stars is essentially scaled to match. In principle, this method could be adapted to also test the total stellar population and additional parameters, such as the distribution of brightnesses and colors.
These calculations assume that the extinction occurs in a sheet located at a single distance and with a single extinction. However, molecular clouds are clumpy and may be distributed over some distance. For instance, the Serpens Main cloud extends deg, or 7 pc, from south to north, and likely has a similar radial distance. Multiple clouds may be located along the same line of sight, or different lines of sight but within the large beam.

10. Appendix C: A Description of the Online Source List
In an online electronic catalog (see Table 7), we provide a list of all possible Serpens members within 7∘ of (), within 3 mas/yr of a proper motion of () mas/yr, located at a distance of 320–550 pc, with and with an excess astrometric noise of mas. Beyond the 7∘ radius, the table also includes several objects near LDN 673, including AS 353A, and the FG Aql group.
The table identifies the highly-likely members by listing the region membership, the same target that are selected for the HR diagrams in Figure 11. Similarly, the likely members of the distributed Serpens star-formation are listed as “Distributed”. The full online table is liberal in including many non-members, identified by membership listed as “N/A”.
The table also includes nearest neighbor calculations as a way of identifying likely members and small, isolated groups of stars. For this calculation, a parent dataset is established of all stars between 350–520 pc with and within 3 mas/yr of the Serpens proper motion centroid. For each star in the full sample, we then calculate the 7th nearest spatial neighbor within the parent dataset. For each star, we also calculate the 7th nearest proper motion neighbor for stars within a radius within the parent dataset. The Serpens members especially stand out as having low 7th nearest neighbors, with typical distances of compared to an average distance of for field stars. Most members also have 7th nearest neighbor in proper motion of mas/yr, while field stars have an average of value of 1.3 mas/yr. This nearest neighbor analysis alone would produce modest contamination rates, especially away from the main region. A nearest neighbor criterion combined with a photometric selection would have readily identified the LDN 673 group and the FG Aql group as likely members, along with the far soutwest extent of Serpens far-South. In addition, the two stars 2MASS J18435376+0320524 and 2MASS J18430797+0321056 are likely Serpens members and may form a small group.
References
- Allard (2014) Allard, F. 2014, in IAU Symposium, Vol. 299, Exploring the Formation and Evolution of Planetary Systems, ed. M. Booth, B. C. Matthews, & J. R. Graham, 271–272
- Allard et al. (2012) Allard, F., Homeier, D., & Freytag, B. 2012, Philosophical Transactions of the Royal Society of London Series A, 370, 2765
- Anders & Grevesse (1989) Anders, E., & Grevesse, N. 1989, Geochim. Cosmochim. Acta, 53, 197
- André et al. (2010) André, P., Men’shchikov, A., Bontemps, S., et al. 2010, A&A, 518, L102
- Arenou et al. (2018) Arenou, F., Luri, X., Babusiaux, C., et al. 2018, A&A, 616, A17
- Beccari et al. (2018) Beccari, G., Boffin, H. M. J., Jerabkova, T., et al. 2018, MNRAS, 481, L11
- Beccari et al. (2017) Beccari, G., Petr-Gotzens, M. G., Boffin, H. M. J., et al. 2017, A&A, 604, A22
- Blaauw (1956) Blaauw, A. 1956, ApJ, 123, 408
- Bontemps et al. (2010) Bontemps, S., André, P., Könyves, V., et al. 2010, A&A, 518, L85
- Bressan et al. (2012) Bressan, A., Marigo, P., Girardi, L., et al. 2012, MNRAS, 427, 127
- Cambrésy (1999) Cambrésy, L. 1999, A&A, 345, 965
- Cantat-Gaudin et al. (2018a) Cantat-Gaudin, T., Jordi, C., Vallenari, A., et al. 2018a, A&A, 618, A93
- Cantat-Gaudin et al. (2018b) Cantat-Gaudin, T., Jordi, C., Wright, N. J., et al. 2018b, arXiv e-prints, arXiv:1812.08114
- Capitanio et al. (2017) Capitanio, L., Lallement, R., Vergely, J. L., Elyajouri, M., & Monreal-Ibero, A. 2017, A&A, 606, A65
- Cunningham et al. (2018) Cunningham, A. J., Krumholz, M. R., McKee, C. F., & Klein, R. I. 2018, MNRAS, 476, 771
- Cutri et al. (2003) Cutri, R. M., Skrutskie, M. F., van Dyk, S., et al. 2003, 2MASS All Sky Catalog of point sources.
- Dame et al. (2001) Dame, T. M., Hartmann, D., & Thaddeus, P. 2001, ApJ, 547, 792
- Dame & Thaddeus (1985) Dame, T. M., & Thaddeus, P. 1985, ApJ, 297, 751
- Damiani et al. (2018) Damiani, F., Prisinzano, L., Pillitteri, I., Micela, G., & Sciortino, S. 2018, ArXiv e-prints, arXiv:1807.11884
- Davis et al. (1999) Davis, C. J., Matthews, H. E., Ray, T. P., Dent, W. R. F., & Richer, J. S. 1999, MNRAS, 309, 141
- de Zeeuw et al. (1999) de Zeeuw, P. T., Hoogerwerf, R., de Bruijne, J. H. J., Brown, A. G. A., & Blaauw, A. 1999, AJ, 117, 354
- Dias et al. (2002) Dias, W. S., Alessi, B. S., Moitinho, A., & Lépine, J. R. D. 2002, A&A, 389, 871
- Dobashi (2011) Dobashi, K. 2011, Publications of the Astronomical Society of Japan, 63, S1
- Duarte-Cabral et al. (2010) Duarte-Cabral, A., Fuller, G. A., Peretto, N., et al. 2010, A&A, 519, A27
- Dunham et al. (2015) Dunham, M. M., Allen, L. E., Evans, II, N. J., et al. 2015, ApJS, 220, 11
- Dzib et al. (2018) Dzib, S. A., Loinard, L., Ortiz-León, G. N., Rodríguez, L. F., & Galli, P. A. B. 2018, ArXiv e-prints, arXiv:1810.01917
- Eiroa & Casali (1992) Eiroa, C., & Casali, M. M. 1992, A&A, 262, 468
- Eiroa et al. (2008) Eiroa, C., Djupvik, A. A., & Casali, M. M. 2008, The Serpens Molecular Cloud, ed. B. Reipurth, 693
- Erickson et al. (2015) Erickson, K. L., Wilking, B. A., Meyer, M. R., et al. 2015, AJ, 149, 103
- Evans et al. (2018) Evans, D. W., Riello, M., De Angeli, F., et al. 2018, A&A, 616, A4
- Fang et al. (2013) Fang, M., van Boekel, R., Bouwman, J., et al. 2013, A&A, 549, A15
- Fang et al. (2018) Fang, M., Pascucci, I., Edwards, S., et al. 2018, ArXiv e-prints, arXiv:1810.03366
- Fitzpatrick (1999) Fitzpatrick, E. L. 1999, PASP, 111, 63
- Gaia Collaboration et al. (2016) Gaia Collaboration, Prusti, T., de Bruijne, J. H. J., et al. 2016, A&A, 595, A1
- Gaia Collaboration et al. (2018) Gaia Collaboration, Brown, A. G. A., Vallenari, A., et al. 2018, A&A, 616, A1
- Gehman et al. (1996) Gehman, C. S., Adams, F. C., & Watkins, R. 1996, ApJ, 472, 673
- Getman et al. (2017) Getman, K. V., Broos, P. S., Kuhn, M. A., et al. 2017, ApJS, 229, 28
- Getman et al. (2014) Getman, K. V., Feigelson, E. D., & Kuhn, M. A. 2014, ApJ, 787, 109
- Getman et al. (2018) Getman, K. V., Feigelson, E. D., Kuhn, M. A., et al. 2018, MNRAS, 476, 1213
- Giardino et al. (2007) Giardino, G., Favata, F., Micela, G., Sciortino, S., & Winston, E. 2007, A&A, 463, 275
- Gorlova et al. (2010) Gorlova, N., Steinhauer, A., & Lada, E. 2010, ApJ, 716, 634
- Green et al. (2015) Green, G. M., Schlafly, E. F., Finkbeiner, D. P., et al. 2015, ApJ, 810, 25
- Green et al. (2018) Green, G. M., Schlafly, E. F., Finkbeiner, D., et al. 2018, MNRAS, 478, 651
- Gutermuth et al. (2008) Gutermuth, R. A., Bourke, T. L., Allen, L. E., et al. 2008, ApJ, 673, L151
- Haisch et al. (2001) Haisch, Jr., K. E., Lada, E. A., & Lada, C. J. 2001, ApJ, 553, L153
- Heiderman & Evans (2015) Heiderman, A., & Evans, II, N. J. 2015, ApJ, 806, 231
- Herbig & Bell (1988) Herbig, G. H., & Bell, K. R. 1988, Third Catalog of Emission-Line Stars of the Orion Population : 3 : 1988
- Hernández et al. (2008) Hernández, J., Hartmann, L., Calvet, N., et al. 2008, ApJ, 686, 1195
- Ibáñez-Mejía et al. (2017) Ibáñez-Mejía, J. C., Mac Low, M.-M., Klessen, R. S., & Baczynski, C. 2017, ApJ, 850, 62
- Jose et al. (2016) Jose, J., Kim, J. S., Herczeg, G. J., et al. 2016, ApJ, 822, 49
- Kirk et al. (2010) Kirk, H., Pineda, J. E., Johnstone, D., & Goodman, A. 2010, ApJ, 723, 457
- Könyves et al. (2015) Könyves, V., André, P., Men’shchikov, A., et al. 2015, A&A, 584, A91
- Kounkel et al. (2018) Kounkel, M., Covey, K., Suárez, G., et al. 2018, AJ, 156, 84
- Kuhn et al. (2010) Kuhn, M. A., Getman, K. V., Feigelson, E. D., et al. 2010, ApJ, 725, 2485
- Kuhn et al. (2018) Kuhn, M. A., Hillenbrand, L. A., Sills, A., Feigelson, E. D., & Getman, K. V. 2018, ArXiv e-prints, arXiv:1807.02115
- Kuhn et al. (2013) Kuhn, M. A., Povich, M. S., Luhman, K. L., et al. 2013, ApJS, 209, 29
- Kuhn et al. (2014) Kuhn, M. A., Feigelson, E. D., Getman, K. V., et al. 2014, ApJ, 787, 107
- Lallement et al. (2014) Lallement, R., Vergely, J.-L., Valette, B., et al. 2014, A&A, 561, A91
- Leung & Bovy (2019) Leung, H. W., & Bovy, J. 2019, arXiv e-prints, arXiv:1902.08634
- Lindegren et al. (2018) Lindegren, L., Hernández, J., Bombrun, A., et al. 2018, A&A, 616, A2
- Lodieu et al. (2006) Lodieu, N., Bouvier, J., James, D. J., et al. 2006, A&A, 450, 147
- Luhman (2018) Luhman, K. L. 2018, AJ, 156, 271
- Luri et al. (2018) Luri, X., Brown, A. G. A., Sarro, L. M., et al. 2018, A&A, 616, A9
- Lynds (1962) Lynds, B. T. 1962, ApJS, 7, 1
- Mairs et al. (2016) Mairs, S., Johnstone, D., Kirk, H., et al. 2016, MNRAS, 461, 4022
- Mallick et al. (2013) Mallick, K. K., Kumar, M. S. N., Ojha, D. K., et al. 2013, ApJ, 779, 113
- Mamajek (2009) Mamajek, E. E. 2009, in American Institute of Physics Conference Series, Vol. 1158, American Institute of Physics Conference Series, ed. T. Usuda, M. Tamura, & M. Ishii, 3–10
- Manara et al. (2018) Manara, C. F., Prusti, T., Comeron, F., et al. 2018, A&A, 615, L1
- Marigo et al. (2017) Marigo, P., Girardi, L., Bressan, A., et al. 2017, ApJ, 835, 77
- Meyer et al. (1997) Meyer, M. R., Calvet, N., & Hillenbrand, L. A. 1997, AJ, 114, 288
- Mundt et al. (1983) Mundt, R., Stocke, J., & Stockman, H. S. 1983, ApJ, 265, L71
- Nakamura et al. (2017) Nakamura, F., Dobashi, K., Shimoikura, T., Tanaka, T., & Onishi, T. 2017, ApJ, 837, 154
- Nakamura et al. (2011) Nakamura, F., Sugitani, K., Shimajiri, Y., et al. 2011, ApJ, 737, 56
- Ortiz-León et al. (2017) Ortiz-León, G. N., Dzib, S. A., Kounkel, M. A., et al. 2017, ApJ, 834, 143
- Ortiz-León et al. (2018) Ortiz-León, G. N., Loinard, L., Dzib, S. A., et al. 2018, arXiv e-prints, arXiv:1812.02360
- Pirogov et al. (2013) Pirogov, L., Ojha, D. K., Thomasson, M., Wu, Y.-F., & Zinchenko, I. 2013, MNRAS, 436, 3186
- Povich et al. (2013) Povich, M. S., Kuhn, M. A., Getman, K. V., et al. 2013, ApJS, 209, 31
- Prato et al. (2008) Prato, L., Rice, E. L., & Dame, T. M. 2008, Where are all the Young Stars in Aquila?, ed. B. Reipurth, 18
- Preibisch & Zinnecker (1999) Preibisch, T., & Zinnecker, H. 1999, AJ, 117, 2381
- Racine (1968) Racine, R. 1968, AJ, 73, 233
- Rice et al. (2006) Rice, E. L., Prato, L., & McLean, I. S. 2006, ApJ, 647, 432
- Richert et al. (2018) Richert, A. J. W., Getman, K. V., Feigelson, E. D., et al. 2018, MNRAS, 477, 5191
- Roccatagliata et al. (2018) Roccatagliata, V., Sacco, G. G., Franciosini, E., & Randich, S. 2018, A&A, 617, L4
- Rodney & Reipurth (2008) Rodney, S. A., & Reipurth, B. 2008, The W40 Cloud Complex, ed. B. Reipurth, 683
- Rumble et al. (2015) Rumble, D., Hatchell, J., Gutermuth, R. A., et al. 2015, MNRAS, 448, 1551
- Sharpless (1959) Sharpless, S. 1959, ApJS, 4, 257
- Shimoikura et al. (2015) Shimoikura, T., Dobashi, K., Nakamura, F., et al. 2015, ApJ, 806, 201
- Shimoikura et al. (2018) Shimoikura, T., Dobashi, K., Nakamura, F., Shimajiri, Y., & Sugitani, K. 2018, PASJ, arXiv:1809.09855
- Shuping et al. (2012) Shuping, R. Y., Vacca, W. D., Kassis, M., & Yu, K. C. 2012, AJ, 144, 116
- Sicilia-Aguilar et al. (2005) Sicilia-Aguilar, A., Hartmann, L. W., Hernández, J., Briceño, C., & Calvet, N. 2005, AJ, 130, 188
- Siess et al. (2000) Siess, L., Dufour, E., & Forestini, M. 2000, A&A, 358, 593
- Slesnick et al. (2008) Slesnick, C. L., Hillenbrand, L. A., & Carpenter, J. M. 2008, ApJ, 688, 377
- Smith et al. (1985) Smith, J., Bentley, A., Castelaz, M., et al. 1985, ApJ, 291, 571
- Soderblom et al. (2014) Soderblom, D. R., Hillenbrand, L. A., Jeffries, R. D., Mamajek, E. E., & Naylor, T. 2014, Protostars and Planets VI, 219
- Straižys et al. (1996) Straižys, V., Černis, K., & Bartašiūtė, S. 1996, Baltic Astronomy, 5, 125
- Straižys et al. (2003) —. 2003, A&A, 405, 585
- Strom et al. (1974) Strom, S. E., Grasdalen, G. L., & Strom, K. M. 1974, ApJ, 191, 111
- Stutz & Gould (2016) Stutz, A. M., & Gould, A. 2016, A&A, 590, A2
- Tafalla et al. (2000) Tafalla, M., Myers, P. C., Mardones, D., & Bachiller, R. 2000, A&A, 359, 967
- Townsley et al. (2014) Townsley, L. K., Broos, P. S., Garmire, G. P., et al. 2014, ApJS, 213, 1
- Vázquez-Semadeni et al. (2018) Vázquez-Semadeni, E., Zamora-Avilés, M., Galván-Madrid, R., & Forbrich, J. 2018, MNRAS, 479, 3254
- Voirin et al. (2018) Voirin, J., Manara, C. F., & Prusti, T. 2018, A&A, 610, A64
- Westerhout (1958) Westerhout, G. 1958, Bulletin of the Astronomical Institutes of the Netherlands, 14, 215
- Whittet et al. (1997) Whittet, D. C. B., Prusti, T., Franco, G. A. P., et al. 1997, A&A, 327, 1194
- Winston et al. (2018) Winston, E., Wolk, S. J., Gutermuth, R., & Bourke, T. L. 2018, AJ, 155, 241
- Winston et al. (2010) Winston, E., Megeath, S. T., Wolk, S. J., et al. 2010, AJ, 140, 266
- Yan et al. (2019) Yan, Q.-Z., Zhang, B., Xu, Y., et al. 2019, arXiv e-prints, arXiv:1902.02052
- Zari et al. (2018) Zari, E., Hashemi, H., Brown, A. G. A., Jardine, K., & de Zeeuw, P. T. 2018, ArXiv e-prints, arXiv:1810.09819
- Zeilik & Lada (1978) Zeilik, II, M., & Lada, C. J. 1978, ApJ, 222, 896
- Zhu et al. (2006) Zhu, L., Wu, Y.-F., & Wei, Y. 2006, Chinese J. Astron. Astrophys., 6, 61
- Zucker et al. (2019) Zucker, C., Speagle, J. S., Schlafly, E. F., et al. 2019, arXiv e-prints, arXiv:1902.01425
| Non-member | Likely member | |||||
| no | ||||||
| Catalog | Total | Matches | PM | PM, | PM | PM |
| Serpens Main | ||||||
| Total Serpens Main | 494 | 180 | 65 | 7 | 24 | 84 |
| Dunham Totalb | 227 | 104 | 20 | 5 | 16 | 63 |
| Class 0/I, Flat | 52 | 3 | 1 | 0 | 0 | 2 |
| Disks | 131 | 73 | 6 | 4 | 15 | 48 |
| Evolved | 39 | 28 | 13 | 1 | 1 | 13 |
| (Likely AGB) | 5 | 5 | 5 | 0 | 0 | 0 |
| Giardino et al. (2007) | 56 | 23 | 2 | 0 | 6 | 15 |
| Eiroa et al. (2008) | 253 | 74 | 33 | 2 | 14 | 25 |
| Winston et al. (2010) | 66 | 47 | 12 | 0 | 11 | 24 |
| Gorlova et al. (2010) | 19 | 3 | 0 | 0 | 1 | 2 |
| Erickson et al. (2015) | 63 | 54 | 17 | 1 | 1 | 35 |
| Getman et al. (2017) | 159 | 40 | 10 | 1 | 7 | 22 |
| Serpens South and W40c | ||||||
| Dunham Totalb | 725 | 153 | 126 | 5 | 18 | 4 |
| Protostars | 117 | 2 | 2 | 0 | 0 | 0 |
| Disks | 257 | 45 | 25 | 2 | 16 | 2 |
| Evolved | 351 | 106 | 99 | 3 | 2 | 2 |
| (Likely AGB) | 69 | 37 | 35 | 1 | 1 | 0 |
| Getman et al. (2017) | 645 | 18 | 12 | 0 | 4 | 2 |
| Winston et al. (2018) | 66 | 16 | 10 | 0 | 3 | 3 |
| Povich Disks+Protostars | 751 | 31 | 23 | 2 | 0 | 6 |
| Protostars | 281 | 5 | 2 | 2 | 0 | 1 |
| Disks | 470 | 26 | 21 | 0 | 0 | 5 |
| Uncertain | 244 | 8 | 6 | 0 | 0 | 2 |
| Serpens Northeastc | ||||||
| Dunham Totalb | 224 | 97 | 77 | 9 | 6 | 5 |
| Protostars | 16 | 3 | 2 | 1 | 0 | 0 |
| Disks | 36 | 14 | 3 | 5 | 3 | 3 |
| Evolved | 172 | 80 | 72 | 3 | 3 | 2 |
| (Likely AGB) | 41 | 32 | 32 | 0 | 0 | 0 |
| Serpens far-Southc | ||||||
| Dunham Totalb | 265 | 112 | 99 | 1 | 5 | 7 |
| Class 0/I, Flat | 10 | 0 | 0 | 0 | 0 | 0 |
| Disks | 34 | 14 | 6 | 0 | 3 | 5 |
| Evolved | 221 | 98 | 93 | 11 | 2 | 2 |
| (Likely AGB) | 45 | 40 | 39 | 0 | 0 | 1 |
| Spatially Distributed Serpensc | ||||||
| Dunham Totalb | 105 | 59 | 58 | 1 | 0 | 0 |
| Class 0/I, Flat | 4 | 1 | 1 | 0 | 0 | 0 |
| Disks | 3 | 2 | 1 | 1 | 0 | 0 |
| Evolved | 97 | 56 | 56 | 0 | 0 | 0 |
| (Likely AGB) | 55 | 52 | 52 | 0 | 0 | 0 |
| aHere in proper motion as mas/yr. | ||||||
| The distance criterion of is based on parallax uncertainty. | ||||||
| bLikely AGB stars are excluded from all totaled numbers. | ||||||
| cStars labeled ”Aquila” by Dunham et al. (2015) are allocated to different regions as follows: | ||||||
| Serpens Northeast: Declination | ||||||
| Serpens South+W40: Declination | ||||||
| Serpens far-South: within 1.5∘ of ( | ||||||
| Serpens Distributed: Everything else labeled ”Aquila” | ||||||
| RA | Dec | PM(RA) | PM(Dec) | astr.err. | Region | |||||||
| mas/yr | mas/yr | mas | mas | mas | ∘ | mas/yr | ||||||
| 290.06057 | 15.501 | 16.925 | 14.298 | 0.25 | 0.35 | 0.86 | LDN 673 | |||||
| 279.73961 | 12.928 | 13.814 | 11.996 | 0.12 | 0.10 | 0.16 | NE | |||||
| 278.88497 | 13.324 | 14.076 | 12.461 | 0.00 | 0.22 | 0.34 | NE | |||||
| 277.50416 | 13.448 | 14.709 | 12.326 | 0.40 | 0.09 | 0.28 | Main | |||||
| 279.06096 | 13.545 | 14.506 | 12.558 | 0.13 | 0.24 | 0.29 | NE | |||||
| 279.95607 | 13.626 | 14.510 | 12.697 | 0.00 | 0.25 | 0.15 | NE | |||||
| 279.36828 | 13.634 | 14.578 | 12.659 | 0.04 | 0.09 | 0.35 | NE | |||||
| 279.38550 | 13.901 | 14.732 | 13.004 | 0.00 | 0.20 | 0.46 | NE | |||||
| 279.59444 | 14.098 | 15.264 | 12.998 | 0.24 | 0.15 | 0.19 | NE | |||||
| 279.18813 | 14.154 | 15.031 | 13.225 | 0.00 | 0.35 | 0.57 | NE | |||||
| 277.24205 | 14.228 | 15.696 | 12.998 | 0.24 | 0.11 | 0.36 | Main | |||||
| 279.39918 | 14.395 | 15.465 | 13.348 | 0.07 | 0.12 | 0.21 | NE | |||||
| 277.37606 | 14.448 | 15.657 | 13.370 | 0.10 | 0.14 | 0.29 | Main | |||||
| 279.48368 | 14.563 | 15.545 | 13.578 | 0.00 | 0.17 | 0.17 | NE | |||||
| 277.05635 | 14.635 | 16.149 | 13.413 | 0.29 | 0.24 | 0.33 | Main | |||||
| 279.81014 | 14.650 | 15.775 | 13.584 | 0.19 | 0.17 | 0.14 | NE | |||||
| 277.26643 | 14.751 | 15.987 | 13.432 | 0.23 | 0.07 | 0.22 | Main | |||||
| 279.26180 | 14.767 | 15.807 | 13.761 | 0.09 | 0.17 | 0.14 | NE | |||||
| 277.53601 | 14.968 | 16.173 | 13.853 | 0.21 | 0.08 | 0.21 | Main | |||||
| 279.45960 | 14.971 | 16.069 | 13.924 | 0.14 | 0.09 | 0.21 | NE | |||||
| 279.45040 | 15.290 | 16.444 | 14.202 | 0.19 | 0.17 | 0.19 | NE | |||||
| 277.49322 | 15.480 | 16.962 | 14.239 | 0.38 | 0.09 | 0.14 | Main | |||||
| 285.59253 | 12.783 | 13.547 | 11.894 | 0.00 | 0.47 | 1.03 | FGAql | |||||
| aThis full table is available online. | ||||||||||||