Spatial variations of the Sr I 4607 Å scattering polarization signals at subgranular scale observed with ZIMPOL at GREGOR telescope
2Kiepenheuer-Institut für Sonnenphysik (KIS), Schöneckstrasse 6, Freiburg, Germany)
Abstract
Sr I 4607 Å spectral line shows one of the strongest scattering polarization signals in the visible solar spectrum. The amplitudes of these signals are expected to vary at granular spatial scales. This variation can be due to changes in the magnetic field intensity and orientation (Hanle effect) as well as due to spatial and temporal variations in the plasma properties. Measuring the spatial variation of such polarization signal would allow us to study the properties of the magnetic fields at subgranular region. But, the observations are challenging since both high spatial resolution and high spectropolarimetric sensitivity are required at the same time. To the aim of measuring these spatial variations at granular scale, we carried out a spectro-polarimetric measurement with the Zurich IMaging POLarimeter (ZIMPOL), at the GREGOR solar telescope at different limb distances on solar disk. Our results show a spatial variation of scattering linear polarization signals in Sr I 4607 Å line at the granular scale at every , starting from 0.2 to 0.8. The correlation between the polarization signal amplitude and the continuum intensity imply statistically that the scattering polarization is higher at the granular regions than in the intergranular lanes.
1 Introduction
Trujillo Bueno & Shchukina (2007) foresee spatial amplitude variations of the scattering polarization signals in the Sr I 4607 Å line by solving the 3D radiative transfer problem of scattering line polarization in a realistic hydrodynamical model provided that granulation is resolved. The origin of the effect could be related to variations in the magnetic field present in the granulation or the intergranular lanes, as well as local variations in the anisotropy of the radiation field. Spectro-polarimetric observations at =0.3 ( = cos , where is the heliocentric angle) in the solar disk using ZIMPOL (Ramelli et al. 2014) at the GREGOR telescope (Schmidt st al. 2012) by Bianda et al.(2018) reported this spatial variation of the scattering polarization in the Sr I 4607 Å line exits and the polarization signal is higher at the center of granules than in the intergranular lanes. Recent magneto-convection simulations by del Pino Alemán et al. (2018) shows that the theoretical scattering polarization signals are anticorrelated with the continuum intensity at all on-disk positions. Stokes filtergraph observations with Fast Solar Polarimeter (FSP) by Zeuner et al.(2018) at = 0.6 in the Sr I 4607.3 Å line also support an anti-correlation between the line core Stokes Q/I signals and the continuum intensity.
As a continuation of this work, we carried out another observing campaign during June, 2018 at GREGOR to measure these variations at different limb distances on the solar disk. We obtained several measurements at Sr I 4607 Å line at different positions on the solar disk. Seeing conditions allow us to achieve the required spatial resolution only few hours during observing days. We choose to observe quiet regions of the Sun at different limb distances.
In the next sections, we describe the observations at the GREGOR telescope and the data reduction process. We study the possible presence of correlations between the spatial variations of the polarization signals at different limb distances and those of the continuum intensity, which we have used as an indicator of the locations of granular and intergranular lanes. At last we conclude our results.
2 Observations
Our observation campaign at the GREGOR solar telescope was held between 13th June, 2018 to 27th June, 2018. The ZIMPOL system was installed at the GREGOR Spectrograph. The observations were performed at magnetically quiet regions of Sun, close to the West limb, at different limb distances on the solar disk, starting from =0.2 to 0.8. We have always used the adaptive optics system (Berkefeld et al. 2016) to get stable observations for required field-of-view positions. Close to the disk center ( = 0.8 to 0.4), the granular structures are used by the Shack Hartmann wavefront sensor of the adaptive optics system, while near to limb ( = 0.3 to 0.2), bright plage regions are used to lock the regions over time during observations. The spectrograph slit was always placed in a magnetically quiet region, parallel to the nearest limb. The seeing quality fluctuated during our observations. The Fried parameter changes between = 3 cm and = 10 cm. The spectrograph slit covers the 0.3” (width of the slit) times 47”(length of the slit) on the solar area. A ZIMPOL image has 140 pixels in spatial direction with a pixel resolution 0.33”. The estimated spatial resolution of the image for good observing conditions, is found to be 0.6”. The spectral resolution of our observation is of 10 mÅ. We used the GREGOR polarimetric calibration unit (GPU; Hofmann et al. 2012) that is placed at the the second focal point (F2).
3 Results
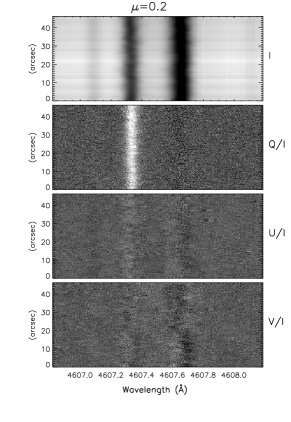
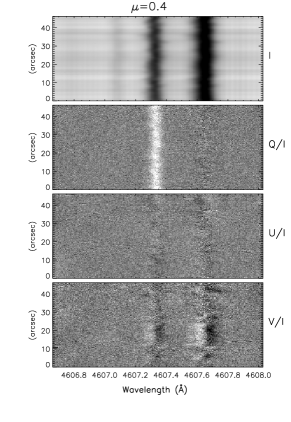
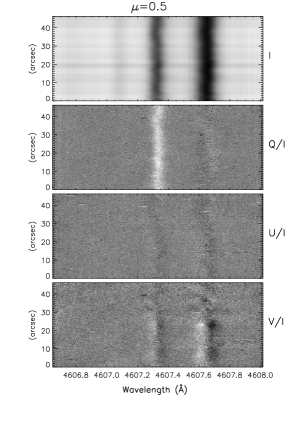
We follow the data reduction process, as mentioned in Bianda et al.(2018). Figure 1 shows a sample of images obtained by averaging several frames that were sequentially registered. The observed regions, shown in the Figure 1 were near the West limb at = 0.2, 0.4 and 0.5. In the Stokes I images one can recognize intensity variations along the spatial direction due to the granulation. The Q/I image shows the scattering polarization peak in the Sr I 4607 Å spectral line. The polarization peak shows clear spatial variations; detection of these variations was in fact the main goal of our observations.
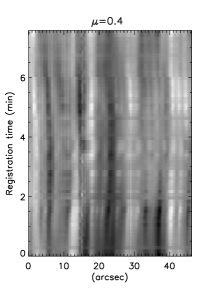

At every observing position, a series of images are obtained. In order to improve the signal-to-noise ratio in the Stokes images, few subsequent frames are averaged over time. At =0.4, the data series contains 68 images (total observing time duration 7.6 min). Taking into account the life time of granulation, we averaged 15 subsequent images of the time series, (integration time over about 1.7 minutes) to have a sufficient signal-to-noise ratio. To evaluate whether this temporal averaging introduced significant spatial degradation in our data, we generated a time space map of images seen by the spectrograph slit. This map is shown in Figure 2 (left panel), where the continuum intensity is reported in gray scale as a function of the spatial position along the slit (x-axis) and time along y-axis. To locate the regions of granular and inter grannular lanes, a single continuum intensity profile is shown as an example in the right panel of the Figure 2. This profile is obtained by averaging over 1.7 minutes from the beginning, then subtracted from its median value, and finally normalized with respect to the absolute maximum value. The positive and negative values represents the locations of the regions of granular and inter grannular lanes. Data is now calculated from images obtained by averaging the time series of 68 Stokes images with a smoothing window width of 15 images, shifted in increments of 15 images (to avoid data overlap). Few images are discarded due to poor seeing conditions during our observation.
The amplitude of each Q/I signal peak of all the 15 averaged Stokes images (600 x 140 pixel) in the Sr I line at every spatial positions is calculated using a Gaussian fit to each of the 140 profiles. The scatter plot in Figure 3 shows how the Q/I peak signals correlate with the continuum intensity at = 0.2, 0.4, 0.5 and 0.8. The solid line is a linear regression suggests a trend of increasing linear polarization in the granules compared to the intergranular regions. The Pearson correlation coefficient (PC) of the individual plot is mentioned. We also obtained similar correlation results for other observing positions ( = 0.6 and 0.7) as well, during good observing conditions. More details about the data reduction procedure and the obtained results will be published in a refereed journal (in preparation) in future. At = 0.45, 0.6 and 0.7, the observations were taken during poor seeing conditions, where the correlation between the scattering polarization Q/I peak amplitudes and the continuum intensity disappeared.


4 Conclusion
We find spatial variations of the Q/I scattering polarization signal of the Sr I 4607 Å line, measured at different limb distances (starting from = 0.2 to 0.8, the direction of positive Stokes Q is parallel to the nearest solar limb) on the solar disk. The obtained spatial scale of the variations is comparable to the subgranular scale. There is a small correlation between the scattering polarization peak amplitudes of the Sr I 4607 Å line and the continuum intensity. This implies, statistically that the polarization inside granular region is higher than in the intergranular lanes. Simulation by del Pino Alemán et al. (2018) foresees an anti-correlation, but is based on high spatial resolution. Numerically deteriorating the signal-to-noise ratio and the spectral and spatial resolutions of the simulated observations reproduces our results. Their theoretical study also suggests that, for investigating the scattering polarization signals of the Sr I 4607 Å line, a better instrument would be a 2D spectropolarimeter with a spectral resolution not worse than 20 mÅ, a spatial resolution 0.1” and a polarimetric sensitivity better than 10-4.
The observed results presented here, are mostly limited by seeing conditions, and also by the available photon statistics. A significant improvement of this study can be done by using imaging polarimetric measurement at line core of Sr I line with high spatial resolution in a large telescope such as the DKIST. In future, we are planning to develop a Fabry-Perot filter based polarimeter system, for synoptic measurement at Sr I 4607 Å line, aiming at investigating the subgranular magnetic field, which could be a second generation instrument to be installed at DKIST.
Acknowledgement IRSOL is supported by the Swiss Confederation (SEFRI), Canton Ticino, the city of Locarno and the local municipalities. This research work was financed by SNF 200020_169418. The 1.5-meter GREGOR solar telescope was built by a German consortium under the leadership of the Kiepenheuer-Institut fur Sonnenphysik in Freiburg with the Leibniz-Institut für Astrophysik Potsdam, the Institut für Astrophysik Göttingen, and the Max-Planck-Institut für Sonnensystem forschung in Göttingen as partners, and with contributions by the Instituto de Astrofsica de Canarias and the Astronomical Institute of the Academy of Sciences of the Czech Republic.
References
- [1]
- [Berkefeld et al. (2016)] Berkefeld, T., Schmidt, D., Soltau, D., et al. 2016, in proc SPIE, Vol. 9909, AOS V, 990924
- [Gisler et al. (2003)] Gisler, D., Feller, A., & Gandorfer, et al. 2003, in proc SPIE, Vol. 4843, Polar. in Astron., ed. S. Fineschi, 45–54
- [Hofmann et al. (2012)] Hofmann, A., Arlt, K., Balthasar, H., et al. 2012, AN, 333, 854
- [Ramelli et al. (2014)] Ramelli, R., Gisler, D., Bianda, M., et al. 2014, in proc SPIE, Vol. 9147, GAI for Astron. V, 91473G
- [Schmidt st al. (2012)] Schmidt, W., von der Lühe, O., Volkmer, R., et al. 2012, in ASPC Series, Vol. 463, ed., 365
- [Trujillo Bueno & Shchukina (2007)] Trujillo Bueno, J., & Shchukina, N. 2007, ApJL, 664, L135
- [Bianda et al.(2018)] Bianda, M., Berdyugina, S., Gisler, D., et al. 2018, A & A, 614, A89
- [del Pino Alemán et al.(2018)] del Pino Alemán, T., Trujillo Bueno, J., Štěpán, J., & Shchukina, N. 2018, ApJ, 863, 164
- [Zeuner et al.(2018)] Zeuner, F., Feller, A., Iglesias, F. A., & Solanki, S. K. 2018, arXiv:1808.06539