Model simulation of optical light curves for blazar OJ287
Abstract
Context. The light curves of optical outbursts observed in blazar OJ287 during 1983–2015 are analyzed and model-simulated to investigate the nature of its optical radiation.
Aims. It is shown that the December/2015 outburst has its multi-wavelength variability behavior very similar to that of the synchrotron outburst in March/2016, indicating that the 2015 outburst may originate from synchrotron process.
Methods. In combination with helical motion of superluminal components, the precessing jet nozzle scenario previously proposed is used to model-simulate the light curves of all the optical outbursts discussed.
Results. The optical light-curves for both periodic and non-periodic outbursts observed in blazar OJ287 can be well interpreted in terms of lighthouse effect due to the helical motion of superluminal optical knots, showing their common origin in synchrotron process.
Conclusions. A coherent and compatible framework is tentatively suggested to understand the entire phenomena in OJ287. The double-peak structure of the periodic outbursts might be explained by invoking the cavity-accretion flare models for comparable-mass binary systems in eccentric motion.
Key Words.:
galaxies: active – galaxies: nuclei – galaxies: jets – galaxies : individual OJ2871 Introduction
OJ287 (z=0.306) is an optically violent variable BL Lacertae object (BLO)
and also one of the bright Fermi -ray sources (Ackermann
et al. Ac11 (2011), Hartman et al. Har99 (1999), Agudo et al. Ag12 (2012)).
Its strong variability has been observed in all the
wavebands from radio to -rays with various timescales
(hours/days to years).
Its optical variability is particularly exceptional. The optical light curve
recorded since 1890s reveals quasi-periodic outbursts
with a cycle of 12 yr (Sillanpää et al. Si88 (1988)).
Up to now four periodic outbursts with double-peaked
flares have been observed in 1972–73, 1982–83, 1994–95 and 2005–2007.
The first flare of the fifth periodic outburst has been
observed in December/2015
and its second flare is predicted to peak on
July 31 2019 (Valtonen et al. Va18 (2018), Dey et al. De18 (2018)
and references therein).
The long-lasting quasi-periodicity is believed to be
related to the orbital motion of a black hole binary in the center of
its host galaxy.
In the early works Brown et al. (1989a ,
1989b ) showed that the variations at infrared (IR), optical and
ultraviolet wavelengths are well correlated. Correlation between
spectral index and flux density was observed at near-infrared (NIR)
wavelengths
(Gear et al. Ge85 (1985)): the source spectrum becomes steeper when it
becomes fainter and vice versa. But Sillanpää et al. (1996a ,
1996b ) found that the optical spectral index (or spectral color) was
very stable during the period 1994–1996 (OJ-94 project,
Takalo 1996a ). Recently, the multi-wavelength observations
performed by Gupta et al. (Gu16 (2016)) during 2015–2017
also demonstrate the stability of the optical spectral color in OJ287.
Variations observed at centimeter wavelengths usually lag the optical
variations (Valtaoja et al. Val20 (2000), Aller et al. Al94 (1994),
Al14 (2014)).
The radio time-delays can be attributed to shock evolution combined with
opacity effects. But there are some observations revealing
simultaneous variations at millimeter and optical wavelengths
(Sillanpää et al. 1996b , Valtaoja et al.Val20 (2000)).
OJ287 is a well-known superluminal source on parsec scales and VLBI
observations reveal that it has a core-jet structure and superluminal
components are steadily ejected from the core (Britzen et al. Br18 (2018),
Hodgson et al. Hod17 (2017), Agudo et al. Ag12 (2012),
Cohen Co17 (2017), Qian QiXiv18 (2018) and references therein).
It has been found that there is a close connection between the optical
flares and the emergence of superluminal components (Tateyama et al.
Ta99 (1999), Qian QiXiv18 (2018)). Recently, based on the analysis of the
kinematics of superluminal components, Britzen et al. (Br18 (2018)) have
made an elaborated relativistic jet model (invoking jet precession plus
nutation) to explain the radio variability and the kinematics on
parsec scales. Based on a potential double-jet scenario,
Qian (QiXiv18 (2018)) tentatively
derived the total mass of the binary in the range
–, which is consistent with the estimation by
Gupta et al. (Gu12 (2012); also see Villforth et al. Vil10 (2010),
Valtaoja et al. Val20 (2000)).
Recently Kushwaha et al. (Ku18 (2018)) and Gupta et al. (Gu16 (2016))
have monitored the multi-wavelength variations in the NIR-optical-UV bands
during December/2015 – May/2016, providing
new information about the variability behavior in OJ287.
They showed that the source has a stable color during that period,
confirming the finding by
Sillanpää et al. (1996a ) and supporting the ”single mechanism” for
the optical flares (periodic major outbursts and non-periodic
synchrotron bursts) in OJ287.
Kushwaha et al. (Ku18 (2018)) have found that the December/2015
optical outburst
111This optical
outburst has been claimed to be a thermal flare produced by the secondary
black hole penetrating the disk of the primary hole. was associated with
a simultaneous -ray flare. In addition, another strong synchrotron
outburst with polarization degree of 30%
was observed in March/2016
which have its temporal and spectral variations very
similar to those observed in the December/2015 outburst.
The phenomena in OJ287 are very complex and may involve several different
mechanisms producing its variations from radio to -rays. Its
multi-wavelength variations reveal many prominent features: e.g., (1) 12 yr
quasi-periodic optical variability; (2) double-peak structure of the
periodic optical outbursts; (3) symmetry of individual optical flare
profiles; (4) multi-component structure of the major optical outbursts;
(5) similarity in the variability behavior of individual bursts and major
periodic outbursts; (6) large range of optical polarization degrees (from
2% to 40%); (7) stability of optical spectral index
(color stability); (8) connection between radio and optical variations;
(9) synchronous radio and optical variations
(simultaneity and similar profiles); (10) ejection of superluminal
components and jet precession;
(11) association of -ray flares with optical flares, etc.
A number of
models have been proposed (referring to the discussions in Villforth et
al. Vil10 (2010), Qian QiXiv18 (2018), Qi15 (2015)). On the whole,
these models can be divided into two categories, both involving a black hole
binary system in the nucleus of OJ287:
-
•
The precessing binary model (or disk-impact model) originally proposed by Lehto & Valtonen (Le96 (1996); improved versions: Valtonen Va07 (2007), Valtonen et al. Va06 (2006), Valtonen et al. Va18 (2018), Dey et al. De18 (2018)) has been steadily elaborated to interpret the variability behavior in OJ287, putting the emphasis on the accurate timing of the first major flares of the periodic outbursts, which were suggested to be bremsstrahlung in origin (unpolarized flares) and produced by the secondary hole penetrating into the accretion disk of the primary hole. In the case of an highly eccentric orbital motion, two impacts would occur near pericenter passages and thus explain the double-peak structure of the periodic outbursts. The recent December/2015 optical outburst was studied and interpreted in detail by Valtonen et al. (Va16 (2016), Va17 (2017)). This model requires a high inclination angle ( – ) 222In this case the jet associated with the secondary hole might not be pointed toward us with a small angle, if its spin axis (and jet axis) is approximately parallel to the orbital angular momentum. and a high eccentricity ( 0.66) and a strong constraint on the total mass of the binary, reaching with a mass ratio m/M0.007. This disk-impact model mainly concentrates on the interpretation of the quasi-periodicity of the 12 yr, double-peak structure and the accurate timing of the periodic outbursts, regarding the periodic outbursts being thermal flares due to the impact of the secondary hole penetrating the primary disk. This model suggests that the follow-up and non-periodic outbursts could be interpreted in terms of the enhanced accretions (disturbances induced by the secondary impacts and tidal effects near pericenter passages). But it can not be used to analyze the complicated phenomena observed in the entire emission (from radio to -rays) and the relationship between the emission properties and the kinematic behaviors on parsec scales. This model is based on very accurate solution of orbital motion by including the post-Newtonian strong gravitational effects, but invoking a fixed (not variable) disk model.
In contrast, Tanaka (Tan13 (2013)) considered a different mechanism (cavity-accretion flare model) for explaining the double-peak structure, assuming the binary having a comparable-mass in a coplanar motion. According to the results of hydrodynamic/magnetohydrodynamic (HD/MHD) simulations for binary systems surrounded by circumbinary disks, the cavity-accretion processes characteristic of comparable-mass binary systems would create two gas streams impacting onto the disks of both the black holes near pericenter passages, thus causing the double-peaked outbursts. This model also suggests that the periodic outbursts are bremsstrahlung flares caused by the impacts of the gas streams. It is not able to provide accurate timing of the periodic outbursts. This cavity-accretion flare model does not discuss the accretion processes during the intervening periods and the interpretation of the follow-up and non-periodic outbursts and the related jet behavior. -
•
Relativistic jet models have been applied to understand the optical and radio variability behavior in OJ287 and discussed by many authors since the earlier years (e.g., Sillanpää et al. 1996a , Valtaoja et al. Val20 (2000)), because these models are considered to be paradigmatic for explaining the variations (from radio to -rays) observed in blazars. Villata et al. (Villa98 (1998)) considered a precessing double-jet model to explain the periodic double-peak structure. Villforth et al. (Vil10 (2010)) suggested that the periodic outbursts could be interpreted in terms of the resonant disk accretion of magnetic field lines. Qian (Qi15 (2015)) investigated the possibility that lighthouse effect could cause the double-peak structure of the periodic outbursts. Recently, based on the analysis of the kinematics of the radio superluminal components, Britzen et al. (Br18 (2018)) proposed an elaborated model to interpret the radio and optical variations, emphasizing the precession and nutation of the relativistic jet being the key ingredients causing the complex phenomena in OJ287. In addition, Qian (QiXiv18 (2018)) tentatively suggested that the periodic optical outbursts could be synchrotron flares produced by the superluminal optical knots moving along parabolic trajectories. But the explanation of the double-peak structure might have to invoke the cavity-accretion process for comparable-mass binary systems (e.g., Tanaka Tan13 (2013), Artymowicz & Lubow Ar96 (1996), Hayasaki et al. Ha08 (2008)). Relativistic models do not involve disk-impacting events, which cause strong thermal flaring events and the optical/radio phenomena in OJ287 may be explained only by invoking the enhanced disk-accretion near pericenter passages and ejection of superluminal optical knots.
It might be worth noticing that, based on the modeling of the kinematics of the superluminal components in OJ287 (Qian QiXiv18 (2018)), the total mass of the potential binary has been tentatively determined to be – 333Mass ratio m/M 0.3. which is consistent with the estimations obtained by Gupta et al. (Gu12 (2012)), Villforth et al. (Vil10 (2010)) and Valtaoja et al. (Val20 (2000)). These values seem to favor a binary system with comparable-mass in a coplanar motion. In this case both the jets associated with the binary holes can point toward us with small angles.
Unfortunately, all the models currently available can only interpret
part of the phenomena observed in OJ287.
Some basic issues are remained to be clarified: mass of th binary,
double peak structure mechanism, color stability, synchronous
radio-optical variations, symmetry in burst
light curves, similar variability behavior of the flares,
simultaneity in optical and -ray flares, etc.
A comprehensive and coherent framework is imperatively needed to solve
all these issues.
In this paper we will apply the precessing jet nozzle model previously
proposed by Qian et al. (1991a , Qi09 (2009), Qi19 (2019)) to make
simulation of the optical light curves for the six periodic major
outbursts (in 1983.00, 1984.10, 1994.75, 2005.76, 2007.70 and 2015.87)
by using lighthouse effect due to the helical motion of superluminal
optical knots.
In particular, the multi-wavelength light curves of both the outbursts in
December/2015 and in March/2016 will be simulated and compared,
demonstrating the distinct similarity in their temporal
and spectral variations (multi-wavelength light curves with similar rising
and decaying time scales and similar broken power-law spectra). Since the
outburst in March/2016 is a highly polarized synchrotron flare, the similar
variability behaviors of the December/2015 outburst (peaking at 2457360)
and the March/2016 outburst (peaking at 2457450) may imply that they have
a common emission mechanism and the December/2015 outburst may be
synchrotron in origin.

| Parameter | fixed value |
|---|---|
| 0.0 rad | |
| -2.0 rad | |
| 0.0402 | |
| 1.0 | |
| 0.0138 mas | |
| d/d | -7.04 rad/mas |
| Waveband | Flux (mJy) |
|---|---|
| K | 8.0 |
| J | 5.0 |
| I | 6.2 |
| R | 3.5 |
| V | 3.0 |
| B | 2.0 |
| U | 1.5 |
| UVW1 | 0.8 |
| UVM2 | 0.8 |
| UVW2 | 0.8 |


| ratio | FWHM | ||||
|---|---|---|---|---|---|
| 360 | 9.5 | 18.88 | 4.11 | 1.16 | 5.9 |
| 450 | 9.5 | 18.88 | 4.11 | 1.16 | 5.9 |
2 Assumptions and approaches
In order to better understand the entire phenomena observed in the blazar
OJ287, we would perform detailed simulation of the light curves of its
optical outbursts, which include not only the periodic major outbursts
(or the ”impact outbursts” claimed to be bremsstrahlung flares caused by
the evolving gas-bubbles torn out from the primary disk by the
secondary-hole penetrations), but also
the non-periodic outbursts (usually recognized as synchrotron flares with
high polarization). The multi-wavelength light curves of the December/2015
outburst (peaking at 2457360) and the March/2016 outburst (peaking at
2457450) are analyzed and compared for finding their common properties:
the symmetry of their light-curves and similarity in their temporary and
spectral variations.
We will apply the precessing jet-nozzle model previously proposed for
several blazars (3C345: Qian et al. 1991a , Qi09 (2009); 3C279:
Qian Qi11 (2011), Qi12 (2012), Qi13 (2013), Qian et al. Qi19 (2019);
3C454.3: Qian et al. Qi14 (2014);
NRAO 150: Qian Qi16 (2016); B 1308-326:
Qian et al. Qi17 (2017); PG 1302-102: Qian et al. Qi18 (2018);
OJ287: Qian QiXiv18 (2018))
to investigate the kinematics of the optical superluminal
components in OJ287 and propose an interpretation for the multi-wavelength
light curves of the optical outbursts in December/2015 and March/2016
obtained by Kushwaha et al. (Ku18 (2018)). We will also perform model
simulation of the V-band light-curves of the six periodic major outbursts in
1983.00, 1984.10, 1994.75, 2005.76, 2007.70 and 2015.87, suggesting a
coherent scenario
to understand the entire phenomena in OJ287.
We describe the main assumptions and relevant approaches
for the model simulation of the outburst light curves as follows.
2.1 Parameters of precessing nozzle model
In order to make model simulation of the light curves of the optical
outbursts in OJ287, we would need to use an appropriate and specific
scheme of the precessing nozzle model. Here we we adopt the geometric
parameters applied in the previous precessing nozzle models
(details referring to Qian QiXiv18 (2018)) and introduce the parameters
of helical motion.
We assume that the superluminal optical knots move along helical
trajectories around the jet axis which precesses around the precession
axis, as shown in Figure 1 (left panel). The precession axis is defined by
parameter = and = 0.0 rad. The jet axis
ia assumed to be a straight line with parameters = 0.0402 and
= 1.0 (details referring to Qian QiXiv18 (2018)), which precesses
around the precession axis with a period of 12 yr. Optical superluminal
knots are assumed to be ejected from the jet nozzle, moving outward along
helical trajectories. The helical motion of the optical knots are skechily
shown in Figure 1 (left panel). Using the the precessing nozzle model we
can study the helical motion of superluminal optical knots ejected at
different precession phases. For concrete model simulations, we will
assume that the superluminal optical knots are ejected along the jet axis
defined by the precession phase = –2.0 rad, moving along the
helical trajectories which are defined by parameters and
d/dz: represents the amplitude of the helical trajectories
and d/dz represents the rotation rate of the helical motion.
We will take = 0.0138 and
d/dz = –7.04 . The model parameters are summarized
in Table 1. In order to demonstrate the common features of helical
motion of the superluminal optical components, parameters and
d/dz are assumed to be constant for all the optical flares and only
their bulk Lorentz () and intrinsic flux density ()
are chosen to
model-fit their light curves. Constant and d/dz describe
uniform helical motion in a perfect collimation zone.444Introducing
and d/dz as functions of distance , one can study various
patterns of helical motion.
2.2 March/2016 outburst: a synchrotron flare
As shown by Kushwaha et al. (Ku18 (2018)), the strong optical outburst
observed in March/2016 (peaking at 2457450) is a synchrotron flare with a
high polarization degree of 30% (at R-band). This is consistent with
the observations made by Valtonen et al. (Va17 (2017)). Both the optical
polarization observations rule out the possibility that the March/2016
outburst is a bremsstrahlung-dominated flare. The reason is: if this
outburst comprised of two components (one thermal and one synchrotron) and
was thermal-dominated, then in order to
explain its 30% polarization, the synchrotron component would be required
to have a polarization degree of at least 60%. Such high polarization
degrees have never been observed in OJ287 (e.g., see the photopolarimetric
light curves (R-band) during 2005–2008 in Villforth et al. Vil10 (2010)).
Thus we suggest that the March/2016 outburst (peaking at 2457450)
originates from synchrotron process, definitely a non-thermal flare.
This argument is a simple and natural one in blazar physics, but seems quite
important for understanding the physical processes in OJ287. For example,
the spectral energy distribution (SED) and its variation of the March/2016
outburst are very similar to those of the December/2015 outburst
(Fig.4 in Kushwaha et al. Ku18 (2018);
also see Figures 4 – 9 displayed below). The SED of both the
outbursts reveals two prominent
features: (1) an offset between the visible spectrum and the near-infrared
(NIR) spectrum; (2) a
transition from a rather steep visible spectrum to a flatter UV spectrum.
Superficially, these features look like those observed in other blazars
(e.g., 3C345, 3C454.3, BL Lac and AO 0235+106; Bregman et al. Bre86 (1986),
Raiteri et al. Ra07 (2007), Villata et al. Villa04 (2004),Villa02 (2002),
Raiteri et al. Ra05 (2005)), which have been claimed to
be constructed from the ”big blue bump” and ”little blue bump”
produced by the accretion disks and emission lines in the broad-line regions
(BLR). However, in the case of OJ287, the variations in the UV-band are
simultaneous with the NIR-optical variations and no color changes occur
during the March/2016 synchrotron outburst (as well during the
December/2015 outburst).
This variability behavior seems indicating that the emission from the
NIR-optical to the UV-bands are all produced in the jet and the emitting
source might have a peculiar inhomogeneous structure (Raiteri et al.
Ra07 (2007), Ra06 (2006), Ostorero et al. Os04 (2004)). We will continue
to argue for this possibility below, especially based on the connection
between the radio and optical outbursts.
2.3 Similarity between 2015 and 2016 outbursts
In the following sections, we will perform model simulation of the multi-wavelength (NIR-optical-UV) light curves of the December/2015 and March/2016 outbursts (Kushwaha et al. Ku18 (2018), Gupta et al. Gu16 (2016)) and show that the temporary and spectral variations of the December/2015 outburst are very similar to those of the March/2016 outburst, although the March/2016 outburst occurred 90 days later, but was as strong as the December/2015 outburst and had high polarization degrees. They have similar multi-wavelength light curves in the NIR-optical-UV bands having symmetric profiles with very similar rising and declining timescales. While the December/2015 outburst has been claimed to be an “impact thermal outburst”, occurring at a location 18,000 AU away from the primary black hole and originating from an evolving gas-bubble torn out from the accretion disk of the primary hole (Lehto & Valtonen Le96 (1996), Valtonen et al. Va16 (2016)), the March/2016 outburst is definitely a non-thermal flare, originating from synchrotron process in the jet. It is rather difficult to understand why the December/2015 thermal outburst could have its temporary and spectral variability behavior so resembling to that of the March/2016 synchrotron outburst. Our model simulation of their light-curves indicates that the March/2016 and December/2015 outbursts could be interpreted in terms of the lighthouse effect due to helical motion of one superluminal optical knot in a perfect collimation zone of the jet via two helical revolutions. Thus the resemblance in the temporary and spectral variations observed in December/2015 and March/2016 outbursts may imply that both December/2015 and March/2016 outbursts originate from a common radiation mechanism and they are non-thermal (synchrotron) flares produced in the jet. The two outbursts may be combined into ”one flaring event” 555The data-points of the March/2016 outbursts need to be shifted backward in time by 89.4 days. and their observational data-points are superposed to analyze the common properties of their temporary and spectral variations. For the R-band light curves, the data-points measured by Valtonen et al. (Va16 (2016)) are also incorporated in the analysis, providing sufficiently complete temporal coverage for the simulation of the multi-wavelength light curves.
2.4 Nature of 2015 outburst: -ray observations
The nature of the radiation of the outburst in December/2015 (peaking at
2457360) is still a debatable issue: whether it is a
synchrotron flare or a bremsstrahlung-dominated one. We argue that the
December/2015 optical outburst may be a synchrotron flare.
According to Valtonen et al. (Va16 (2016)), the December/2015 outburst
is composed of two components: one bremsstrahlung component and
one synchrotron component, and it is bremsstrahlung-dominated.
In order to explain its observed polarization
degree of 6%, the non-thermal component is assumed to be highly
polarized with a polarization degree of 40%.666Here
we do not consider the case that the base-level makes a 10% contribution
to the polarization degree.
In this case the thermal component is much stronger than the non-thermal
component, making
68% and 17% contributions to the total flux of the outburst,
respectively.777The base-level emission makes a steady 15%
contribution to the total flux density. However, the
relationship between the thermal component and the non-thermal component
was not clarified: (1) where this highly-polarized component is produced:
in the jet of the primary hole or in the jet of the secondary hole ?
(2) How could the flux variation of the non-thermal component be
simultaneous with that of the thermal component, because the two emission
components appeared at different locations
(not co-spatial): the thermal flare occurred at 0.1 pc away from the
primary hole and its jet; (3) How could the variable
non-thermal component (with a constant polarization degree) be possible to
closely match the behavior of the thermal component, because they originate
from different emission mechanisms: bremsstrahlung from an evolving
gas-bubble and synchrotron emission from a shock in the jet, having
different evolution behaviors with different timescales.
It is worth noticing that the December/2015 outburst emits -rays
and the variations in the -ray bands are simultaneous with the
variations in the NIR-optical-UV bands without time lags
(Kushwaha et al. Ku18 (2018)), having similar variability time scales.
Obviously, this -ray flare should be associated with
the synchrotron flare component and both emitting regions must be co-spatial
within the relativistic jet. Thus the simultaneity in the variations and
the similarity in the variability behavior between the -ray
flare and the bremsstrahlung-dominated outburst seems unlikely,
because the bremsstrahlung flare is believed to be produced by
an evolving gas-bubble torn off the
primary hole accretion disk by the second black hole penetrating into the
primary disk (Lehto & Valtonen Le96 (1996)), occurring at a distance of
18,000 AU away from the primary black hole and its jet
(Valtonen et al. Va17 (2017)), while the synchrotron component flare and
its associated -ray flare are produced in the jet of the primary
black hole: they occur at different locations (not co-spatial) through
different mechanisms. The only plausible interpretation for the
simultaneous variations in the -ray and optical bands
may be that the December/2015 optical outburst is originated from the jet
through synchrotron process. This may be the most persuasive argument
for the December/2015 outburst being a non-thermal flare.
2.5 Spectral energy distribution of December/2015 outburst
As typically observed in generic blazars, the spectral energy distribution
of the December/2015 outburst consists of two bumps: one in the
NIR-optical-UV bands and the other one in the -ray bands (Kushwaha
et al. Ku18 (2018)). These two bumps are normally interpreted in terms of
synchrotron and inverse-Compton processes, respectively. In the one-zone
scenario (e.g., Qian et al. 1998a , 1998b , Ghisellini et al.
Gh07 (2007), Vercellone et al. Ve10 (2010), Ve12 (2012)),
the simultaneity of
the NIR-optical-UV and -ray variations and their similar
variability time scales (rising and declining timescales) would suggest
that the NIR-optical-UV emitting region and the -ray emitting
region are co-spatial in the jet of the primary hole. It seems difficult to
understand that the -ray flare could be simultaneous with the
NIR-optical-UV variations in a bremsstrahlung-dominated outburst. Moreover,
under the bremsstrahlung-dominated assumption for the December/2015
outburst, the low-frequency bump of its SED has to be decomposed into
two parts (Kushwaha et al. Ku18 (2018)): one thermal and one non-thermal.
The peak frequency of the non-thermal part has to be shifted to the
far-infrared regime and its optical-UV power has to be lowered
to only a half of the observed optical-UV power, reaching the power levels
during the quiescent states in OJ287
(e.g., Seta et al. Set09 (2009), Kushwaha et al. Ku13 (2013),
Kushwaha et al. Ku18 (2018)). This seems inconsistent with the
normal behavior
observed in -ray blazars: the synchrotron bump moves to higher
frequency with higher peak power ()
during -ray flaring states,
when the high-energy bump shifts to higher energy -ray bands.
Therefore, it seems more likely that the low-frequency bump of the
December/2015 outburst may be entirely synchrotron in origin.
888Note that, the peak frequency of the low-frequency bump
usually observed in OJ287 does not show significant
difference between the quiescent and flaring states, but the peak power
increases during the flaring states (Seta et al. Set09 (2009)).
2.6 Broken power-law spectrum
The spectral break detected in the optical–UV wavebands for the December/2015 outburst (Kushwaha et al. Ku18 (2018)) has been interpreted as due to the thermal emission of the accretion disk surrounding the primary black hole with a mass of . It is noted that the March/2016 outburst has a similar spectral break, which may not originate from the primary disk and due to the superposition of the synchrotron emission from different jet regions. Moreover, both outbursts has no color variations, as Gupta et al. (Gu16 (2016)) observed. Thus in the following simulations of the multi-wavelength light curves of the two outbursts, a common broken power-law spectrum will be assumed with a spectral break of =0.5: in the K- to V-bands with =0.8, and in the V- to UV-bands with =1.3. The spectrum is sketchily shown in Figure 2 (left panel). This kind of broken power-law spectrum can be resulted from local continuous injection or re-acceleration of relativistic electrons in the superluminal optical knots under synchrotron/IC radiative losses (Kardashev Ka62 (1962), Pacholczyk Pa70 (1970), Qian Qi78 (1978), 1996a , 1996b , Qi97 (1997), Sahayanathan et al. Sa03 (2003)). The synchrotron spectrum assumed here is essentially different from the bubble-emitting bremsstrahlung spectrum produced by the disk-impacting process. It is noted that the thermal spectrum predicted by the disk-impact model was much flatter at optical-UV wavelengths. According to Valtonen & Ciprini (Va12 (2012)) and Valtonen et al. (Val12 (2012)), the thermal spectrum of the 2005 outburst was derived from the observed spectrum by correcting the host galaxy extinction with a hydrogen column density of 6.3/. However, if correction of extinction in the host galaxy were needed, the synchrotron spectrum of the March/2016 outburst would also be converted into a thermal spectrum. This seems unlikely. Thus the host galaxy extinction will not be included here and we suggest that both the December/2015 and March/2016 have similar non-thermal spectra.
2.7 Spectral variability
As explained in Sect.2.1, the spectral energy distribution of the December/2015 outburst (peaking at 2457360) in the NIR-optical-UV bands exhibits two distinct features: the offset between the NIR and optical portions and the transition from the rather steep optical spectrum to a flatter spectrum in the UV portion. If this NIR-optical-UV spectrum could be interpreted as composed of two constituents: a thermal spectrum emitted from the accretion disk of the primary black hole (with a mass of ) dominating the optical-UV emission and a synchrotron spectrum emitted from a shock in the jet dominating the IR-radio emission, one would have to explain why the two emitting sources could vary simultaneously. Moreover, the March/2016 outburst (peaking at 2457450) has its spectrum and spectral variations very similar to those of the December/2015 outburst and both outbursts exhibit no color changes (Gupta et al. Gu16 (2016)). As the March/2016 outburst is a highly-polarized synchrotron one, its spectral variations should not be related to the thermal emission from the primary disk and its color stability must be a characteristic feature of the synchrotron source itself. The color stability commonly observed in both December/2015 and March/2016 outbursts may be a significant signature demonstrating the nature of their emission. Thus the similarity in the spectral variations between the December/2015 and March/2016 outbursts may imply that the December/2015 outburst also originate from the jet. In fact, according to the disk-impact model, the December/2015 outburst is caused by the evolving gas-bubble torn off the primary disk by the secondary hole impacting. The thermal emission from an evolving gas-bubble during its adiabatic expansion and cooling (from K to lower temperatures) would be color-changeable, inconsistent with the observations.
2.8 Symmetry in light curve profiles
As Sillanpää et al. (1996a ) pointed out that during
the OJ-94 project period (1993.8–1996.1) the two major outbursts had a
strong symmetry. Through detailed inspection, we recognized that
the two major outbursts could be decomposed into a number of subbursts,
each having symmetric light curves with similar rising and declining
timescales. A few isolated moderate outbursts also have symmetric
light curves. Most interestingly, the December/2015 outburst peaking
at JD2457360 (Valtonen et al. Va16 (2016)) does not exhibit the
”standard light curve” expected for “impact outbursts”
(Valtonen et al. Va11 (2011)), but showing a symmetric profile.
During the period of September/2015 – May/2017, a number of rather
isolated moderate bursts (e.g., peaking at JD-2457379, -2457450, -2457759
and -2457885; Valtonen et al. Va17 (2017)) were observed to exhibit
symmetric profiles.
As discussed in Sect.4 below, the five periodic outbursts
(in 1983.00, 1984.10, 1994.75, 2005.76 and 2007.70) could be decomposed
into a number of subflares with each subflare (or ”elementary flare”)
having a symmetric light
curve. This can be clearly seen in Figures 10 – 12 and 14 – 15.
Since symmetry in the light curves is a common characteristic feature,
the periodic and non-periodic outbursts in OJ287 should originate
from similar mechanisms. However, both the
evolving gas-bubble emitting mechanism (Lehto & Valtonen Le96 (1996))
and the shock-in-jet models (e.g., Marscher & Gear Ma85 (1985),
Qian Qi10 (2010)), could not produce outbursts with symmetric
light-curves. In this work, we would suggest that the symmetric
light-curves observed in OJ287 are produced by lighthouse effect
due to the helical motion of superluminal optical knots in
the jet (Qian Qi15 (2015)).
2.9 Connection between radio and optical flares
Investigations of the connection between the radio and optical variations
may provide important clues for the entire phenomena in OJ287 and help to
understand the nature of its multi-waveband emissions. Centimeter
radio bursts (e.g., at 8 GHz) are typically observed to be delayed with
respect to the optical outbursts by a month or so. The bump-like
structure in the radio light curves are connected with the spike-like
structure in the optical light-curves (Britzen et al. Br18 (2018),
Tateyama et al. Ta99 (1999), Qian QiXiv18 (2018)).
This kind of radio-optical connection can be
understood as a result of the evolution of the superluminal optical knots
(shocks or blobs) combined with the opacity effects at radio
frequencies (Qian Qi10 (2010)). However, simultaneous flares have been
observed in OJ287 at millimeter and optical wavelengths. For example,
Sillanpää (1996b ) observed a simultaneous behavior at the
beginning of the year 1992 (JD2448610 – JD2448670): the variations at
optical V-band and at 37 GHz were not only simultaneous but also had
very similar profiles. According to Valtaoja et al. (Val20 (2000)), during
the period 1990.5–1994.0, the 37 GHz variations were mostly simultaneous
with the optical variations with no measurable time delays. In addition, the
major 37 GHz outburst (peaking in 1996.61) has an approximately symmetric
profile with its declining phase closely tracking the optical flare.
Most interestingly, the two major optical flares of the double-peaked
outbursts during 1994.7–1996.1 had different connections between the
millimeter flares and the optical flares. For the first optical flare
(1994.8–1995.3) there was no simultaneous 37 GHz counterpart observed
(Sillanpää et al. 1996b ). But for the second optical flare
(1995.90–1996.10) simultaneous 37 GHz and optical variations
were observed. According to Valtaoja et al. (Val20 (2000), Fig.8 therein),
both the optical and millimeter flares have complex multi-component
structures. The millimeter
and the optical variations are not only simultaneous but also have very
similar envelopes. Thus both the optical and radio/mm light curves
could be decomposed into a number of subflares (or elementary flares)
with symmetric profiles and
interpreted in terms of the helical motion model.
Obviously, the close connection between the millimeter and optical flares
observed in the 1995.9 periodic outburst seems important, implying that:
(1) The optical and radio flares should be produced in
co-spatial emitting regions999Here “co-spatial” would mean some
special structure (or emission distribution) of the optical-millimeter
source in the direction perpendicular to its motion.and originate from
a common synchrotron process in the relativistic jet; (2) The
simultaneity in the millimeter and optical variations may disfavor
shock-in-jet models, because optical shocks typically evolve through
three stages (Compton - synchrotron - adiabatic stages), resulting
in different optical-radio relationships (Qian et al. Qi10 (2010),
Qian 1996a , 1996b , Qi97 (1997),
Marscher & Gear Ma85 (1985), Valtaoja et al. Val88 (1988),
Val92 (1992), Litchfield et al. Li95 (1995)).101010This does not
exclude the possibility that the superluminal components are steady shocks
on time-scales of ten days or so.
Thus shock-in-jet models seem not able to produce simultaneous mm-radio and
optical variations with very similar symmetric light curves.
We would suggest that lighthouse effect due to helical motion of
superluminal optical knots (shocks or blobs) may be the most plausible
mechanism to interpret the simultaneity and symmetry observed in the
mm-radio and optical variations observed in OJ287. The proposed helical
motion model seems working well, as described in Sect. 3 and 4.
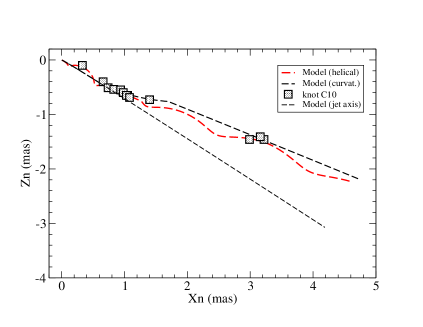
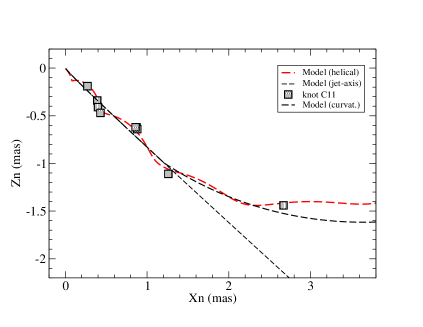
We point out that helical motion of radio superluminal knots might also
exist. For example, model-simulation of the kinematics of the
superluminal components C10 and C11 of OJ287 in terms of helical models
has been tried in Qian (QiXiv18 (2018)), which are shown in Figure 3.
These helical trajectories have very small pitch angles and could not be
easily discovered. It should be noted that in the precessing jet-nozzle
models (Qian et al. Qi19 (2019)) the flux density curves of the optical
and radio knots can be explained in terms of lighthouse effect caused by
their helical motions, but different knots may move along different
helical trajectories. This is different from the Doppler boosting and
beaming effects caused by the precession of the whole jet
(with a 12 yr period) which do not contribute to the
radio and optical flaring activities with timescales of ten days or so.
| ratio | FWHM | ||||
|---|---|---|---|---|---|
| 360 | 9.5 | 18.88 | 4.11 | 1.16 | 5.9 |
| 450 | 9.5 | 18.88 | 4.11 | 1.16 | 5.9 |

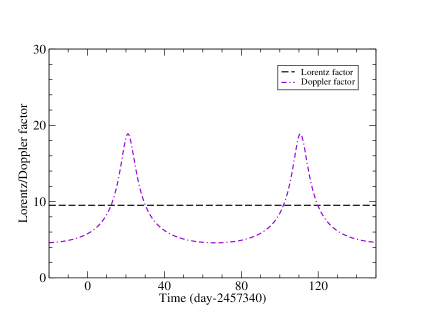
2.10 Lighthouse effect and Doppler boosting
We will explain the multi-wavelength light curves of the optical outbursts in terms of lighthouse effect. For simplicity, it is assumed that the superluminal optical knots move along helical trajectories around the rectilinear jet axis which precesses around the precession axis, as sketchily shown in Figure 1 (left panel). In this case the lighthouse effect results in a symmetric light curve via Doppler boosting per revolution. In addition, we assume that the observed flux density of the optical outbursts at any frequency consists of two constituents: a steady base-level () and the flaring part (t):
| (1) |
Using relativistic jet models, the evolution of the flux
density of superluminal optical knots can be written as:
=.
is the intrinsic flux density (in the comoving frame of
the optical knots). For moving optical knots p=3 (Blandford & Königl
Bl79 (1979)) and is the spectral
index. In our model simulation is assumed to be constant
111111=constant is a simplified assumption. Taking the
rising and declining parts of the outbursts into account would result in
truncations of the model light curves at both start- and end-points,
more clearly separating the contributions from consecutive subbursts. and
the spectral index in V-band equals to 1.0. The broken power-law spectrum in
the NIR-optical-UV bands is
assumed as: =0.8 in the NIR – optical (V) bands and
=1.3 in the optical (V) – UV bands. The steady base-level
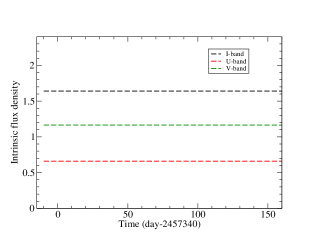
spectrum () is listed in Table 3 and shown in Figure 2
(middle panel). The modeled intrinsic flux densities
for the optical knot are shown in Figure 2 (right panel)
for I-, V- and U-bands as a demonstrating example. The multi-wavelength
light curves of the optical knot are only determined by the Doppler
boosting.
In the simulation of the outburst light curves the modeled flux
density of the outbursts (at V-band) will vary in the range from
to ,
while the total flux density in the range from
+
to +. Because the
base-level flux does not
vary during the outbursts, the variability amplitude of the total
flux will be smaller than that of the flaring components.
This shows the characteristic feature of our
precessing nozzle model distinct from the precessing jet models
usually used in literature, where the precession of the entire jets will
also cause the variations in the base-level flux density.
2.11 Selection of parameters for simulation
In this work we shall use simple approaches to make model simulation
of the observed light curves for all the outbursts concerned, that is,
all the model parameters listed in Table 1 are assumed to be constant.
The parameters describing the spectral features of the outbursts
(the broken power-law spectra) are also taken to be constant.
Notwithstanding this simplification, the variability behaviors of all
the outbursts (both periodic and non-periodic) can be well
interpreted in terms of our lighthouse scenario. At the same time,
there remains a wide scope for choosing the model parameters to improve
the simulation for any individual outburst. For example, an adoption of a
different value for can consider the helical motion (and lighthouse
effect) at a different precession phase. Changes in parameters and
d(z)/dz can be used to investigate various patterns of
helical motion of the superluminal optical knots. Specifically, a local
slight change of the spectral index at J-band could result in a better fit to
the J-band flux densities observed in the December/2015 and March/2016
outbursts (see Fig.6, upper panels). In addition, intraday
variations (IDV) could also be included for explaining the rapid
variations, which might be due to interstellar
scintillation or turbulent fluctuations in the emitting sources
(Qian et al. 1991b ,
Melrose Me94 (1994), Marscher et al. Ma08 (2008), Marscher Ma14 (2014)).
It is found from the light curve simulations that intraday spectral
variations might be an important ingredient, which could result
in the data-points deviating from the model light curves.
Therefore through adjusting the model parameters, the model-fits to
the light curves of all the outbursts discussed in this paper could be
further improved.
2.12 Relevant MHD theories
Most astrophysicists believe that relativistic jets are formed by rotating magnetic fields in the magnetospheres of the black-hole/accretion-disk systems, as the magnetohydrodynamic (MHD) theories of jet formation indicate (Blandford & Znajek Bl77 (1977), Blandford & Payne Bl82 (1982), Camenzind Cam90 (1990), Beskin Be10 (2010), Meier Mei01 (2001), Vlahakis & Königl Vl04 (2004)). However, few observations have provided direct and compelling evidence for helical magnetic fields and helical motions on parsec scales (e.g., Gabuzda et al. Ga04 (2004), Ga15 (2015)). Now, as demonstrated in this work, the prevailing symmetric properties of the light curves of the optical outbursts observed in OJ287 may be recognized as a favorable evidence of helical motion of its superluminal optical knots along helical magnetic fields in the relativistic jet. This would also help to investigate the helical motion of superluminal knots in other blazars. However, for OJ287, the interpretation of the quasi-periodicity in its variability behavior and the timing of the double-peaked outbursts remains to be a challenge.
2.13 A brief summary
For understanding the phenomena observed in blazar OJ287, comparison of
the emission properties of the periodic outbursts (so claimed “disk-impact
outbursts”) and the non-periodic optical outbursts (normal synchrotron
outbursts) may be an appropriate approach.
Based on the above assumptions we will be able to
model simulate the multi-wavelength light curves of both the December/2015
and March/2016 using a very simple model, which only involves a
superluminal optical knot (with a steady broken power-law synchrotron
spectrum) moving along a steady helical trajectory. As shown by the model
simulation results given in the next section, this simplified model is
already sufficient to explain the most of the basic properties of the
temporal and spectral variations of the two optical outbursts, showing
their very similar variability behaviors and the nature of their
optical/UV emission. Both the optical outbursts in December/2015 and
March/2016 can be well interpreted as produced by the lighthouse effect
due to one superluminal optical knot moving along a helical trajectory
through two helical revolutions: the
lighthouse effect firstly produces the December/2015 outburst and then
the March/2016 outburst 90-days later. This would imply, as suggested
in Qian (Qi15 (2015)), that there may exist a stable and perfect
collimation/acceleration zone (with strong magnetic fields) in OJ287,
providing the necessary
physical conditions (injection of relativistic electrons and helical motion)
to cause such a behavior of optical outbursts for long times, although
in most cases only one outburst is caused by one helical revolution due to
the opening of the jet or intrinsic dimming of the optical knots in the
outer parts of the jet.
We will also model simulate the light-curves of other five periodic
optical outbursts in 1983.00, 1984.10, 1994.75, 2005.76, and 2007.70, and
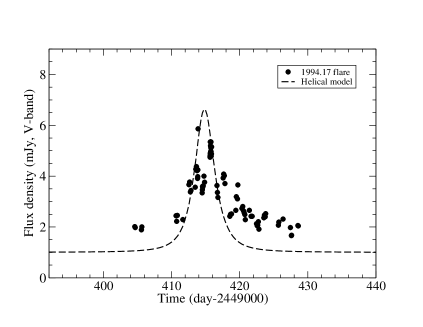
for a few isolated moderate outbursts (in 1993.93, 1994.17 and
at JD2457380), showing the common properties of these outbursts
and their common mechanism for optical radiation production.
All the data on the light curves of the optical outbursts used in this work
were collected from: Valtonen et al.(Va16 (2016), Va17 (2017), Va08 (2008)),
Kushwaha et al. (Ku18 (2018)),
Valtaoja et al (Val20 (2000)) and Sillanpää et al. (1996a ,
1996b and private communication).
In this work, we adopt a CDM cosmological model with the
parameters as: = 0.27, = 0.73 and
=71 km (Spergel et al.
Sp03 (2003), Komatsu et
al. Ko09 (2009)). 1 mas = 4.5 pc (Hogg, Ho99 (1999)).

3 Simulation results of multi-wavelength light curves
The model simulation results of the multi-wavelength light curves
(in NIR-optical-UV bands)
for the periodic optical outburst in December/2015 (peaking at JD2457360)
and the non-periodic synchrotron outburst in March/2016
(peaking at JD2457450) are shown
in Figures 4–9. The relevant model parameters are listed in Table 4.
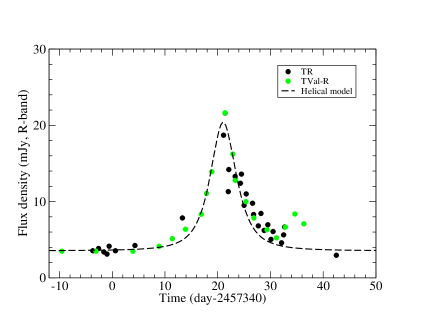
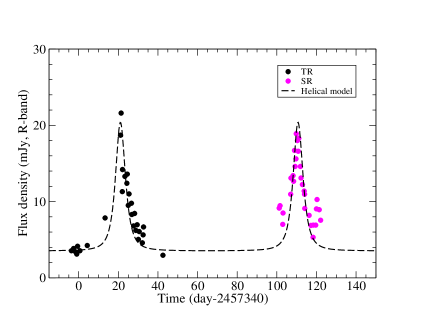
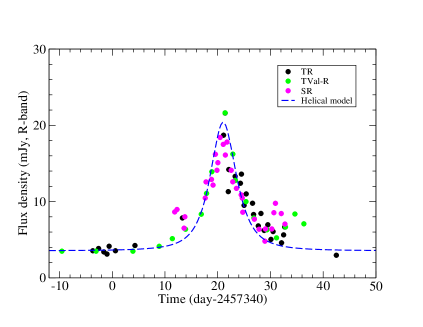
Firstly, in Figure 4 (left panel), we display the model simulation
of the R-band light curves of the December/2015 outburst observed
by Valtonen et al. (Va16 (2016); labeled by “TVal-R”) and by Kushwaha
et al. (Ku18 (2018); labeled by “TR”). It can be seen that the combination
of the data-points from Valtonen et al. (during the rising phase) and
Kushwaha et al. (during the decaying phase) constructs a well-defined
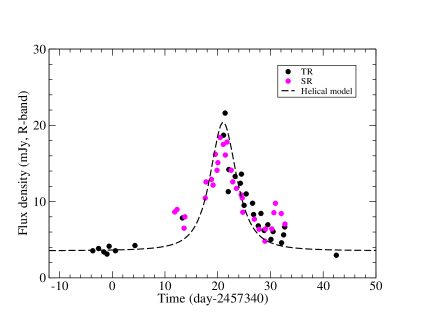
profile simulated by the modeled symmetric light curve. In the right panel
of Figure 4, the R-band light curve of the March/2016 outburst (labeled
by “SR”) observed by Kushwaha et al. has been incorporated in the
simulation with its time-axis being shifted backward by 89.4 days.
It can be seen that the R-light curves of both the December/2015 and
March/2016 outbursts can be well simulated in terms of a common
symmetric profile. Since the March/2016 outburst is definitely a
non-thermal (synchrotron) flare with high optical polarization degrees,
the strong similarity between the variability behaviors of the
December/2015 and March/2016 outbursts leads us to recognize that
the December/2015 outburst121212The December/2015 outburst peaking
at JD2457360 was identified as the periodic “impact thermal flare”
in the disk-impact model. is also a synchrotron flare generated in
the relativistic jet. Thus both outbursts can be interpreted in terms of
lighthouse effect due to the helical motion of one superluminal optical
component during two helical revolutions.
Now we present the simulation results of the multi-wavelength
light curves for each waveband individually.
-
•
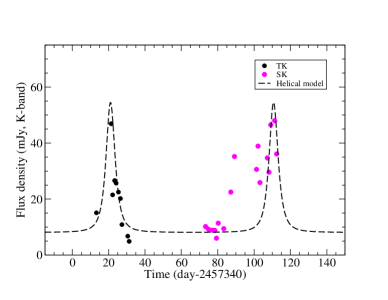
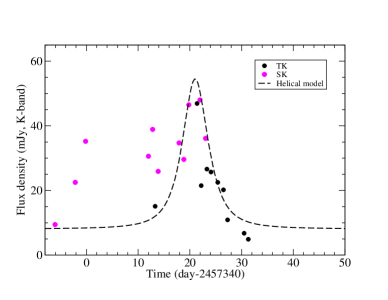
The model simulation results of the K-band light curves for both outbursts in December/2015 and March/2016 are shown in Figure 5. Here two panels are presented: the left panel displays the simulation of the two light curves in time sequence and the right panel shows the simulation of the combined light curve. It can be seen that the K-band light curves of both outbursts are well fitted by the helical motion model, implying that the outburst in December/2015 has its variability behavior very similar to that of the synchrotron outburst in March/2016.
-
•
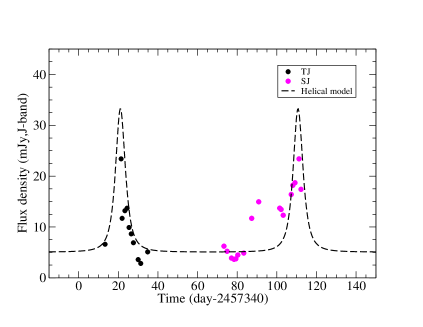
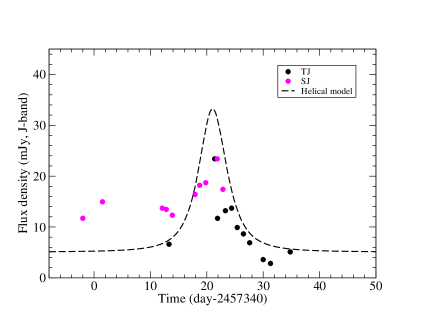
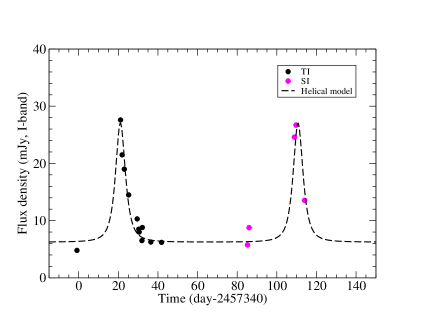
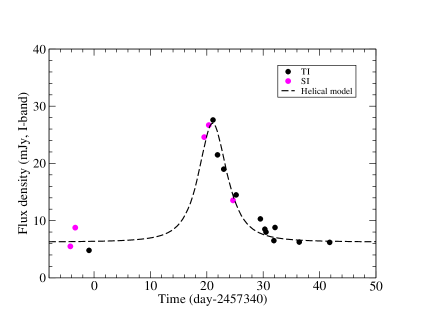
The model simulation results of the J-band and I-band light curves for the outbursts in December/2015 and March/2016 are shown in Figure 6. The upper panels show that the observed J-band peak is much lower than the model light curve. This result should have been expected, because the assumed model spectral index at J-band =0.8 is larger than the observed one (Kushwaha et al. Ku18 (2018)). The observed I-band light curves for both outbursts are well fitted by the helical motion model.
-
•
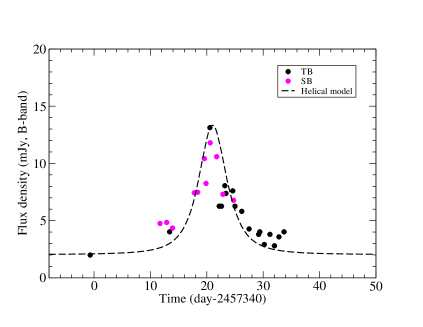
The model simulation of the R-band light curves for both outbursts in December/2015 and in March/2016 are shown in Figure 7 (top panels). The left panel displays the simulation of the light curves for both outbursts in time sequence and the right panel shows the simulation of the three light curves (labeled by “TR”, “SR” and “TVal-R”) in a combined form. It can be seen that the R-band light curve of the outburst in December/2015 has its variability behavior very similar to that of the synchrotron outburst in March/2016: both are well fitted by the helical motion model with symmetric profiles having similar rising and decaying time-scales.
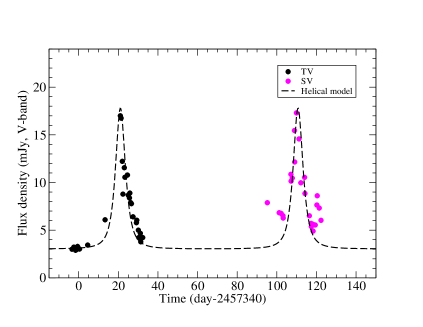
Similarly, the model simulation results of the V-band light curves for the outbursts in December/2015 and in March/2016 are displayed in Figure 7 (bottom panels). It can be seen that both the observed V-band light curves (whether presented in time sequence or in combined form) are very well fitted by the helical motion model. Thus at both R- and V-bands the outburst in December 2015 has its variability behavior very similar to that of the synchrotron outburst in March/2016, implying that their emission may originate from a similar mechanism. In this work we suggest that both outbursts are produced by the helical motion of one superluminal optical knot via lighthouse effect through two helical revolutions, although we cannot exclude the possibility that they might be independent flares with very similar temporary and spectral variations. -
•
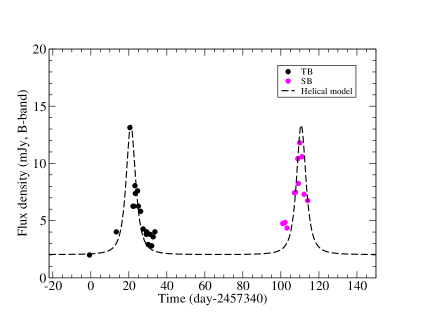
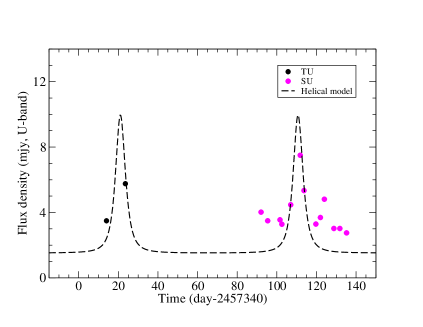
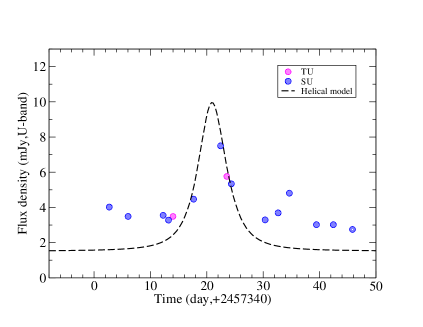
The model simulation results of the B-band and U-band light curves for the outbursts in December/2015 and in March/2016 are shown in Figure 8. It can be seen that the observed light curves for both outbursts are well fitted by the helical motion model, showing that even in high frequency regions (B- and U-bands) the outburst in December/2015 has a variability behavior similar to that of the synchrotron outburst in March/2016. The symmetry of the outburst profiles characteristic in the low frequency region (K-band to V-band, modeled spectral index = 0.8) persists in the high frequency region (modeled spectral index = 1.3).
-
•
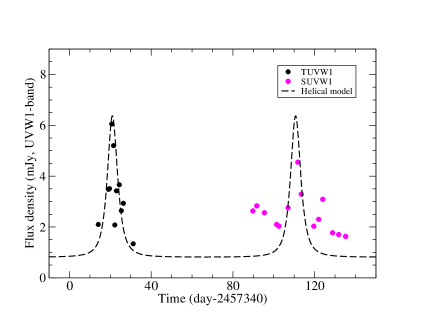
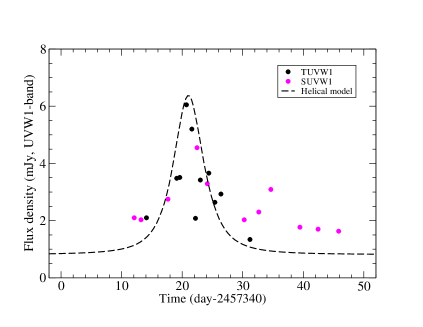
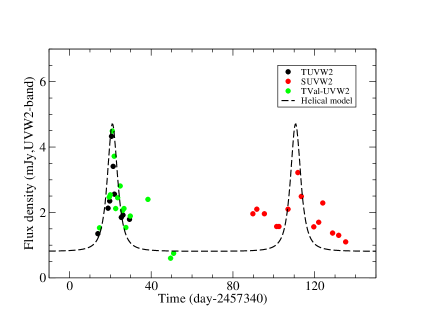
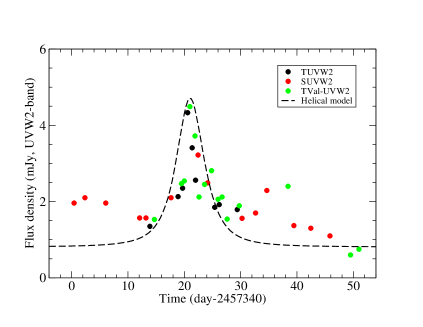
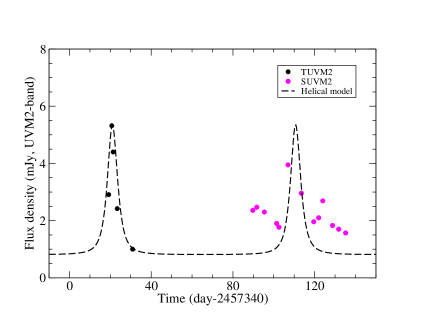
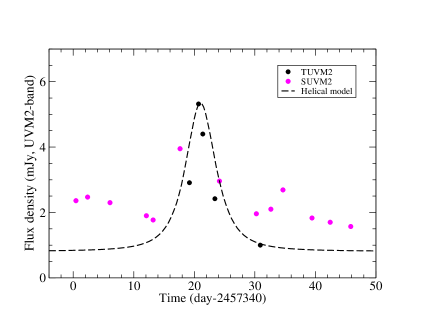
The model simulation results of the UVW1-, UVW2- and UVM2-band light curves for the outbursts in December/2015 and in March/2016 are shown in Figure 9. It can be seen that the light curves observed at the three bands for both outbursts were well fitted by the helical motion model. Thus the outburst in December/2015 has its variability behavior very similar to that of the synchrotron outburst in March/2016 in the UV-bands. But it should be noticed that rapid (intraday) variability due to interstellar scintillation (or extinction) or turbulent fluctuations in optical knots (Qian et al. 1991b , Marscher et al. Ma08 (2008), Marscher Ma14 (2014)) might cause scattering of the observational data-points.
Based on the model simulation of the multi-wavelength light curves for the periodic outburst in December/2015 and the non-periodic synchrotron outburst in March/2016 as shown in Figure 4 – 9, we come to the conclusion that the December/2015 outburst, which was claimed to be a bremsstrahlung flare, has its variability behavior (both temporary and spectral) very similar to the synchrotron flare in March/2016: both have similar peaking flux densities and spectral features, and their flux density curves having symmetric profiles with similar rising and decaying time-scales. This would imply that the December/2015 outburst may also be a synchrotron flare.
4 Light curve structure of periodic optical outbursts
As argued in the previous section, the symmetry in the optical light curves
and the similarity between the periodic and non-periodic optical outbursts
may be important for understanding the optical variations in OJ287. In order
to further investigate this behavior and clarify the nature of the phenomena
in OJ287, we will make model simulation of the light curves for the five
periodic optical outbursts observed in 1983.00, 1984.10, 1994.75, 2005.76
and 2007.70, and show that their light curves can be decomposed into a
number of subflares (or elementary flares) with symmetric profiles.
In addition, we will make model simulation for some well-resolved
(or isolated) non-periodic optical bursts to reveal the similarity
in optical variations between the periodic outbursts
(claimed as thermal flares)
and non-periodic outbursts (recognized as synchrotron flares).
In combination with the results presented in Sect.3 for the
December/2015 and
March/2016 outbursts, it can be seen that the consistency in the
variability behavior of all these outbursts provides
important clues for understanding the
nature of their emission, affording persuasive evidence that the entire
phenomena observed in blazar OJ287 may be caused by lighthouse effect
due to the helical motion of superluminal
optical knots (plasmons or shocks) within the relativistic jet.
| Flare | (mJy) |
|---|---|
| 1983.00 | 5.0 |
| 1984.10 | 2.8 |
| 1994.75 | 1.0 |
| 2005.76 | 2.0 |
| 2007.70 | 5.5 |
| 2015.87 | 3.5 |
For simplicity and easy comparison, we will apply the same approaches as used in Sect.3 to make model simulation of the light curves for the five periodic outbursts. The outbursts are assumed to be composed of two components: the underlying jet emission (or base-level component) and the flaring component. The base-level component can be taken to be constant during individual outbursts, but may change on longer time-scales due to the jet precession and intrinsic variations in the underlying jet (jet-parameters and bulk Lorentz factor). For the six periodic outbursts simulated, the base-level flux densities (at V-band) are listed in Table 5.
4.1 Periodic optical outburst in 1983.00
The outburst in 1983.00 is the first optical flare of the 1983 – 1984
double-peaked outbursts.
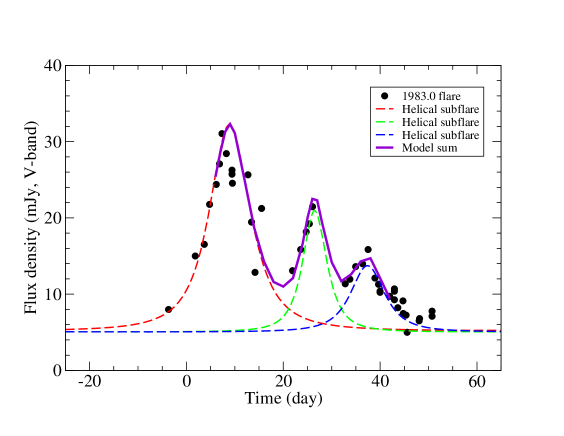
The simulation results for the 1983.00 periodic outburst are shown in
Figure 10. Its total flux density curve has
been decomposed into three subflares. The first flare was identified
as the “impact (thermal) outburst”. Obviously, its light curve does not
have the “standard shape” expected for impact outbursts. It looks like
a single elementary flare and its light-curve can be very well fitted
with a symmetric profile in terms of the helical motion
(or lighthouse) model. Similarly, the light-curves of the other two
subflares can also be well fitted. The model parameters
for the three subflares are given in Table 6.
| t | ratio | FWHM | |||
|---|---|---|---|---|---|
| 9 | 8.0 | 15.90 | 3.20 | 4.27 | 10.0 |
| 26 | 9.5 | 18.84 | 4.10 | 1.26 | 5.1 |
| 37 | 8.5 | 16.89 | 3.49 | 1.07 | 7.1 |
| t | ratio | FWHM | |||
|---|---|---|---|---|---|
| 48 | 7.5 | 14.90 | 2.93 | 3.44 | 12 |
| 67 | 10.0 | 19.9 | 4.45 | 5.93 | 5 |
4.2 Periodic optical outburst in 1984.10
Interestingly, the second optical flare of the 1983 – 1984 double-peaked outbursts (during 1984.1–1984.3; see Fig.6 in Valtaoja et al. Val20 (2000)) clearly exhibits its structure consisting of two rather separated outbursts peaking at 1984.18 and 1984.23 , respectively. As like the 1983.00 outburst the major flare (peaking at 1984.18 with peak flux=20 mJy at V-band) is a single elementary one and its flux density curve can be very well simulated by a symmetric profile and is displayed in Figure 11. The relevant model parameters for the two subflares are listed in Table 7. Thus for the 1983 – 1984 double-peaked outbursts, both the major flares exhibit the symmetry in their light curves. As discussed below, the major flares of the outbursts in 2007.70 and 2015.87 (Figs.15 and 16) also reveal this characteristic feature. Symmetry in the optical outburst light curves can not be explained in terms of the disk-impact scenario, where the flux density curves of “impact outbursts” emitted from evolving gas-bubbles would have a non-symmetric pattern with a rapid rising and slower decaying phases.
4.3 Periodic optical outburst in 1994.75
The 1994–1996 periodic double-peaked outbursts were intensively monitored
via international cooperation of the “OJ-94 project” (Takalo
1996a , Takalo et al. 1996b ), starting at 1994.75
and 1995.84, respectively. During this period the optical flares
may be related to the ejection of superluminal radio (15 GHz)
components C1, C2, C3 and C4 (Britzen et al. Br18 (2018),
Qian QiXiv18 (2018), Tateyama et al. Ta99 (1999)).
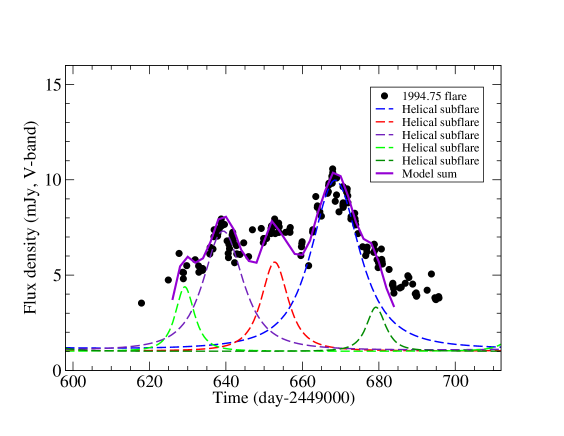
The simulation results for the first outburst in 1994.75
131313In Lehto & Valtonen (Le96 (1996)) and Valtonen & Lehto
(Va97 (1997)) this outburst was identified as the ”disk-impact
thermal outburst”. Recently Dey et al. (De18 (2018)) suggested that
its starting time should be changed to 1994.60 and the corresponding ”impact
outburst” was missed due to lack of monitoring observations.
(peaking at 1994.86) are shown in Figure 12. The observational
data are taken from Sillanpää et al. (1996a ,
OJ-94 project; private communication). Its total flux density curve has been
decomposed into five subflares simulated with symmetric profiles.
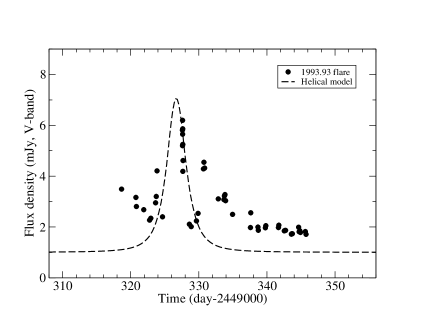
Two rather isolated moderate outbursts peaking at JD2449326
and 2449415 were also model simulated and the results are shown in
Figure 13. The relevant model parameters are described in Table 8.
The successful simulation of the light curve for the 1994.75 outburst
might have demonstrated that any complex outburst observed in OJ287
can be decomposed into a few elementary flares and explained
in terms of the proposed helical motion (or lighthouse) model.
4.4 Periodic optical outburst in 1995.84
The outburst starting at 1995.84 was the second one of the
1994 – 1996 double-peaked outbursts. Its light curve exhibits a
complex structure, showing some distinct features which may be
meaningful for understanding the phenomena in OJ287 (Valtaoja et al.
Val20 (2000)).
Firstly, the “impact flare” (during 1995.84–1995.90) identified by the
disk-impact model (Dey et al. De18 (2018)) was a small one with its
peak flux density 5 mJy, much weaker than the follow-up flares
with peak flux of 12 mJy (Valtaoja et al. Val20 (2000)). This
would pose a problem: why a strong disk impact
141414According to the disk-impact model (Dey et al. De18 (2018)),
the 1995.84 outburst occurred at a distance of 3800 AU from
the primary hole and should be produced by a strong impact of the secondary
hole onto the primary disk. could only produce a small “thermal”
optical flare, but resulted in the production of strong follow-up
synchrotron flares. Obviously, it seems that some other physical processes
would have played their roles.
Secondly, it is noticed that the 1995.84 flaring event (during
1995.84 – 1996.12) had its light curve very
similar to that of the 1994.75 outburst and could also be
decomposed into a number of subbursts simulated with symmetric profiles.
The symmetry of this double-peaked outbursts was
firstly discovered by Sillanpää et al. (1996b ), which
essentially reflects the symmetry existing in the light curves of
their subbursts with similar rising and declining time-scales.
Thus both the double-peaked outbursts during 1994 – 1996 period
can be interpreted in terms of our helical motion (lighthouse) model.
151515Due to lack
of relevant data the 1995.84 outburst was not simulated in this work.
Thirdly, the most interesting feature of the 1995.84 outburst may be
the close connection between the radio and optical variations.
According to Valtaoja et al. (Val20 (2000), Fig.8 therein), its radio
variations at 22/37 GHz were very similar to the V-band optical
variations: both variations are not only simultaneous but also
have similar envelopes. Even a few radio emission peaks can be
recognized to be concurrent with the optical peaks. This strict
simultaneity of the radio and optical variability seems important
and may have provided some significant clues to the physical processes
producing the radio/optical outbursts in OJ287. Unfortunately, this
radio-optical connection has not been explained since its discovery.
In combination with the model simulation of the light curves for the
December/2015 and March/2016 outbursts in Sect.3, we would come to the
conclusion that this close connection between the radio and optical
variability can not be explained in terms of disk-impact scenario and
shock-in-jet models, and can only be explained in terms of
lighthouse effect due to the helical motion of superluminal knots, but
requiring some special structure of the emitting source.
| ratio | FWHM | ||||
| 325 | 11.5 | 22.83 | 5.57 | 2.23 | 3.3 |
| 415 | 11.3 | 22.44 | 5.41 | 2.22 | 3.3 |
| 630 | 9.5 | 18.88 | 4.11 | 2.67 | 5.7 |
| 640 | 7.5 | 14.90 | 2.93 | 1.28 | 11.6 |
| 650 | 8.5 | 16.89 | 3.49 | 5.75 | 8.2 |
| 670 | 7.0 | 13.90 | 2.68 | 2.41 | 14.8 |
| 680 | 9.5 | 18.88 | 4.11 | 1.83 | 5.8 |
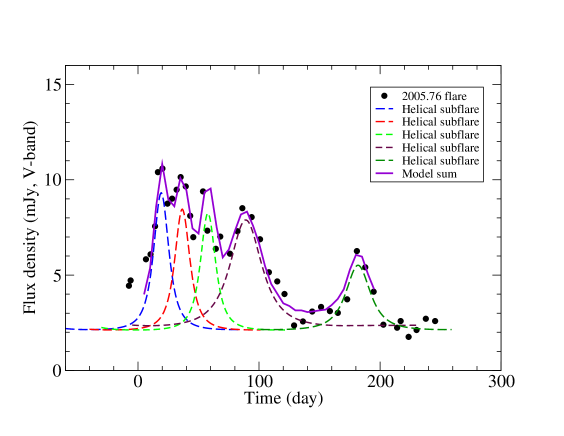
4.5 Periodic optical outburst in 2005.76
The double-peaked outbursts during the period of 2005–2007 were
extensively observed by Valtonen et al. (Va08 (2008)) and Villforth et al.
(Vil10 (2010)). The ejection of superluminal radio components C11, C12,
C13L, C13U and C14 (Qian QiXiv18 (2018)) may be connected with these
optical flaring events.
The simulation results for the light curve of the first
outburst starting in 2005.76161616It was identified as the “impact
(bremsstrahlung) flare” by Valtonen et al. (Va08 (2008)). are shown
in Figure 14. Its total flux density curve has been decomposed into
five subflares, which are well simulated with symmetric profiles in terms
of the lighthouse model. The model parameters are given in Table 9.
According to the
disk-impact model, the 2005.76 and 1994.75 outbursts occur at
quite different distances (Dey et al. De18 (2018)):
12,000AU (with the secondary-hole velocity of 0.17c) and
7,000AU (with the secondary-hole velocity of 0.10c),
respectively. As shown in Fig.14
and in Fig.12, while their light curves have similar multi-component
structures, the peak flux density of the 2005.76 outburst (9.0 mJy)
is much higher than that of the 1994.75 outburst (5.0 mJy).
This is inconsistent with the prediction of the disk-impact model:
the strength of periodic optical outbursts is mainly dependent on
the impact-distance
and the secondary-hole velocity. It seems that some other
ingredients could exist to determine the strength of
the flaring activity, e.g., variations in the circumbinary disk
and accretion rates onto the binary holes.
| ratio | FWHM | ||||
|---|---|---|---|---|---|
| 20 | 7.0 | 13.90 | 2.68 | 1.81 | 14.6 |
| 37 | 7.0 | 13.90 | 2.68 | 1.73 | 14.6 |
| 58 | 7.0 | 13.90 | 2.68 | 1.63 | 14.6 |
| 90 | 5.5 | 10.89 | 2.03 | 4.18 | 31.7 |
| 182 | 6.0 | 11.90 | 2.23 | 1.76 | 25.8 |
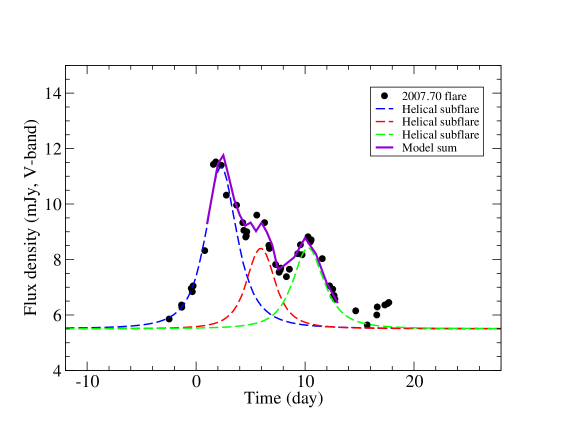
4.6 Periodic optical outburst in 2007.70
The outburst starting at 2007.70 is the second flare of the double-peaked
outbursts during 2005 – 2007 period.
The model simulation results for this periodic optical outburst
are shown in Figure 15.171717The whole outburst was observed at
R-band by Villforth et al. (Vil10 (2010)) during
September/2007 – February/2008.
Its entire light curve comprises of at least seven individual subflares,
overlapping on each other and forming a very complex structure with a time
scale of about five months. The optical flare
discussed here is the first one which was identified as the “impact
(bremsstrahlung) flare” by Valtonen et al. (Va08 (2008)).
Its total flux density curve has been decomposed into three subbursts
which are all well simulated with symmetric profiles in terms of the
lighthouse model. The model parameters are
given in Table 9. Although the declining part of the major outburst
is mixed with the rising part of the secondary burst, its rising-peaking
part still clearly demonstrates the trend of its symmetric profile.
In combination with the results given in Sect. 4.5, we found that
the total
flux density curves of both periodic outbursts (in 2005.76 and 2007.70)
can be well interpreted in terms of the lighthouse model with
symmetric profiles.
It can be seen from Figures 14 and 15 (also see Tables 9 and 10)
that the subflares of 2005.76 outburst
all have timescales much longer than those for the subflares of 2007.70
outburst, this might be related to their different impact distances
as expected by the disk-impact model:
the 2005.76 outburst occurred at 12,000 AU and the 2007.70 outburst
at only 3,000 AU. However, the peak flux density of the 2005.76
outburst (9.0 mJy) is much higher than that of the 2007.70
outburst (6.5 mJy), which seems inconsistent with the expectation
of this model.
| Ratio | FWHM | ||||
|---|---|---|---|---|---|
| 2 | 11.4 | 22.64 | 5.49 | 2.22 | 3.4 |
| 6 | 12.0 | 23.82 | 5.97 | 9.00 | 3.0 |
| 10 | 11.4 | 22.64 | 5.49 | 1.12 | 3.4 |
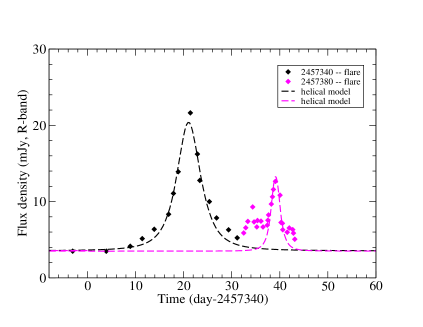
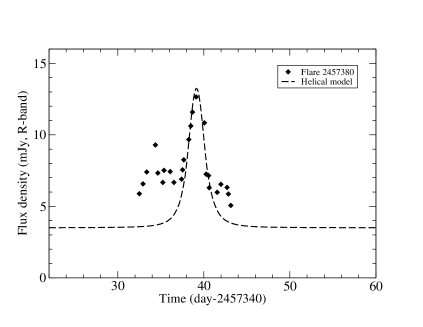
4.7 Periodic optical outburst in 2015.87
In Sect.3 we have presented the model simulation results of the
multi-wavelength light curves for the major periodic optical outburst in
December/2015 (peaking at JD2457360) and shown that its multi-wavelength
light curves all have symmetric profiles and can
be interpreted in terms of light-house effect
due to the helical motion of a superluminal optical knot. Here we present
the model simulation of the light curve (at R-band) for an isolated optical
flare peaking at JD2457380 (Valtonen et al. Va16 (2016)), which is
shown in Figure 16 (left panel). For comparison, the modeled light curve
for the major outburst is also displayed (right panel). The model
parameters are given in Table 11.
It can be seen from Figure 16 and Table 11 that the isolated non-periodic
outburst
peaking at JD2457380 has a symmetric light curve similar to that of
the December/2015 outburst and both can be well fitted by the helical
motion model but with different bulk
Lorentz factors: =13.5 for the non-periodic flare and =9.5
for the major outburst. It should be noted that the non-periodic flare
(peaking at JD2457380) is a non-thermal (synchrotron) flare with
polarization degree of 40% (Valtonen et al. Va17 (2017)).
Therefore, the similarity in the light curve patterns between the
December/2015 outburst and this non-thermal flare 181818This non-thermal
flare appeared at JD2457380, only 20 days after the appearance of the
December/2015 outburst.further prove the suggestion that
the December/2015 outburst may originate from synchrotron process.
In addition, we notice that the December/2015 outburst has its light curve
structure similar to that of the 1984.10 outburst (Figures 11 and 16) and
they have similar strengths: peak flux density of 14.5 mJy
for the December/2015 outburst and 17.2mJy for the 1984.10 outburst.
This seems in contradiction with the expectation of the disk-impact model.
According to the
disk-impact model, the December/2015 outburst should be
much weaker than the 1984.10 outburst, because it appeared at
impact-distance of 18,000 AU much farther than the 1984.10
outburst (at impact distance of 5,000 AU).
This seems to demonstrate that there may exist some additional ingredients
(or processes) which determine the strength of the outbursts, e.g.,
variations in the circumbinary disk and the disks of the binary holes.
| ratio | FWHM | ||||
|---|---|---|---|---|---|
| 360 | 9.5 | 18.88 | 4.11 | 1.33 | 5.9 |
| 380 | 13.5 | 26.77 | 7.29 | 1.67 | 2.2 |
5 Discussion
We have applied the precessing jet nozzle model previously proposed by
Qian et al. (e.g., 1991a , Qi13 (2013), Qi19 (2019))
to investigate the optical variations observed in OJ287 and tried to
clarify the nature of emission for the outbursts.
It is found that the multi-wavelength variations (in NIR-optical-UV bands;
Kushwaha et al. Ku18 (2018)) of the periodic major outburst in
December/2015 (peaking at JD2457360) are
very similar to those of the non-periodic highly-polarized synchrotron
outburst in March/2016 (peaking at JD2457450). The multi-wavelength
light curves of both the outbursts can be well simulated by symmetric
profiles and interpreted in terms of lighthouse effect due to the helical
motion of one superluminal optical knot through two helical revolutions.
This result seems important, indicating that the December/2015 outburst
may like the March/2016 outburst and also originate from synchrotron
process.
191919The December/2105 outburst was identified as
the “impact (bremsstrahlung) flare” according to the disk-impact model.
Its association with the simultaneous -ray flare supports this
interpretation.
The five periodic outbursts observed in 1983.00, 1984.10,
1994.75, 2005.76 and 2007.70 (at V-band), and a few isolated
non-periodic flares
have also been simulated. We find that all the periodic outbursts can be
decomposed into a number of subbursts (or “elementary flares”).
The light curves of all these elementary flares can be simulated by
symmetric profiles with similar rising and decaying time-scales and and
interpreted in terms of the lighthouse model. The isolated non-periodic
flares show their variability behavior similar to these elementary
flares.
In combination with the simulation results for the December/2015
and March/2016, we tentatively suggest that the periodic optical
outbursts observed during 1983 – 2015 may all originate from synchrotron
process in the relativistic jet and they may be produced by lighthouse
effect due to the helical motion of superluminal optical knots
(blobs or shocks). This interpretation is consistent with
the requirement of “single mechanism”, which is derived from the color
stability during the optical outbursts (Sillanpää et al. 1996a ,
Gupta et al. Gu16 (2016)). The low polarization of the first flares of
the double-peaked outbursts can also be understood, because synchrotron
flares can have a large range of polarization degree, as typically
observed in OJ287 (from 2% to 40%
(Villforth et al. Vil10 (2010), Kushwaha et al. Ku18 (2018)). The
close connection between the radio/mm and optical variations
(e.g., observed in the 1995.84 outburst) can also be explained.
We have shown that the entire optical variability in OJ287 could only be
explained by invoking lighthouse effect due to the helical motion
of superluminal optical knots. This result may have been expected, based
on the magnetohydrodynamical (MHD) theories for jet formation in spinning
black hole – accretion disk systems, in which relativistic jets are
produced in the rotating magnetospheres with strong toroidal magnetic
fields and strong helical fields should be permeated in the jets near the
black holes (e.g., Blandford & Znajek Bl77 (1977), Blandford & Payne
Bl82 (1982), Camenzind Cam90 (1990), Li et al. Lizy92 (1992), Beskin
Be10 (2010), Valhakis & Königl Vl04 (2004), Meier Mei13 (2013),
Mei01 (2001)). It would be a natural phenomenon that superluminal optical
knots move along helical trajectories, producing optical outbursts through
lighthouse effect. Unfortunately, there seems only a few observational events
revealing this phenomenon (e.g., Schramm et al. Sc93 (1993), Dreissigacker
1996a , Dreissigacker & Camenzind 1996b , Camenzind &
Kronkberger Cam92 (1992), Wagner et al. Wa95 (1995), Qian Qi15 (2015)). This
work demonstrates that helical motion of superluminal optical components
may be a general phenomenon in blazar OJ287 and thus provide some
observational evidence for the existence of helical magnetic fields in the
inner jet regions of blazars.
Under the binary black hole scenario, we have tentatively proposed
a unified and plausible relativistic jet
model for fully explaining the optical activities in OJ287 (including its
periodic and non-periodic outbursts), invoking lighthouse effect due
to the helical motion of superluminal optical components. The chain of the
physical processes in this model may be: a succession of discrete accretion
events (including the double-stream accretion flows; e.g.,
Tanaka Tan13 (2013) ) created by the pericenter passages of the secondary
hole (moving in an eccentric orbit) results in a succession of ejection
of superluminal optical components through the jet formation mechanism,
producing a succession of the elementary optical flares which blend
together to form major complex outbursts.
The relativistic jet model tentatively suggested in this work
should be tested by the future multi-wavelength (from radio to
-rays) observations. If this scenario is proved to be correct, the
optical phenomena in OJ287 can be explained without needing to invoke the
disk-impact mechanism, although this mechanism seems
very attractive for testing the efffects of general relativity
(Einstein Ei16 (1916), Ei18 (1918)). However, the relativistic jet
scenario only concentrates on the
explanation of the nature and characteristics of the optical activities
(temporary and spectral variations of the outbursts), the quasi-periodicity
of its optical variability and the double-structure of the periodic
outbursts remain to be interpreted. In principle, under the framework of
binary black hole models, the quasi-periodicity can be related to the
modulation of accretion rates via the pericenter passages of the
companion black hole in an eccentric orbit. As Sillanpää et al.
(1996a ) originally suggested, the eccentric orbital motion
of the secondary hole can cause quasi-periodically enhanced accretion
flows onto the primary hole, which consequently result in ejections
of superluminal optical knots via jet-formation mechanism(s), producing
quasi-periodic optical outbursts. As regards the explanation of the
double-structure of periodic optical outbursts, cavity-accretion models
as suggested by Tanaka (Tan13 (2013)) might be applicable. In the case
of comparable-mass and eccentric binary systems, usually two gas streams
are created per pericenter passage of the secondary hole
in the circumbinary disk and flow toward the binary black holes,
producing a double-peaked outbursts. The cavity-accretion processes
(dynamics and kinematics of the streams) might be quasi-regular, because
the two streams would have to move across the Lagrange points of the binary
system (e.g., Artymowicz & Lubow Ar96 (1996), Artymowicz Ar98 (1998),
Tanaka Tan13 (2013)). However, in the case of cavity-accretion in binary
systems, complex processes are involved: e.g., eccentric
motion of the binary around the mass-center, interaction between the
binary and the circumbinary disk, creation of the pair of gas streams,
jet formation, precession and ejection of superluminal
components in binary systems, etc. Thus it seems that cavity-accretion
models can not
accurately predict the appearing times of the periodic optical outbursts,
because the timing of the periodic outbursts are not determined by the
orbital motion only. Stochasticity in the circumbinary disk accretion
and in the dynamics and kinematics of the stream flows could result in
some scattering of the appearing times of the double-peaked outbursts.
In fact, even in the disk-impact model (Lehto & Valtonen Le96 (1996),
Dey et al. De18 (2018)) where the outburst timing is assumed to
mainly depend on the orbital motion, the strength of the double-peaked
outbursts seems not closely related to the orbital phases
(or outburst timing). In Table 12
the relation between the peak flux densities of the impact outbursts and
their impact distances (and secondary hole velocities) are listed,
which does not demonstrate any connection between these parameters:
strong outbursts do not necessarily appear at small impact distances.
This seems that some significant physical processes might have been missed
for determining the strength of the periodic outbursts.
In the relativistic jet model proposed in this work, the quasi-periodicity
in optical variability and the double-peak structure can be ascribed to
the accretion processes in binary systems. In the cavity-accretion models,
the modulation of the accretion rate onto the binary holes and their
disks by the orbital period might be the most plausible mechanism for
explaining the quasi-periodicity of the optical variability observed in
OJ287. Moreover, the two streams of accretion flows created per
pericenter passages of the secondary hole may be invoked to explain
the double-peak structure of the periodic outbursts. The timing
mechanism for the periodic outbursts could be investigated along with
the appearance of non-periodic outbursts. Detailed modeling
based on HD/MHD simulations is imperatively required.
| (AU) | /c | (mJy) | (mJy) | |
|---|---|---|---|---|
| 2007.70 | 3259 | 0.264 | 12.0 | 6.5 |
| 1995.84 | 3855 | 0.245 | 5.0 | 3.5 |
| 1983.00 | 4633 | 0.224 | 32.0 | 27.0 |
| 1984.10 | 5387 | 0.205 | 20.0 | 17.2 |
| 1994.75 | 7079 | 0.173 | 6.0 | 5.0 |
| 2005.76 | 12427 | 0.106 | 11.0 | 9.0 |
| 2015.87 | 17566 | 0.058 | 18.0 | 14.5 |
Acknowledgements.
I wish to thank Prof. A. Sillanpää for affording the V-band data on OJ287 during 1993.9 – 1995.3 (OJ-94 project), which was very helpful to this work.References
- (1) Ackermann M., Ajello M., Allafort A., et al., 2011, ApJ 743, 171
- (2) Agudo, I., Marscher, A.P., Jorstad, S.G., et al. 2012, ApJ, 747, 63
- (3) Aller, M.D., Aller, H.D., Hughes, P.A. 1994, in: Workshop on Intensive Monitoring of OJ287, Tuorla Obs. Rep. Informo 174, ed. M.R. Kidger & L.O. Takalo (Turku: Univ. Turku), 60
- (4) Aller, M.F., Hughes, P.A., Aller, H.D., et al. 2014, ApJ, 791, 53
- (5) Artymowicz, P., Lubow, S.H. 1996, ApJ, 467, L77
- (6) Artymowicz, P. 1998, in: Theory of Black Hole Accretion Disks, ed. M.A. Abramowicz, G. Björnsson, J.E. Pringle, p202
- (7) Beskin, V.C. 2010, Physics-Uspekhi, 53, 1199
- (8) Blandford, R.D., & Znajek, R.L. 1977, MNRAS, 179, 433
- (9) Blandford, R.D., Königl A., 1979, ApJ 232, 34
- (10) Blandford, R.D., & Payne, D.G. 1982, MNRAS, 199, 883
- (11) Bregman, J.N., Glassgold, A.E., Huggins, P.J., et al. 1986, ApJ, 301, 708
- (12) Britzen, S., Fendt, C., Witzel, G., Qian, S.J., et al. 2018, MNRAS, 478, 3199
- (13) Brown, L.M.J., Robson, E.I., Gear, W.K., Smith, M.G. 1989a, ApJ, 340, 129
- (14) Brown, L.M.J., Robson, E.I., Gear, W.K., Smith, M.G. 1989b, ApJ, 340, 150
- (15) Camenzind, M. 1990, Reviews in Modern Astronomy, Vol.3, 234
- (16) Camenzind, M. & Krockenberger, M. 1992, A&A, 255, 59
- (17) Cohen, M.H. 2017, Galaxies, 5, 12
- (18) Dey, L., Valtonen, M.J., Gopakumar, A., et al. 2018, ApJ, 866, 11D
- (19) Dreissigacker, O. 1996a, in: Extragalactic Radio Sources, eds., R. Ekers et al., p421
- (20) Dreissigacker, O & Camenzind, M. 1996b, in: Blazar Continuum Variability (ASP Conference Series, eds. H.R. Miller, J.R. Webb, and J.C. Noble), Vol.110, p377
- (21) Einstein, A. 1916, Sitzungberichte der Königlich Presssichen Akademie der Wissenshafte (SPAW, Berlin), 688
- (22) Einstein, A. 1918, Sitzungberichte der Königlich Presssichen Akademi der Wissenshafte (SPAW, Berlin), 154
- (23) Gabuzda, D.C., Murry, A., Cronin, P. 2004, MNRAS, 351, L89
- (24) Gabuzda D.C., Knuettel, S., Reardon, B. 2015, MNRAS, 405, 2441
- (25) Gear, W.K., Robson, E.I., Ade, P.A.R., et al. 1985, ApJ, 291, 511
- (26) Ghisellini, G., Foschini, L., Tavecchio, F., Pian, E. 2007, MNRAS, 382, L82
- (27) Gupta, S.P., Pandey, U.S., Singh, K., et al. 2012 , New Astron. 17, 8
- (28) Gupta, A.C., Agarwal, A., Mishra, A., et al. 2016, MNRAS, 458, 1127
- (29) Hartman, R.C., Bertsch, D.L., Bloom, S.D., et al.1999, ApJS, 123, 79
- (30) Hayasaki, K., Mineshige, S. & Ho, L.C. 2008, ApJ, 682, 1134
- (31) Hodgson, J.A., Krichbaum, T.P., Marscher, A.P., et al. 2017, A&A, 597, 80
- (32) Hogg, D.W. 1999, astro-ph/9905116
- (33) Kardashev, N.S. 1962, Astron. Zh., 39, 393
- (34) Komatsu, E., Dunkley, J., Nolta, M.R., et al. 2009, ApJS, 180, 330
- (35) Kushwaha, P., Sahayanathan, S., Singh, K.P. 2013, MNRAS, 433, 2380
- (36) Kushwaha, P., Gupta, A.C., Wiita, P.J., et al. 2018, MNRAS, 473, 1145
- (37) Lehto, H.J., & Valtonen, M.J. 1996, ApJ, 460, 207
- (38) Li, Z.Y., Chiueh, T.H., Begelman, M.C. 1992, ApJ, 394, 459
- (39) Litchfield, S.J., Stevens, J.A., Robson, E.I. & Gear, W.K. 1995, MNRAS, 274, 221
- (40) Marscher, A.P. & Gear, W.K. 1985, ApJ, 298, 114
- (41) Marscher A.P., Jorstad, S.G., D’Arcangelo, F. D., et al. 2008, Nature, 452, 966
- (42) Marscher A.P., 2014, ApJ, 780, 87
- (43) Meier, D.L., Koide, S., Uchida, Y. 2001, Science, Vol.291, 84
- (44) Meier, D.L. 2013, EPJ Web of Conference 61, 01001
- (45) Melrose D.B., 1994, in The Physics of Active Galaxies: The First Stromlo Symposium, ASP Conference Series, vol. 54, p91
- (46) Ostorero, L., Villata, M., Raiteri, C.M. 2004, A&A, 419, 913
- (47) Pacholczyk, A.G. 1970, Radio Astrophysics (Freeman & Co., San Franciso)
- (48) Qian, S.J. 1978, Publications of Beijing Observatory (in Chinese), No.14, 1
- (49) Qian, S.J., Witzel, A., Krichbaum, T.P., et al. 1991a, Acta Astron. Sin., 32, 369 (english translation: in Chin. Astron. Astrophys., 16, 137 (1992))
- (50) Qian, S.J., Quirrenbach, A., Witzel, A., et al. 1991b, A&A, 241, 15
- (51) Qian, S.J. 1996a, ChA&A, 20, 281
- (52) Qian, S.J. 1996b, ChA&A, 20, 137
- (53) Qian, S.J. 1997, Acta Astron. Sin., 38, 239
- (54) Qian, S.J., Zhang, X.Z., Witzel, A., et al. 1998a, Chin. Astron. Astrophys., 22, 155
- (55) Qian, S.J., Zhang, X.Z., Britzen, S., et al. 1998b, Chin. Astron. Astrophys. 22, 409
- (56) Qian, S.J. 2013, Res. Astron. Astrophys., 13, 783
- (57) Qian, S.J., Witzel, A., Zensus, J.A., et al. 2009, Res. Astron. Astrophys., 9, 137
- (58) Qian, S.J., Krichbaum, T.P., Witzel, A., et al., 2010, Res. Astron. Astrophys., 10, 47
- (59) Qian,S.J. 2011, Res. Astron, Astrophys., 11, 43
- (60) Qian,S.J. 2012, Res. Astron. Astrophys., 12, 46
- (61) Qian, S.J., Britzen, S., Witzel, A., et al. 2014, Res. Astron. Astropys., 14, 429
- (62) Qian, S.J. 2015, Res. Astron. Astrophys., 15, 687
- (63) Qian, S.J. 2016, Res. Astron. Astrophys., 16, 20
- (64) Qian, S.J., Britzen, S., Witzel, A., et al. 2017, A&A, 604, A90
- (65) Qian S.J., Britzen, S., Witzel A., et al. 2018, A&A, 615, A123
- (66) Qian, S.J., Britzen, S., Krichbaum, T.P., Witzel, A. 2019, A&A, 612, A11
- (67) Qian, S.J., 2018, arXiv:1811.11514
- (68) Raiteri C.M.,Villata M., Larionov V.M., et al., 2007, A&A 473, 819
- (69) Raiteri, C.M., Villata, M., Kadler, M., et al. 2006, A&A, 452, 845
- (70) Raiteri, C.M., Villata, M., Ibrahimov, M.A., et al. 2005, A&A, 438, 39
- (71) Sahayanathan, S., Misra, R., Kembhavi, S.K. & Kaul, C.L. 2003, ApJ, 588, L77
- (72) Schramm K.-J., Borgeest U., Camenzind M.,et al., 1993, A&A, 278, 391
- (73) Seta, H., Isobe, N., Tashiro, M., et al. 2009, PASJ, 61, 1011
- (74) Sillanpää, A., Haarala, S., Valtonen, M.J., et al. 1988, ApJ, 325, 628
- (75) Sillanpää, A., Takalo, L.O., Pursimo, T., et al. 1996a, A&A, 315, L13
- (76) Sillanpää, A., Takalo, L.O., Pursimo, T., et al. 1996b, ASP conference series, Vol. 110 (Blazar Continuum Variability), eds. H.R. Miller, J.R. Webb and J.C. Noble, p74
- (77) Spergel, D.N., Verde, L., Peiris, H.V., et al. 2003, ApJS, 148, 175
- (78) Takalo, L.O. 1996a, ASP Conference Series, Vol.110 (Blazar Continuum Variability), eds., H.R. Miller, J.R. Webb and J.C. Noble, p70
- (79) Takalo, L.O., Sillanpää, A., Lehto, H.J. 1996b, Mem.S.A.It., 67, 545
- (80) Tanaka, T.L. 2013, MNRAS, 434, 2275
- (81) Tateyama, C.E., Kingham, K.A., Kayfmann, P., et al. 1999, ApJ, 520, 627
- (82) Valtaoja, E.,Haarala, S., Lehto, H., et al., et al. 1988, A&A, 203, 1
- (83) Valtaoja, E., Teräsranta, H., Urpo, S., et al. 1992, A&A, 254, 71
- (84) Valtaoja, E., Terasranta, H., Tornikoski, M., et al. 2000, ApJ, 531, 744
- (85) Valtonen, M.J. & Lehto, H.J. 1997, ApJ, 481, L5
- (86) Valtonen, M.J., Lehto, H.J., Sillanpää, A., et al. 2006, ApJ, 646, 36
- (87) Valtonen, M.J. 2007, ApJ, 659, 1074
- (88) Valtonen, M.J., Lehto, J.H., Nilsson, K., et al. 2008, Nat., 452, 851
- (89) Valtonen, M.J., Mikkola, S., Lehto, H.J., et al. 2011, ApJ, 742, 22
- (90) Valtonen, M.J., Ciprini, S., Lehto, M.J. 2012, MNRAS, 427, 77
- (91) Valtonen, M.J., Ciprini, S. 2012, Mem.S.A.It., 83, 219
- (92) Valtonen, M.J., Dey, L., Hudec, R., et al. 2018, in: Gravitational Waves Astrophysics: Early Results from Gravitational Wave Searches and Electromagnetic Counterparts. Proceedings of IAU Symposium, Vol.338, 29
- (93) Valtonen, M.J., Zola, S., Ciprini, S., et al., 2016, ApJL, 819, L37
- (94) Valtonen, M.L., Zola, S., Jermak, H., et al. 2017, Galaxies, 5, 83
- (95) Vercellone, S., D’Ammando,F., Vittorini,V. et al. 2010, ApJ, 712, 405
- (96) Vercellone, S. 2012, 2011 Fermi Symposium Proceedings-eConfC110509
- (97) Villata, M., Raiteri, C.M., Sillanpää, A., et al. 1998, MNRAS 293, L13
- (98) Villata, M., Raiteri, C.M., Kurtanidze, O.M., et al. 2002, A&A, 390, 407
- (99) Villata, M., Raiteri, C.M., Kurtanidze, O.M., et al. 2004, A&A, 421, 103
- (100) Villforth, C., Nilsson, K., Heidt, J., et al. 2010, MNRAS, 402, 2087
- (101) Vlahakis, N., & Königl, A. 2004, ApJ, 605, 656
- (102) Wagner S.J., Camenzind M., Dreissigacker O., et al., 1995, A&A, 298, 688