High-temperature ferroelectric order and magnetic field-cooled effect driven magnetoelectric coupling in R2BaCuO5 (R= Er, Dy, Sm)
Abstract
The high-temperature ferroelectric order and a remarkable magnetoelectric effect driven by the magnetic field cooling are reported in R2BaCuO5 (R = Er, Dy, Sm) series. The ferroelectric (FE) orders are observed at much higher temperatures than their magnetic orders for all three members. The value of FE Curie temperature () is considerably high as 235 K with the polarization value () of 1410 C/m2 for a 4 kV/cm poling field in case of Er2BaCuO5, whereas the values of and are also promising as 232 K and 992 C/m2 for Dy2BaCuO5, and 184 K and 980 C/m2 for Sm2BaCuO5. The synchrotron diffraction studies of Dy2BaCuO5 confirm a structural transition at to a polar structure, which correlates the FE order. An unusual magnetoelectric coupling is observed below the R order for Er and Dy compounds and below the Cu order for Sm compound, when the pyroelectric current is recorded only with the magnetic field both in heating and cooling cycles i.e. typical magnetic field cooled effect. The magnetic field cooled effect driven emergence of polarization is ferroelectric in nature, as it reverses due to the opposite poling field. The unexplored R2BaCuO5 series attracts the community for large , high value, and strange magnetoelectric consequences.
pacs:
75.85.+t, 75.80.+q, 77.80.-eI Introduction
Multiferroics, where ferroelectric order coexist with the long range magnetic order, attract special attention for the magnetoelectric (ME) cross coupling.spaldin ; fie ; cheo In addition to the fundamental interest on the origin of coexisting ME orders in a chemically single phase compounds, multiferroics are extremely promising for the applications.scott ; spaldin1 ; ramesh1 ; spaldin2 For the practical applications, occurrence of ME orders associated with the strong ME coupling is highly desirable, which is still missing except for very few promising inorganic materials like BiFeO3,wang ; cher CuO,kimura_NM and Sr3Co2Fe24O41.soda Herein, occurrence of the ferroelectric (FE) order is revealed at significantly high temperature in an unexplored R2BaCuO5 (R= Er, Dy, Sm) series. For example, the FE order is observed around 235 K associated with a large value of electric polarization () of 1410 C/m2 for a 4 kV/cm poling field (E) in case of Er2BaCuO5. Furthermore, an intriguing magnetic field cooled effect driven strong ME coupling is observed below the magnetic ordering temperature in the R2BaCuO5 series.
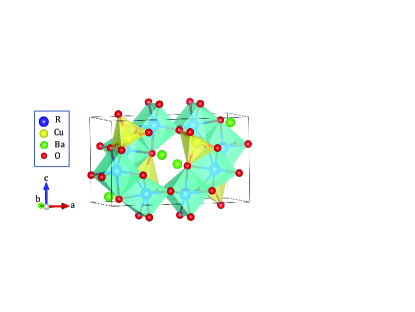
The R2BaCuO5 series of compounds crystallize in the (Z = 4) space group, where the copper ions are occupied in the distorted square pyramids (CuO5) and are connected by the RO7 polyhedra.michel ; what ; hunt ; sal Direct linkages between RO7 and linkage through CuO5 are depicted in Fig. 1. It has been observed that the lattice parameters and volume of the unit cell decrease linearly as a function of the lanthanide ionic radius starting from Sm3+ to Lu3+.sal The short-range force constant model was used for interpreting the results of Raman and infrared wavenumbers in the orthorhombic phase of R2BaCuO5 (R = Y, Ho, Gd), which was consistent with the orthorhombic phase of space group.gupta The heat capacitymosh and magnetization resultssal1 ; lev confirmed two magnetic transitions corresponding to antiferromagnetic (AFM) Cu2+ and R3+ orders, respectively. The EPR spectra were recorded for few members of R2BaCuO5 series, where strong exchange coupling was suggested between Cu2+ and R3+ ions.mez In fact, significant Cu2+ and R3+ exchange interaction and large magnetic anisotropy were proposed from the magnetic and spectroscopic investigations for R = Dy and Ho.baran High resolution optical absorption spectra of an intrinsic R3+ ion and Er3+ probe further confirmed the magnetic ordering temperatures and proposed that the magnetic structures of the copper sub-system are same for all the members of R2BaCuO5 (R = Sm, Eu, Tm, Yb, Lu).pau Furthermore, the optical spectra in the ”green phase” of Dy2BaCuO5 proposed the first order magnetic phase transition involving Cu and Dy moments.popo Neutron diffraction studies have been performed for Nd and Gd compounds at the R-site. The magnetic structure of Nd2BaCuO5 was suggested on the basis of a propagation vector k = [0, 0, 1/2] below the Néel temperature of 7.8 K, where the Cu2+ and Nd3+ magnetic moments were aligned along the crystallographic -axis and in the -plane, respectively.puche Recent neutron results on isotopically substituted 160Gd2BaCuO5 proposed an incommensurate magnetic structure with a propagation vector k = [0 0 1/2 - ] below 12 K, followed by a commensurate structure with a k = [0 0 1/2] propagation vector at 5 K, which was accompanied with a Gd spin re-orientation and a magnetostructural transition.ovsy The considerable magnetic refrigeration with a maximum magnetic entropy change of -S 10.4 J/kg K at Néel temperature and refrigerant capacity of 263 J/kg were suggested for Ho2BaCuO5.zhang
Recently, the spin-chain compounds R2BaNiO5sharma ; basu ; basut ; singh ; pal and R2BaCoO5upad attract special attentions for the multiferroic order, proposing different origins behind the occurrence of ferroelectric order. In this study we also observe the ferroelectric order in the unexplored R2BaCuO5 (R= Er, Dy, Sm) series. Intriguingly, ferroelectricity in all the members occurs at much higher temperatures than the magnetic ordering temperatures. The values of ferroelectric (FE) ordering temperatures () are close to room temperature as 235 K and 232 K for Er2BaCuO5 (EBCO) and Dy2BaCuO5 (DBCO), respectively, whereas the value is 184 K for Sm2BaCuO5 (SBCO). The values of are high as 1410, 992, and 980 C/m2 for E = 4 kV/cm in case of EBCO, DBCO, and SBCO, respectively. An interesting ME coupling driven by the magnetic field cooled (FC) effect is observed below the magnetic ordering temperatures for all the members of the series of compounds. The magnetic FC effect driven increase of is similar for EBCO and DBCO, which is different for SBCO. These FC effects are strongly correlated to the MD effect as well as magnetization curves of R2BaCuO5. The synchrotron diffraction studies of DBCO over a wide temperature range of 10-300 K confirm a structural transition to a polar structure of space group from the centrosymmetric structure at 232 K, around which the ferroelectricity appears. We suggest that the appearance of ferroelectricity correlates the structural transition to a polar structure.
II Experimental details
Polycrystalline R2BaCuO5 (R= Er, Dy, Sm) compounds are prepared using the solid-state reaction.sal The single phase chemical composition is confirmed by the x-ray diffraction studies at room temperature recorded in a PANalytical x-ray diffractometer (Model: X’ Pert PRO) using the Cu K radiation. The single-phase chemical composition is further checked by the synchrotron x-ray diffraction studies recorded with a wavelength of 0.1259 Å (98 keV) at the P07 beamline of PETRA III, Hamburg, Germany in the temperature range of 10-300 K. The synchrotron powder diffraction data are analyzed using the Rietveld refinement with the commercially available MAUD and FullProf softwares. Powder sample, pressed into a pellet, is used for the dielectric measurements using a E4980A LCR meter (Agilent Technologies, USA) equipped with a PPMS-II system of Quantum Design. The pyroelectric current () is recorded in an electrometer (Keithley, model 6517B) at a constant temperature sweep rate. The is integrated over time for obtaining the spontaneous electric polarization. The poling electric field is applied during cooling processes and the measurements are carried out in the warming mode with a zero electric field. Before measurement of , the electrical connections are short circuited and waited for a long time. In all the measurements the electrical contacts are fabricated using an air drying silver paint. The temperature dependence heat capacity () is measured with a PPMS-I system of Quantum Design. Magnetization is measured in a commercial magnetometer of Quantum Design (MPMS, evercool) both in zero-field-cooled (ZFC) and FC protocols. In case of ZFC and FC conditions sample is cooled in zero magnetic field () and non-zero and measurements are carried out in the warming mode with a non-zero .
III Experimental results and discussions
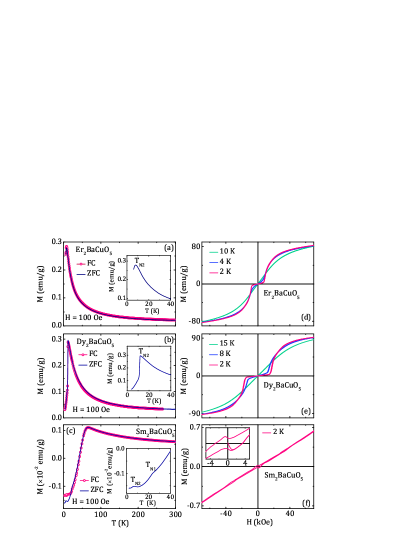
Thermal variations of the ZFC-FC magnetization curves recorded at 100 Oe are displayed in Figs. 2(a), 2(b), and 2(c) for EBCO, DBCO, and SBCO, respectively. In accordance with the reported results, a maximum representing the antiferromagnetic (AFM) ordering of the R ion () is observed at 5 K and 11 K for EBCO and DBCO, respectively.lev ; mez The insets of Figs. 2(a) and 2(b) highlight the low temperature transitions. A sharp fall of magnetization below 11 K rather proposes the first order magnetic phase transition, as originally suggested from the optical studies in DBCO.popo Any definite signature of similar first order magnetic phase transition is missing for EBCO in the current results because of the limitation of the measurement facility below 2 K. Nature of the ZFC-FC magnetization curves for SBCO is quite different from the other two compounds. As shown in Fig. 2(c), the decreases rapidly below 100 K and becomes negative below 50 K. Similar curves have been noted for the different systems proposing different origins.yusuf The interplay between different temperature dependences of the rare earth and moments were correlated to the negative magnetization in the - oxide systems. Along with the negative magnetization, a weak magnetization is noted in SBCO than other two compounds. This might be attributed to the close ordered moments of Sm3+ and Cu2+ ions with an antiparallel exchange coupling. As depicted in the inset of Fig. 2(c), two anomalies are observed around 23 K () and 6 K (), which represent the AFM ordering temperatures of Cu2+ and Sm3+, respectively.lev ; mez
The magnetic hysteresis loops are recorded below the transition temperatures as depicted in Figs. 2(d), 2(e), and 2(f) for EBCO, DBCO, and SBCO, respectively. The EBCO and DBCO show field induced transition from AFM to a ferromagnetic (FM) state below . The field induced transition shifts toward lower magnetic field with increasing temperature and vanishes above . The nature of curve is different for SBCO. An almost linear magnetization curve is observed at 2 K, as depicted in Fig. 2(f), which is consistent with the proposed AFM order. The nature of the curve in the low field region is highlighted in the inset of Fig. 2(f). A negative magnetization is observed in the low positive magnetic field up to 3 kOe. This negative magnetization below 3 kOe is consistent with the negative curve in the low temperature recorded at 100 Oe.
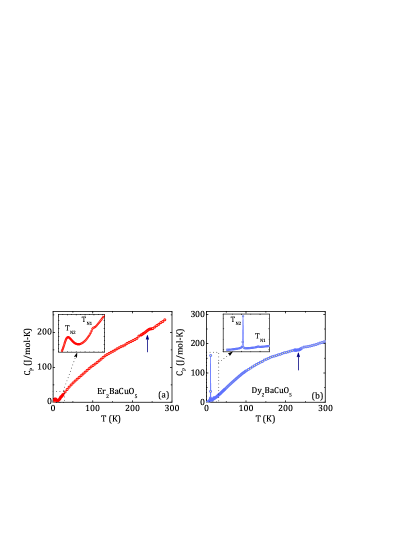
To find out the onset of Cu2+ ordering, which is not evident in the curve of EBCO and DBCO, we incorporate the specific heat capacity () measurements. Figures 3(a) and 3(b) show the of EBCO and DBCO, respectively. The insets of the two figures highlight the low temperature region of . A second anomaly () is evident around 19 and 18 K for EBCO and DBCO, respectively, which is associated with the strong signature of at low temperature.lev ; mosh In addition to the low temperature results, the weak anomalies, as indicated by the arrows in Figs. 3(a) and 3(b) for EBCO and DBCO, respectively, are also observed around 235 K and 232 K. We note that the onset of the polar order is noted close to those temperatures for EBCO and DBCO, which is discussed elsewhere in this article.
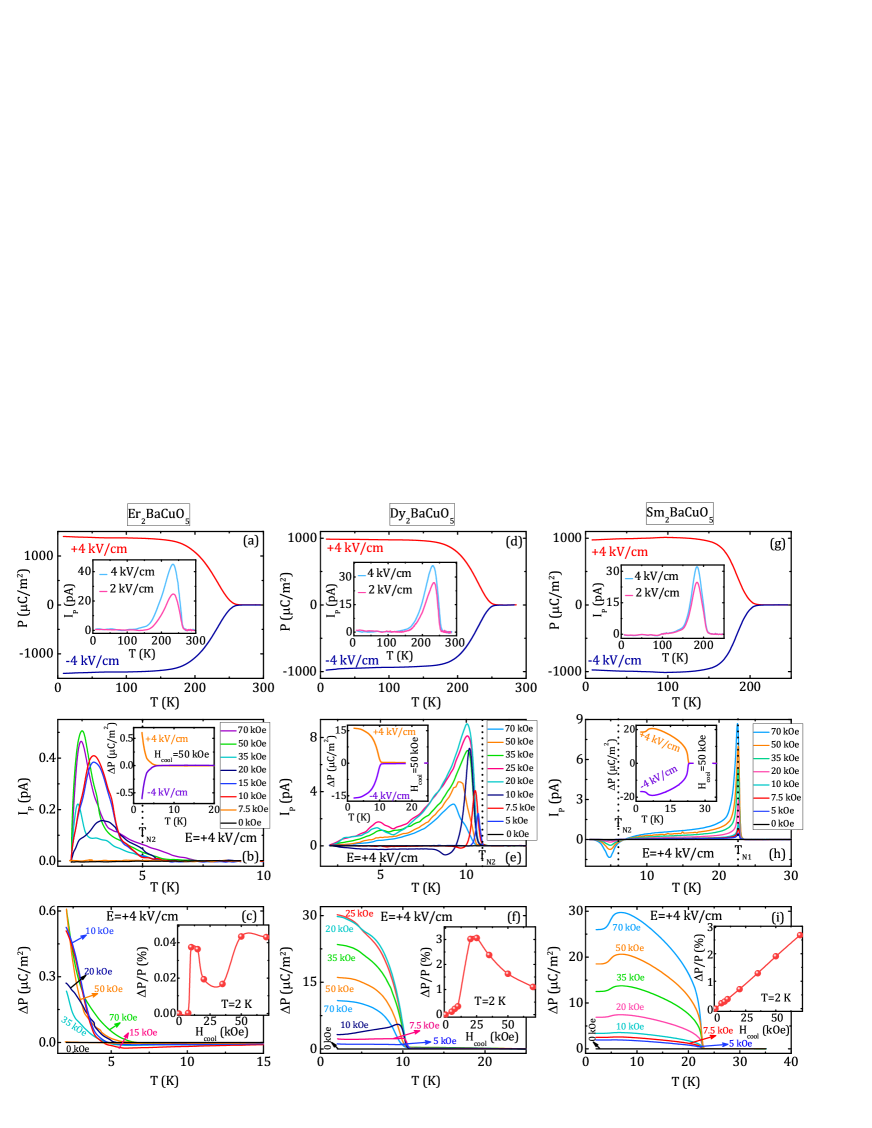
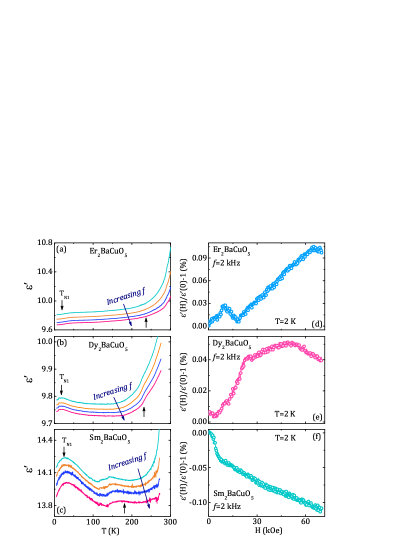
The dielectric permittivity () is recorded at different frequencies () by varying for all three compounds. Figures 4(a), 4(b), and 4(c) depict thermal variations of the real components () of for EBCO, DBCO, and SBCO, respectively. The () plots demonstrate a weak anomaly or a change of slope in the () curve in the high temperature region, similar to that observed in the () curve, which is indicated by the arrows in the figures. Here, the arrows indicate the onset of the spontaneous electric polarization. The details of which are discussed later. A peak or anomaly is also observed in the low- region, as indicated by the another arrows in the figures, around which the is observed for all the three compounds, indicating the ME coupling.
The magnetodielectric (MD) effects are recorded at low temperature for all the compounds. The MD effects, defined as - 1, are depicted with in Figs. 4(d-f) for EBCO, DBCO, and SBCO. The and represent the with and = 0, respectively. As depicted in Figs. 4(d) and 4(e), the variations of MD effect for EBCO and DBCO are correlated to the observed magnetization curves at 2 K. The changes in the MD(%) curve at 2 K are rapid around 7.5 and 20 kOe, around which the induced transitions are noticed in the magnetization curves at 2 K for EBCO and DBCO, respectively. With the further increase of the MD(%) effect of EBCO shows a peak around 8 kOe, above which it decreases showing a ’dip’, and finally it increases systematically above 18 kOe. The MD(%) effect of DBCO is different from the result of ECBO. It shows a change of slope around 23 kOe, above which it further increases displaying a maximum around 50 kOe. The MD effect of SBCO is different from the rest of two. Initially, it decreases rapidly, around which a negative with the increase of low up to 3 kOe is observed in the magnetization curve at 2 K. With further increase in , the MD(%) decreases monotonically at 2 K.
In order to confirm the occurrence of spontaneous polar order, the pyroelectric currents () are recorded with for all the samples in different conditions. A peak in () is observed for all the samples, as evident in the insets of Figs. 5(a), 5(d), and 5(g) with poling fields () of 2 and 4 kV/cm for EBCO, DBCO, and SBCO, respectively. The peaks of () curves appear at 235 K, 232 K and 184 K for EBCO, DBCO, and SBCO, respectively. To confirm the peaks in , appear due to genuine occurrence of the polar order, the are recorded for different poling temperatures, which are above and below the peak-temperatures for all three compounds. In all the measurements the definite signatures of the peaks are always observed at the same temperature, as evident in Fig. S1 of the Supplemental Material, pointing genuine occurrence of the polar order at the peaks in ) curves for all three materials. The integral of over time gives the reproducible value of (). The polarization () with for opposite are depicted in Figs. 5(a), 5(d), and 5(g) for EBCO, DBCO, and SBCO, respectively. The reversal of due to a change in sign of ( 4 kV/cm) signifies the ferroelectric behavior of the compounds. Importantly, the values of in the current investigation are 1410, 992, and 980 C/m2 for EBCO, DBCO, and SBCO, respectively for = 4 kV/cm. The -values of EBCO and DBCO are 10 and 245 times higher than the reported values of for Er2BaNiO5 and Dy2BaNiO5, basu1 ; basu2 whereas the -value of Sm2BaCuO5 is quite close the the reported -value of Sm2BaNiO5.indra
In order to investigate the possible ME coupling, the curves are recorded in different conditions of magnetic FC effects after cooling from or , separately. The magnetic FC effects are applied with three different conditions: 1) ZFC, 2) FC protocols as described in the experimental section, and 3) cooling in a non-zero and measurements of in the warming mode in zero magnetic field. In the above three cases the magnetic field cooling temperature and electric field poling temperature are considered same. Intriguingly, a definite signature of the peak in the curve, pointing additional change in (), is always noted for case 2) i.e. in the typical magnetic FC protocol only. In other two cases the peak in the curves is always absent for the three samples. In addition, during record of curve with FC protocol as described in case 2), the cooling from as well as provides the same result for EBCO and DBCO. This confirms that the R ordering at is the key for the occurrence of magnetic FC driven , whereas Cu ordering at does not influence on the occurrence of ferroelectricity. The detailed results of the curves for different magnetic field cooling processes are described in Fig. S2 of the Supplemental Material for DBCO.
The results on the occurrence of due to magnetic FC effect are depicted in Figs. 5(b) and 5(c) for EBCO, Figs. 5(e) and 5(f) for DBCO, and Figs. 5(h) and 5(i) for SBCO. In Fig. 5(b) the curves are depicted for different cooling fields (). The peaks in the curves are observed below of EBCO and are strongly influenced by . The peak observed in the curves shifts with and the magnitude is strongly dependent on . The curves, as obtained from the time integration of curves for = 4 kV/cm and = 50 kOe, are depicted in the inset of Fig. 5(b). The reversal of due to opposite poling field ensures the ferroelectric nature of the magnetic FC driven occurrence of . The at different are depicted in Fig. 5(c), where inset of the figure shows the plot of with , where and at 2 K are the change in polarization driven by the FC effect and the value of the electric polarization recorded in zero magnetic field, as depicted in Figs. 5(a), 5(d), and 5(g) for EBCO, DBCO, and SBCO, respectively. The plot of with at 2 K exhibits similar dependence of MD for ECBO. As observed in the MD with plot, the plot shows a sharp rise above 7.5 kOe and is followed by a decrease displaying a ’dip’, above which it increases with increasing . The results of and curves for DBCO are depicted in Figs. 5(e) and 5(f), respectively. The peaks observed in the curve are found just below . Analogous to the results of EBCO, peak in the curves shifts and value of changes significantly depending on . As depicted in the inset of Fig. 5(f), the with at 2 K exhibits similar behavior of the MD vs plot for DBCO. A sharp increase in is observed close to 20 kOe, analogous to that observed magnetic field driven transition at 20 kOe in the magnetization curve at 2 K. The shows a decrease with further increase in . The results of SBCO are different from the results of EBCO and DBCO. A sharp peak in the curve is observed at , which is missing for EBCO and DBCO. In addition, another peak in the curve is observed, which is opposite in direction below . Both the peaks in the curve remain at the same position for all the values of . The plot of with shows nearly linear dependence at 2 K, as also observed in the magnetization curve as well as MD vs plot in the high field region for SBCO.
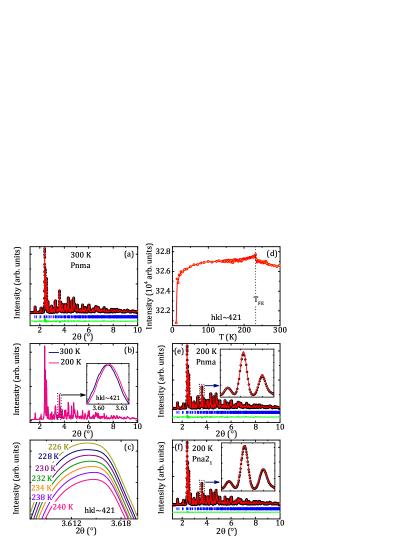
To find out the origin of ferroelectricity at much higher temperatures than the magnetic ordering temperatures, the structural properties are investigated by the synchrotron diffraction studies over a temperature range of 10-300 K for DBCO, as a representative of isostructural R2BaCuO5 series. Example of a diffraction pattern together with the refinement with a space group at 300 K is shown in Fig. 6(a) with the lattice constants, = 12.2243(9), = 5.6808(4), and = 7.1539(4) Å. The reliability parameters of the refinement are (%) 2.30, (%) 1.92, and 0.023 at 300 K. Figure 6(b) shows the diffraction patterns of DBCO above at 300 K and below at 200 K together in a same plot. The inset of Fig. 6(b) highlights the change of intensity pattern of the (421) diffraction peak associated with a shift of the peak position. The changes of the (421) diffraction peak position are depicted in Fig. 6(c) from 240 K to 226 K with the small temperature intervals. Here, the (421) peak at different temperatures is vertically shifted for the clarification of the small changes of the peak position. Temperature variation of the integrated intensity of the (421) diffraction peak is depicted in Fig. 6(d), which displays an evident signature near . This signature around in the integrated intensity plot is correlated with the change in scattering cross section and may point to a possible structural transition. The change in the integrated intensity is similar to that observed for the reported ferroelectric materials, where ferroelectricity appeared due to structural transition.indra ; indra1 ; indra2 ; dey With further decreasing temperature a sharp fall is observed around , as depicted in Fig. 6(d), which indicates a strong signature of the magnetoelastic coupling. The possible occurrence of the magnetoelastic coupling at is beyond the scope of our synchrotron data, which is recorded up to 10 K.
The diffraction patterns are refined with the high-temperature space group in the entire recorded temperature range. We note that the refinement is not satisfactory below using space group, as depicted in Fig. 6(e). Thus a structural transformation from to a polar structure is proposed for justifying the occurrence of a polar order. We use AMPLIMODEampli and ISODISTORTiso softwares to find out possible noncentrosymmetric space groups having a polar structure below . Among all possible noncentrosymmetric structures the space group has the highest symmetry, which is also a polar structure. The best fit is realized for the space group with the lattice constants, = 12.2192(2), = 7.1492(2), and = 5.6783(6) Å. Example of a satisfactory fit with the space group at 200 K is shown in Fig. 6(f). Insets of the Figs. 6(e) and 6(f) clearly demonstrate the refinements in a small 2 range and authenticate the better fit of the diffraction pattern using than the space group with the small reliability parameters, (%) 2.15, (%) 1.91, and 0.028. The bars below the diffraction patterns represent the diffraction peak positions and the difference plots are shown at the bottom for all the refinements. The difference plots shown at the bottom confirm a single phase without any trace amount of impurity.
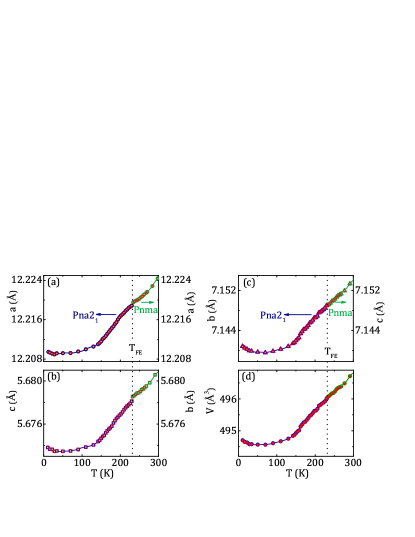
Thermal variations of the lattice parameters, , , and , as obtained from the refinements, are depicted in Figs. 7(a), 7(b), and 7(c), respectively. The is shown by the vertical broken line in the figures. As depicted in Figs. 7(b), and 7(c), the and axes in become and axes in structure. An anomaly around is observed in () and (), which is not so apparent in (). As depicted in Fig. 7(d), any significant change in the unit cell volume is absent around . The results are analogous to that observed in few members of the orthorhombic RCrO3 series, which exhibited the FE order involving structural transition.indra1 ; ghosh The results further indicate that the ferroelectricity in DBCO is correlated to this structural transition from the centrosymmetric to a polar structure. We note that the structural transition involves with the considerable deformations of CuO5 and DyO7 polyhedra. In order to probe these deformations microscopically, the bond lengths and bond angles between different atoms are investigated further.
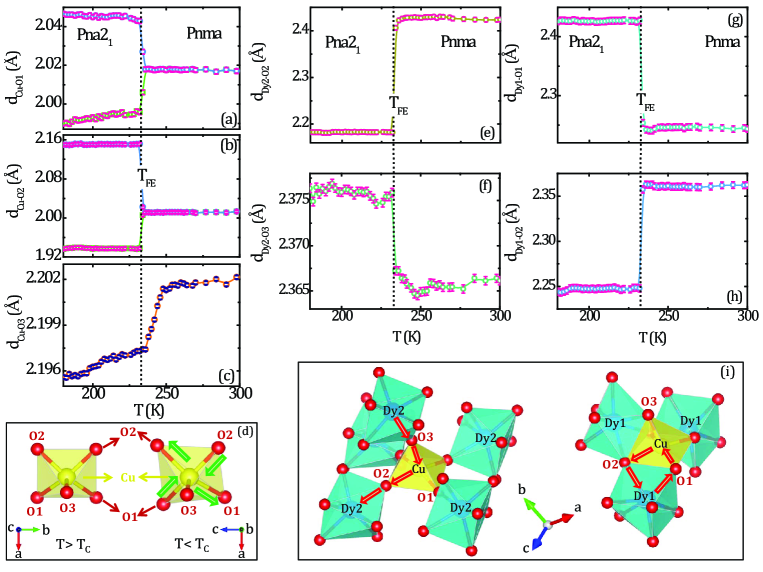
In the tetragonal CuO5 pyramids one oxygen (O3) occupies the apex position and out of four basal oxygens two are defined as O1 and the rest two as O2 in both the and space groups. The positions of oxygen are shown in the Fig. 8(d). The thermal variations of two Cu-O1 () and two Cu-O2 () bond lengths are depicted in Figs. 8(a) and 8(b), respectively. The step-like changes are observed in and around . The step-like increase and decrease of 1.2 % and 1.09 % are noted for , whereas the step-like more stronger increase and decrease of 7.02 % and 3.68 % are noted for . The decrease in is found to be small as 0.18 %, as depicted in Fig. 8(c). These results indicate that distortion of tetragonal CuO5 pyramid is significant in the basal plane around . The distortions of CuO5 polyhedra for structural change from to space group are depicted in the right panel of Fig. 8(d) by the arrows.
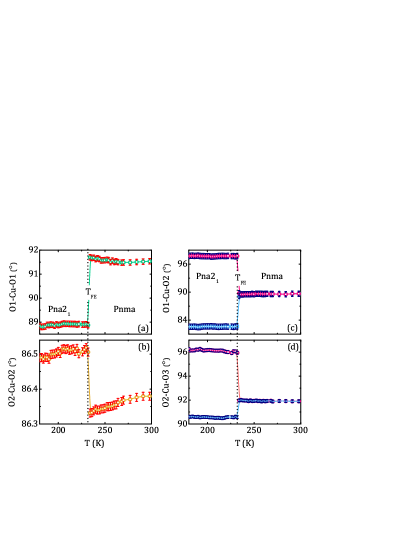
As observed in Fig. 1, the CuO5 polyhedra are connected to each other via DyO7 polyhedra, so the changes in CuO5 polyhedra must influence the neighboring DyO7 polyhedra. Two nonequivalent sites of Dy are defined as Dy1 and Dy2 in this article. The Dy1O7 and Dy2O7 prisms are joined by a common face and edge into a Dy1Dy2O11 unit. These units linked by the common edges and faces with CuO5 polyhedra form a three-dimensional network. The linkage of CuO5 polyhedra with Dy1O7 and Dy2O7 are shown separately in the right and left panels, respectively, of Fig. 8(i). A tetragonal CuO5 pyramid is connected with five Dy2O7 polyhedra through five oxygen at the edges. The thermal variations of Dy2-O2 () and Dy2-O3 () bond lengths are depicted in Figs. 8(e) and 8(f), respectively. In contrast to the decrease in [Fig. 8(c)], an increase in is observed around . Similarly, the observed decrease in is also correlated with the increase of connected [Fig. 8(b)]. On the other hand, the three Dy1O7 polyhedra are connected by the faces with tetragonal CuO5 pyramid. The thermal variations of Dy1-O1 () and Dy1-O2 () bond lengths, depicted in Figs. 8(g) and 8(h), also show the similar contrasting nature with the variation of connecting and around . The changes in aforesaid bond lengths are schematically represented in Fig. 8(i) by the arrows. These results clearly imply that the deformations of both Dy1O7 and Dy2O7 polyhedra are strongly influenced by the distortion of CuO5 polyhedra around FE order in DBCO. The results clearly infer that the emergence of electric polarization involves large distortions of the CuO5 and DyO7 polyhedra.
The thermal variations of bond angles between Cu and three O atoms are depicted in Figs. 9(a-d). As depicted in Figs. 9(a) and 9(b), a sharp decrease of 3.03 % for O1-Cu-O1 bond angle and the small increase of 0.19 % for O2-Cu-O2 bond angle are observed around . The decrease and increase are observed in O1-Cu-O2 and O2-Cu-O3 bond angles, respectively, around in DBCO. The maximum values of changes in O1-Cu-O2 and O2-Cu-O3 below are remarkable as 9% (increase), 8 % (decrease), and 4.2% (increase), 1.5 % (decrease), respectively. Our micro-structural studies indicate that the distortions of CuO5 polyhedra involving the structural changes lead to a key role for the ferroelectric order in DBCO, which is analogous to that observed for RCrO3 (R = Sm and Ho).indra1 ; ghosh
The structural studies propose that the ferroelctricity involves the structural transition at high temperature, which is much above the magnetic order. The results are rather analogous to that observed in few member of spin-chain compounds R2BaNiO5, such as, Er2BaNiO5basu1 and Sm2BaNiO5.indra For Er2BaNiO5 a short range order driven ferroelectricity was proposed, whereas a structural transition to a non-centrosymmetric polar structure has been proposed for the occurrence of ferroelectricity in case of Sm2BaNiO5. Similar results with a much higher than the magnetic order was observed for RCrO4 series (Sm, Gd, Ho), which was proposed to be correlated with the structural transition.indra1 Furthermore, the structural distortion has been suggested for tuning value in several occasions of filmsshim_film ; dubo_film ; liu_film ; dau_film ; kim_film ; lee_film as well as polycrystalline compounds.indra1 ; zhao_str ; shim_str ; dey_str The influence of structural distortion for the large polarization in bulk perovskite systems was also addressed from the first principles calculations.zhao_str The structural distortion driven increase of has been proposed for ABi2Ta2O9 series,shim_str Ca1−xLaxBaCo4O7 ( 0.05),dey_str and RCrO4 series.indra1 Herein, we note the value is systematic with the ionic radius of R3+ in R2BaCuO5, where low ionic radius involves a high value of for EBCO. With the increase in ionic radius, the value decreases drastically for DBCO and it continues to decrease slowly for SBCO. The lower ionic radius of Er3+ might be correlated to the larger structural distortion and thus provides the larger value for EBCO. In order to establish it, further investigations are suggested on the structural properties of other members of R2BaCuO5 series below .
The magnetic FC effect driven occurrence of is another interesting results in the current investigation. In fact, the reverses its sign due to change in sign of poling field and proposes the ferroelectric nature of the appearance of . Here, we emphasize on the fact that additional increase of polarization occurs only in case of magnetic FC effect, which is absent for the ZFC effect. The contrast results are observed for SBCO compared to the results for the rest two members, where the occurs below the R3+ ordering for EBCO and DBCO and below the Cu2+ ordering temperature for SBCO. The results may be correlated to the important observations, where the moments of Sm3+ and Cu2+ ions are comparable for SBCO and considerably larger moments of Er3+ and Dy3+ ions are noticed than the Cu2+ moment for EBCO and DBCO. The 3-4 hybridization holds the key for the contrast results. After the magnetic FC process, the possible modification of the magnetic structure, as determined by the neutron diffraction studies, can elucidate on the occurrence of , which is ferroelectric in nature for R2BaCuO5.
In conclusion, the studies on R2BaCuO5 (R = Er, Dy, Sm) series reveal two important observations. 1) The occurrence of ferroelectric order associated with the higher values of electric polarization close to room temperature for EBCO and DBCO. Although the ferroelectric order emerges for SBCO at slightly lower temperature than the of EBCO and DBCO, the in all the members is much higher than the corresponding magnetic ordering temperatures. A structural transition to the polar structure with a space group correlates the ferroelectric order. 2) The unusual magnetoelectric consequences are observed for all three members of R2BaCuO5. Intriguingly, an additional increase of polarization, which is ferroelectric in nature, appears only in case of magnetic field-cooled effect. The results propose that the R2BaCuO5 series is a new family of multiferroics.
Acknowledgment
S.G. acknowledges SERB, India project (Project No. SB/S2/CMP-029/2014) for the financial support. S.G. also acknowledges DST, India for the financial support to perform experiment at PETRA III, DESY, Germany for synchrotron diffraction studies (Proposal No. I-20150193).
References
- (1) N. A. Spaldin, S. -W. Cheong, and R. Ramesh, Phys. Today 63, 38 (2010).
- (2) M. Fiebig, J. Phys. D: Appl. Phys. 38, 123 (2005).
- (3) S. W. Cheong and M. Mostovoy, Nat. Mater. 6, 13 (2007).
- (4) J. F. Scott, J. Mater. Chem. 22, 4567 (2012).
- (5) N. A. Spaldin and M. Fiebig, Science 309, 391 (2005).
- (6) R. Ramesh, Nature 461, 1218–1219 (2009).
- (7) N. A. Spaldin, S.-W. Cheong, and R. Ramesh, Phys. Today 63, 38 (2010).
- (8) Wang, J. et al. Epitaxial BiFeO3 multiferroic thin film heterostructures. Science 299, 1719 (2003).
- (9) R. O. Cherifi, V. Ivanovskaya, L. C. Phillips, A. Zobelli, I. C. Infante, E. Jacquet, V. Garcia, S. Fusil, P. R. Briddon, N. Guiblin, A. Mougin, A. A. Ünal, F. Kronast, S. Valencia, B. Dkhil, A. Barthélémy and M. Bibes, Nat. Mater volume 13, 345–351 (2014).
- (10) T. Kimura, Y. Sekio, H. Nakamura, T. Siegrist, and A. P. Ramirez, Nat. mater. 7, 291 (2008).
- (11) M. Soda, T. Ishikura, H. Nakamura, Y. Wakabayashi, and T. Kimura, Phys. Rev. Lett. 106, 087201 (2011).
- (12) C. Michel and B. Raveau, J. Solid State Chem. 43, 73 (1982).
- (13) S. F. Whatkins, F. R. Fronczek, K. S. Wheelock, R. G. Goodrich, W. D. Hamilton, and W. W. Johnson, Acta Crystallogr. C 44, 3 (1988).
- (14) B. A. Hunter, S. L. Town, R. L. Davis, G. J. Russell, and K. N. R. Taylor, Physica C 161, 594 (1989).
- (15) A. Salinas-Sanchez, J. L. Garcia-Munoz, J. Rodriguez-Carvajal, R. Saez-Puche, and J. L. Martinez, J. Solid State Chem. 100, 201-211 (1992).
- (16) H. C. Gupta and V. Sharma, J. Raman Spectrosc. 36, 83–88 (2005).
- (17) V. V. Moshchalkov, N. A. Samarin, I. O. Grishchenko, B. V. Mill and J. Zoubkova, Solid State Communications, 78, 879-882 (1991).
- (18) A. Salinas-Sanchez, R. Sáez-Puche, and M. A. Alario-Franco, J. Solid State Chem. 89, 361-365 (1990).
- (19) R. Z. Levitin, R. V. Mill, V. V. Moshchalkov, N. A. Samarin, V. V. Snegirev and J. Zoubkova, J. Magn. Magn. Mater. 90 & 91, 536-540 (1990).
- (20) Yu. A. Koksharov, V. V. Moshalkov, A. A. Gippius, B. V. Mill, Y. Zoubkova, S.V.Gudenko, and A. N. Mezhuev, Physica C 185-189, 1151-1152 (1991).
- (21) M. Baran, H. Szymczak, S. A. Klimin, M. N. Popova, R. Z. Levitin, and B. V. Mill’, J. Expt. Theo. Phys. 84, 175 (1997).
- (22) I. V. Paukov, M. N. Popova, and B. V. Mill, Phys. Lett. A 169, 301-307 (1992).
- (23) M. N. Popova and G. G. Chepurko, J. Expt. Theo. Phys. 52, 562 (1990).
- (24) R. Sáez-Puche, E. Climent, E. Jiménez-Melero, J. Romero de Paz, J. L. Martínez, and M. T. Fernández-Díaz, J. Alloys Compds. 408-412, 613-617 (2006).
- (25) A. K. Ovsyanikov, I. V. Golosovsky, I. A. Zobkalo, and I. Mirebeau, J. Magn. Magn. Mater. 353, 71-75 (2014).
- (26) Y. Zhang, H. Li, J. Wang, X. Li, Z. Ren, and G. Wilde, Ceram. Int. 44, 1991-1994 (2018).
- (27) A. Indra, K. Dey, S. Majumdar, I. Sarkar, S. Francoual, R. P. Giri, N. Khan, P. Mandal, and S. Giri, Phys. Rev. B 95, 094402 (2017).
- (28) S. Sharma, T. Basu, A. Shahee, K. Singh, N. P. Lalla, and E. V. Sampathkumaran, Phys. Rev. B 90, 144426 (2014).
- (29) T. Basu, P. L. Paulose, K. K. Iyer, K. Singh, N. Mohapatra, S. Chowki, B. Gonde, and E. V. Sampathkumaran, J. Phys.: Condens. Matter 26, 172202 (2014).
- (30) T. Basu, N. Mohapatra, K. Singh, and E. V. Sampathkumaran, Aip Advances 5, 037128 (2015).
- (31) K. Singh, T. Basu, S. Chowki, N. Mahapotra, K. K. Iyer, P. L. Paulose, and E. V. Sampathkumaran, Phys. Rev. B 88, 094438 (2013).
- (32) G. Nénert, and T. T. M. Palstr, Phys. Rev. B 76, 024415 (2007).
- (33) S. K. Upadhyay and E. V. Sampathkumaran, Appl. Phys. Lett. 112, 262902 (2018).
- (34) A. Kumar, S. M. Yusuf, Physics Reports 556, 1-34 (2015).
- (35) T. Basu, V. V. Ravi Kishore, S. Gohil, K. Singh, N. Mohapatra, S. Bhattacharjee, B. Gonde, N. P. Lalla, P. Mahadevan, S. Ghosh, and E. V. Sampathkumaran, Sci. Rep. 4, 5636 (2014).
- (36) K. Singh, T. Basu, S. Chowki, N. Mahapotra, Kartik K. Iyer, P. L. Paulose, and E. V. Sampathkumaran, Phys. Rev. B 88, 094438 (2013).
- (37) A. Indra, K. Dey, J. K. Dey, S. Majumdar, U. Rütt, O. Gutowski, M. v. Zimmermann, and S. Giri, Phys. Rev. B 98, 014408 (2018).
- (38) A. Indra, K. Dey, A. Midya, P. Mandal, O. Gutowski, U. Rütt, S. Majumdar and S. Giri, J. Phys.: Condens. Matter 28, 166005 (2016).
- (39) K. Dey, A. Karmakar, A. Indra, S. Majumdar, U. Rütt, O. Gutowski, M. v. Zimmermann, and S. Giri, Phys. Rev. B 92, 024401 (2015).
- (40) D. Orobengoa, C. Capillas, I. Aroyo, and J. M. Perez-Mato, J. Appl. Crystallogr. 42, 820 (2009).
- (41) S. T. Bramwell, S. G. Carling, C. J. Harding, K. D. M. Harris, B. M. Kariuki, L. Nixon, and I. P. Parkin, J. Phys.: Condens. Matter 8, L123 (1996).
- (42) A. Ghosh, K. Dey, M. Chakraborty, S. Majumdar and S. Giri, Europhysics Letters 107, 47012 (2014).
- (43) T. Basu, V. V. Ravi Kishore, S. Gohil, K. Singh, N. Mohapatra, S. Bhattacharjee, B. Gonde, N. P. Lalla, P. Mahadevan, S. Ghosh, and E. V. Sampathkumaran, Sci. Rep. 4, 5636 (2014).
- (44) K. Shimamoto, S. Mukherjee, S. Manz, J. S.White, M. Trassin, M. Kenzelmann, L. Chapon, T. Lippert, M. Fiebig, C. W. Schneider, and C. Niedermayer, Sci. Rep. 7, 44753 (2017).
- (45) C. Dubourdieu, J. Bruley, T. M. Arruda, A. Posadas, J. Jordan-Sweet, M. M. Frank, E. Cartier, D. J. Frank, S. V. Kalinin, A. A. Demkov, and V. Narayanan, Nat. Nanotech. 8, 748 (2013).
- (46) H. -J. Liu, C. -W. Liang, W. -I. Liang, H. -J. Chen, J. -C. Yang, C. -Y. Peng, G. -F. Wang, F. -N. Chu, Y. -C. Chen, H. -Y. Lee, L. Chang, S. -J. Lin, and Y. -H. Chu, Phys. Rev. B 85, 014104 (2012).
- (47) C. Daumont, W. Ren, I. C. Infante, S. Lisenkov, J. Allibe, C. Carrétéro, S. Fusil, E. Jacquet, T. Bouvet, F. Bouamrane, S. Prosandeev, G. Geneste, B. Dkhil, L. Bellaiche, A. Barthélémy, and M. Bibes, J. Phys.: Condens. Mater 24, 162202 (2012).
- (48) D. H. Kim, H. N. Lee, M. D. Biegalski, and H. M. Christen, Appl. Phys. Lett. 92, 012911 (2008).
- (49) H. N. Lee, S. M. Nakhmanson, M. F. Chisholm, H. M. Christen, K. M. Rabe, and D. Vanderbilt, Phys. Rev. Lett. 98, 217602 (2007).
- (50) H. J. Zhao, L. Bellaiche, X. M. Chen, and J. Íñiguez, Nat. Commun. 8, 14025 (2017).
- (51) Y. Shimakawa, Y. Kubo, Y. Nakagawa, S. Goto, T. Kamiyama, H. Asano, and F. Izumi, Phys. Rev. B 61, 6559 (2000).
- (52) K. Dey, A. Indra, A. Chatterjee, S. Majumdar, U. Rütt, O. Gutowski, M. v. Zimmermann, and S. Giri, Phys. Rev. B 96, 184428 (2017).
Supplemental Material- High-temperature ferroelectric order and magnetic field-cooled effect driven magnetoelectric coupling in R2BaCuO5 (R= Er, Dy, Sm)
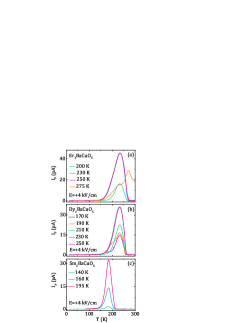
In order to confirm the peaks in at high temperatures appear due to genuine occurrence of polar order for all three compounds, the pyroelectric current is recorded at different poling temperatures () for a 4 kV/cm poling field. Here, samples are always cooled from the selected down to 2 K and is measured during warming mode in zero electric field. The results of at different are depicted in Figs. High-temperature ferroelectric order and magnetic field-cooled effect driven magnetoelectric coupling in R2BaCuO5 (R= Er, Dy, Sm)(a), High-temperature ferroelectric order and magnetic field-cooled effect driven magnetoelectric coupling in R2BaCuO5 (R= Er, Dy, Sm)(b), and High-temperature ferroelectric order and magnetic field-cooled effect driven magnetoelectric coupling in R2BaCuO5 (R= Er, Dy, Sm)(c) for EBCO, DBCO, and SBCO, respectively. Here, different values of are selected below, above, and close to the high temperature peak of the respective sample.
In case of EBCO, an additional peak above 235 K can be clearly observed at 270 K when poling is done at 275 K. The high temperature peak is absent when the poling is done at temperature 250 K. This confirms that the high-temperature large peak appears due to the extrinsic thermally stimulated depolarization currents (TSDC). The peak height around 235 K is nearly same for poling at 230 K and 250 K. =200 K reduces the peak height as we observe in Fig. High-temperature ferroelectric order and magnetic field-cooled effect driven magnetoelectric coupling in R2BaCuO5 (R= Er, Dy, Sm)(a). Similarly for DBCO and SBCO an apparent peak is always observed around 232 K and 184 K for different values of , as depicted in the Fig. High-temperature ferroelectric order and magnetic field-cooled effect driven magnetoelectric coupling in R2BaCuO5 (R= Er, Dy, Sm)(b) and High-temperature ferroelectric order and magnetic field-cooled effect driven magnetoelectric coupling in R2BaCuO5 (R= Er, Dy, Sm)(c), respectively. As shown in Fig. High-temperature ferroelectric order and magnetic field-cooled effect driven magnetoelectric coupling in R2BaCuO5 (R= Er, Dy, Sm)(b), the peak height around 232 K is almost same for = 230 K and 250 K, and reduces gradually for = 210 K, 190 K, and 170 K for DBCO. These results of DBCO are similar as EBCO. Fig. High-temperature ferroelectric order and magnetic field-cooled effect driven magnetoelectric coupling in R2BaCuO5 (R= Er, Dy, Sm)(c) also shows that the peak height around 184 K also reduces gradually for = 195 K, 160 K, and 140 K for SBCO. The peak due to extrinsic thermally stimulated depolarization currents (TSDC) is not observed for DBCO and SBCO when the poling is done from much higher temperature. These results are consistent with those previously reported for CuCrO2ngo and Fe-dope SrTiO3liu . So the appearance of a peak around 235 K, 232 K, and 184 K for EBCO, DBCO, and SBCO, respectively, in the pyroelectric current measurement indicate the genuine occurrence of the ferroelectricity in these three compounds.chen
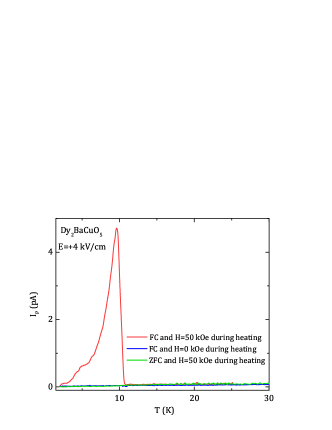
In order to investigate the possible ME coupling, the curves are recorded in different conditions of magnetic FC effects after cooling from temperature above or , separately. The results of different magnetic FC effects after cooling from greater than for DBCO are shown in the Fig. High-temperature ferroelectric order and magnetic field-cooled effect driven magnetoelectric coupling in R2BaCuO5 (R= Er, Dy, Sm). The pyroelectric current is recorded for =4 kV/cm poling field. Here the sample is always cooled down to 2 K and is measured during warming mode in zero electric field. As depicted in Fig. High-temperature ferroelectric order and magnetic field-cooled effect driven magnetoelectric coupling in R2BaCuO5 (R= Er, Dy, Sm), the magnetic field of 50 kOe are applied with three different conditions, which are indicated by three different curves. Green-curve shows ZFC (H=0 kOe during cooling) and measurement of in the warming mode with H=50 kOe, blue-curve shows FC (H=50 kOe during cooling) and measurement of in the warming mode in zero magnetic field, and red-curve shows FC (H=50 kOe during cooling) and measurement of in the warming mode with H=50 kOe. In the above three cases the magnetic field cooling temperature and electric field poling temperature are considered same. Intriguingly, the definite signature of the peak in the curve below is observed for FC and H=50 kOe during heating, i.e. in the typical magnetic FC protocol only.
References
- (1) T. N. M. Ngo, U. Adem, and T. T. M. Palstra, Appl. Phys. Lett. 106, 152904 (2015).
- (2) W. Liu and C. A. Randall, J. Am. Ceram. Soc. 91, 3245 (2008).
- (3) R. Chen and Y. Kirsh, Analysis of Thermally Stimulated Process (Pergamon Press, New York, 1981).