LUMINOSITY RATIO BETWEEN [O IV] 25.89 m LINE AND NUCLEAR 12 m CONTINUUM
AS DIAGNOSTICS FOR “BURIED” AGN
Abstract
We propose new diagnostics that utilize the [O IV] 25.89 m and nuclear (subarcsecond scale) 12 m luminosity ratio for identifying whether an AGN is deeply “buried” in their surrounding material. Utilizing a sample of 16 absorbed AGNs at redshifts lower than 0.03 in the Swift/BAT catalog observed with Suzaku, we find that AGNs with small scattering fractions (0.5%) tend to show weaker [O IV]-to-12 m luminosity ratios than the average of Seyfert 2 galaxies. This suggests that this ratio is a good indicator for identifying buried AGNs. Then, we apply this criterion to 23 local ultra/luminous infrared galaxies (U/LIRGs) in various merger stages hosting AGNs. We find that AGNs in most of mid- to late-stage mergers are buried, while those in earlier stage ones (including non-merger) are not. This result suggests that the fraction of buried AGNs in U/LIRGs increases as the galaxy-galaxy interaction becomes more significant.
1 Introduction
Luminous infrared galaxies (LIRGs; (8–1000 m) ) and ultraluminous infrared galaxies (ULIRGs; ) have large bolometric luminosities that are radiated mostly as infrared dust emission (Sanders et al., 1988; Sanders & Mirabel, 1996). This indicates that their powerful energy sources, starburst, and/or active galactic nuclei (AGNs) are hidden behind gas and dust. The contribution of U/LIRGs to the total infrared luminosity density increases rapidly with redshift (e.g., Goto et al., 2010). Therefore, the study of U/LIRGs is important to understand starburst-AGN connection, and the history of dust-obscured starburst and supermassive black hole (SMBH) growth in the universe.
The majority of U/LIRGs in the local universe are known to be merging systems of gas-rich disk galaxies (e.g., Veilleux et al., 2002; Kartaltepe et al., 2010). The merger is considered to be a key mechanism to funnel material from the kpc- to the pc-scale environment of SMBHs. It is predicted that during the final phase of a merger such as in U/LIRGs, rapid accretion onto the SMBHs takes place when the nucleus is deeply enshrouded by gas and dust (e.g., Hopkins et al., 2006). Such late-stage mergers are likely become “buried AGNs”, where even the direction of the lowest dust column-density can be opaque to the ionizing UV photons (i.e., the covering fraction of obscuring material, which we conventionally call “the torus” in this paper, is close to unity) and thereby the narrow line region (NLR) is less developed compared with normal AGNs (e.g., Imanishi et al., 2008). Thus, in order to test the scenario of merger-driven SMBH growth, it is important to identify buried AGNs and compare their fractions among different merger stages. In fact, hard X-ray observations of local U/LIRGs have revealed that AGNs in later stage mergers have larger amount of material around the SMBH (Ricci et al., 2017a). However, since X-ray data are not always available and have limitations (see below), it is quite useful to establish other methodology for identifying buried AGNs.
Broadband X-ray spectra covering from sub keV to several tens of keV provide useful diagnostics to identify whether an obscured AGN is deeply buried, as long as it is not heavily Compton thick (i.e., logcm 25). A typical X-ray spectrum of an obscured AGN consists of an absorbed direct power-law component, its reflected components from dense material such as the accretion disk and torus accompanied by fluorescent lines, and a scattered component by NLR gas, which is observable as a weak unabsorbed component in the soft X-ray band. It is expected that the intensity of X-rays scattered by the NLR gas relative to that of the direct component (scattering fraction; ) decreases with the torus covering fraction. Indeed, X-ray observations have discovered “low X-ray-scattering AGNs”, which are good candidates of AGNs deeply buried in geometrically thick tori (e.g., Ueda et al., 2007, 2015). To apply this method, however, we need X-ray spectra with sufficiently high quality. A potential problem for U/LIRGs is possible contamination from hot gas and X-ray binaries in the star forming regions, which makes it difficult to correctly estimate the flux of scattered AGN X-rays.
Another approach is to use the luminosities of spectral lines from AGN-excited ions in the NLR, which are proportional to the NLR size (hence the opening angle of the torus) and AGN luminosity at wavelengths responsible for the ionization. In particular, mid-infrared (MIR) lines from ions with highly ionization potentials, such as [O IV] 25.89 m (54.9 eV), are quite useful because they are less subject to extinction by dust in the host galaxy and are less contaminated by star formation activities than widely-used optical lines such as [O III] 5007. For instance, the ratio between the [O IV] 25.89 m and X-ray (2–10 keV) luminosities could be a good measure for identifying whether an AGN is buried. In fact, Kawamuro et al. (2016) found a good correlation between this ratio and the X-ray scattering fraction, using a sample of hard X-ray selected AGNs. A disadvantage of using the ratio is its coupling with the UV to X-ray spectral energy distribution (SED), because the [O IV] 25.89 m luminosity is proportional to that in the UV (not X-ray) band. It has been suggested that the X-ray to bolometric luminosity ratio of an AGN depends on the Eddington ratio (e.g., Vasudevan & Fabian, 2007; Toba et al., 2019). This leads to degeneracy, in particular for AGNs in U/LIRGs, whose Eddington ratios may be much larger than in normal Seyfert galaxies (see e.g., Oda et al., 2017).
In this paper, we propose the luminosity ratio between the [O IV] 25.89 m line and “nuclear” (subarcsecond scale) 12 m continuum as new diagnostics for identifying whether an AGN is deeply buried. Assuming that the MIR luminosity originates from hot dust heated by the AGN (e.g., Gandhi et al., 2009), it should basically be proportional to the bolometric AGN luminosity (dominated by the UV luminosity) times the torus covering fraction. To make the contamination from the host galaxy least, here we adopt the MIR photometric results based on high spatial-resolution observations by Asmus et al. (2014). Compared with the diagnostics using the ratio, this method has advantages that (1) X-ray spectra are not required (applicable even for heavily Compton thick AGNs), and that (2) it is little affected by the UV-to-X-ray SED. In Section 2, to confirm the validity of our method, we apply this diagnostics to a Swift/BAT selected AGN sample and compare the results with those of the X-ray scattering fraction. In Section 3, we apply it to a sample of local U/LIRGs having AGNs, and discuss the fraction of buried AGNs in different merger stages. In Section 4, we summarize our work. Following Asmus et al. (2014), we adopt the cosmological parameters (, , ) (67.3, 0.315, 0.685) (Planck Collaboration et al., 2014) throughout the paper.
| Object | log | log | Ref. 1 | log | log | Ref. 2 | |||
|---|---|---|---|---|---|---|---|---|---|
| (1) | (2) | (3) | (4) | (5) | (6) | (7) | (8) | (9) | (10) |
| NGC 235A | 0.02223 | 96.2 | 0.51 | 23.81 | 43.10 | 1 | 43.31 0.20 | 41.28 0.01 | 5 |
| ESO 297–18 | 0.02523 | 111.0 | 0.26 | 23.80 0.02 | 43.50 | 1 | 43.06 0.07 | 40.69 | 6 |
| NGC 788 | 0.01360 | 57.2 | 0.71 | 23.87 0.02 | 43.00 | 1 | 43.12 0.05 | 40.98 0.01 | 7 |
| NGC 2110 | 0.00779 | 35.9 | 0.28 0.04 | 22.37 0.01 | 43.30 | 1 | 43.09 0.06 | 40.85 0.03 | 7 |
| MCG–1–24–12 | 0.01964 | 93.8 | 0.50 | 22.81 | 43.24 | 2 | 43.46 0.04 | 41.03 0.03 | 7 |
| MCG–5–23–16 | 0.00850 | 42.8 | 0.47 | 22.20 0.01 | 43.30 | 1 | 43.26 0.04 | 40.79 0.12 | 7 |
| NGC 3081 | 0.00798 | 40.9 | 0.52 | 23.92 0.02 | 42.30 | 1 | 42.91 0.11 | 41.38 0.03 | 7 |
| NGC 3281 | 0.01067 | 52.8 | 1.90 | 23.94 0.08 | 42.69 | 3 | 43.61 0.05 | 41.77 0.03 | 7 |
| NGC 4507 | 0.01180 | 57.5 | 0.31 | 23.43 | 43.10 | 1 | 43.79 0.04 | 41.16 0.05 | 7 |
| ESO 506–27 | 0.02502 | 119.0 | 0.34 | 23.92 | 43.30 | 1 | 43.88 0.04 | 40.82 | 6 |
| NGC 4992 | 0.02514 | 119.0 | 0.00+0.17 | 23.78 | 43.30 | 1 | 43.53 0.10 | 40.27 | 6 |
| NGC 5252 | 0.02297 | 109.0 | 0.39 | 22.32 0.11 | 43.10 | 1 | 43.39 0.04 | 41.09 | 6 |
| NGC 5506 | 0.00618 | 31.6 | 1.09 | 22.49 0.01 | 43.00 | 1 | 43.41 0.03 | 41.48 0.01 | 7 |
| ESO 103–35 | 0.01329 | 59.5 | 0.10 | 23.31 0.01 | 43.50 | 1 | 43.71 0.23 | 41.16 0.01 | 7 |
| IC 5063 | 0.01135 | 49.1 | 0.90 0.10 | 23.40 0.01 | 43.08 | 4 | 43.77 0.03 | 41.53 0.04 | 7 |
| NGC 7172 | 0.00868 | 34.8 | 0.12 0.03 | 22.95 0.01 | 43.00 | 1 | 42.83 0.04 | 40.79 0.04 | 7 |
Note. — Columns: (1) Object name; (2) redshift from NASA/IPAC Extragalaxtic Database (NED); (3) luminosity distance in Mpc from Asmus et al. (2014); (4) scattering fraction in percent; (5) X-ray absorption hydrogen column density in cm-2; (6) absorption corrected 2–10 keV luminosity in erg s-1; (7) references of columns (4)–(6); (8) nuclear subarcsecond-scale monochromatic luminosities at rest-frame 12 m (Asmus et al., 2014); (9)–(10) [O IV] 25.89 m luminosity in erg s-1 and its reference; list of references: 1: Kawamuro et al. (2016); 2: Ricci et al. (2017b); 3: Winter et al. (2009); 4: Tazaki et al. (2011); 5: Inami et al. (2013); 6: Weedman et al. (2012); 7: Weaver et al. (2010).
2 / Ratio as Diagnostics of Torus Structure
To justify that the ratio of the [O IV] to nuclear 12 m luminosities is a good indicator for the opening angle of the torus, we first investigate the correlation between this ratio and the X-ray scattering fraction (), using AGNs in the Swift/BAT 9-month catalog (Tueller et al., 2008). Limiting the sample to non-blazar AGNs at Galactic latitudes of , we basically refer to the results of X-ray spectral analysis compiled by Ueda et al. (2015), but update them with more recent work by Kawamuro et al. (2016) based on Suzaku observations whenever available. The value is defined as the ratio of the unabsorbed fluxes at 1 keV between the scattered and transmitted components. We select only Compton-thin absorbed AGNs (log/cm 22–24)111Because the scattered components are measurable only in absorbed AGNs. We also exclude Compton-thick AGNs (log/cm 24) to avoid possible systematic uncertainties in the intrinsic luminosities (and hence in ), which largely depend on spectral models adopted (see e.g., Murphy & Yaqoob, 2009; Tanimoto et al., 2018). whose scattering fractions are less than 2%222Because apparently large values are likely to be caused by partial absorbers in the line of sight (see Ueda et al., 2015).. To make sure that these values are reliable, we check if the contamination from X-ray binaries in the host galaxy significantly affects the flux of the unabsorbed power-law component. Using the total infrared luminosity (8–1000 m)333We convert 40–120 m luminosity to 8–1000 m band using a conversion factor of 1.9 (Lutz et al., 2018). estimated by Lutz et al. (2018) and the relation between total infrared and X-ray luminosity by Mineo et al. (2012), we find that the estimated contribution from X-ray binaries is almost ignorable (the ratio of the total luminosity of X-ray binaries to the intrinsic luminosity of the AGN is 0.1% in the 0.5–2 keV band) except for NGC 4388 and NGC 4138 (0.3% and 0.8%, respectively), which we exclude from our analysis. Thus, our final sample consists of 16 objects.
Then, the [O IV] 25.89 m luminosities for these AGNs are taken from Weaver et al. (2010) and Weedman et al. (2012), which are based on the MIR spectra observed with the Infrared Spectrograph (IRS; Houck et al. 2004) on board the Spitzer observatory. We refer to Asmus et al. (2014) for the 12 m photometry at a 0.4 arcsec scale, corresponding to 300 pc at z 0.03, observed with the Very-Large-Telescope mounted Spectrometer and Imager for the Mid-infrared (VISIR; Lagage et al. 2004), the Gemini/Michelle (Glasse et al., 1997), and the Subaru/Cooled Mid-Infrared Camera and Spectrometer (COMICS; Kataza et al. 2000). All the 16 Swift/BAT AGNs selected above have the measurements of both [O IV] 25.89 m and nuclear 12 m luminosities, as summarized in Table 1.

Figure 1(a) plots the luminosity correlations between the [O IV] 25.89 m line and nuclear 12 m continuum for the AGNs in Table 1. As noticed, the low X-ray-scattering AGNs ( 0.5%) show smaller [O IV] luminosities relative to the nuclear 12 m ones than the average of Seyfert 2s obtained by Yang et al. (2015). Figure 1(b) plots the ratio as a function of the X-ray scattering fraction, together with the mean values and standard errors in three bins. We find that the ratios tend to be lower for AGNs with lower values; the averaged ratio of the low X-ray-scattering AGNs (log = ) is smaller than those of the others (). A Kolmogorov-Smirnov (KS) test indicates that the difference in the distribution between the low X-ray-scattering AGNs and the others is significant at a 99% confidence level.
Yang et al. (2015) suggest that both X-ray and continuum MIR emission in AGNs may be mildly anisotropic by assuming that the [O IV] 25.89 m line is an isotropic luminosity indicator; AGNs viewed at higher inclination angles tend to have smaller X-ray and MIR luminosities. This would lead to an apparent correlation between () and . However, since our sample consists of only obscured AGNs, such effect, if present, would be limited. In fact, Liu et al. (2014) report that the correlation between log and log are statistically indistinguishable between Seyfert 2s with cm−2 and those with cm−2, which are likely to have relatively high and low inclination angles among obscured AGNs, respectively. According to the clumpy torus model by Stalevski et al. (2016), the difference in the MIR luminosity is within a factor of 1.5 for an inclination angle range of 60∘–90∘. This is smaller than the observed difference of the mean ratio between the 0.5% and 0.5% samples (a factor of 4). Hence, the observed – correlation cannot be accounted for by the possible anisotropy effects. These results support that the ratio is indeed a good estimator of the torus opening angle and hence can be used to identify whether an AGN is buried.
3 Application to U/LIRG
We apply our method to local U/LIRGs in the Great Observatories All-sky LIRG Survey (GOALS; Armus et al. 2009). The GOALS targets 202 U/LIRGs in the local universe contained in the IRAS Revised Bright Galaxy Sample (RBGS; Sanders et al. 2003), which is a complete flux limited sample of 629 extragalactic objects having (60 m) 5.24 Jy at Galactic latitudes . Using high-resolution spectra obtained with Spitzer/IRS, Inami et al. (2013) estimate the [O IV] 25.89 m fluxes of all GOALS samples. The nuclear 12 m fluxes are obtained by Asmus et al. (2014) for 23 U/LIRGs in the GOALS sample, which constitute the sample for our study. We summarize their MIR properties in Table 2444We exclude NGC 6240 and NGC 1275 from our sample by the following reasons. NGC 6240 hosts dual AGNs as revealed by Chandra (Komossa et al., 2003) but the [O IV] fluxes are not separated. NGC 1275 is a radio galaxy located in the Perseus cluster, and its 12 m flux may be contaminated with the emission from the jet and the cluster (see Hitomi Collaboration et al., 2018). . Merger stages of the GOALS sample are specified by Stierwalt et al. (2013), via visual inspection of the IRAC 3.6 m images and/or higher resolution images in the literature. Each U/LIRG is assigned one of the following five designations: non-mergers (no sign of merger activity or massive neighbors: “N”), pre-mergers (galaxy pairs prior to a first encounter: “A”), early stage mergers (post-first-encounter with galaxy disks still symmetric and intact but with signs of tidal tails: “B”), mid-stage mergers (showing amorphous disks, tidal tails, and other signs of merger activity: “C”), or late stage mergers (two nuclei in a common envelope: “D”).
| Object | log | M | Type | log | Ref | log | log | |||
|---|---|---|---|---|---|---|---|---|---|---|
| (1) | (2) | (3) | (4) | (5) | (6) | (7) | (8) | (9) | (10) | (11) |
| NGC 34 | 0.01962 | 83.5 | 11.49 | D | Sy2 | 0.20 0.11 | 23.7 | 1 | 43.08 0.05 | 40.67 |
| NGC 235A | 0.02223 | 96.2 | 11.44a | B | Sy2 | 0.59 0.11 | 23.5 | 2 | 43.31 0.20 | 41.28 0.01 |
| NGC 1068 | 0.00379 | 14.4 | 11.40 | Nb | Sy1.8/2 | 1.00 | 24.0 | 3 | 43.80 0.15 | 41.70 0.28 |
| NGC 1365 | 0.00546 | 17.9 | 11.00 | N | Sy1.8 | 0.51 0.14 | 24.0 | 4 | 42.54 0.04 | 40.72 0.03 |
| ESO 420–13 | 0.01191 | 52.7 | 11.07 | N | Cp | 0.42 0.12 | 43.20 0.09 | 41.25 0.01 | ||
| IRAS 05189–2524 | 0.04256 | 196.0 | 12.16 | D | Sy2 | 0.67 0.10 | 23.1 | 1 | 44.87 0.17 | 42.08 0.02 |
| NGC 2623 | 0.01851 | 87.3 | 11.60 | D | Cp | 0.26 0.10 | 24.0 | 5 | 43.61 0.26 | 40.92 0.02 |
| IRAS F08572+3915 | 0.05835 | 275.0 | 12.16 | D | Cp* | 0.46 0.17 | 45.13 0.09 | 41.41 | ||
| UGC 5101 | 0.03937 | 182.0 | 12.01 | D | Cp | 0.41 0.16 | 24.1 | 1 | 44.35 0.08 | 41.46 0.01 |
| NGC 3690W | 0.01022 | 48.2 | 11.93a | C | Cp | 0.46 0.15 | 24.6 | 6 | 43.73 0.28 | 40.90 0.04 |
| NGC 3690E | 0.01041 | 49.1 | 11.93a | C | Cp | 0.17 0.04 | 22.1 | 7 | 43.30 0.24 | 40.67 0.15 |
| IC 883 | 0.02330 | 109.0 | 11.73 | D | Cpc | 0.13 0.08 | 21.3 | 8 | 43.90 | 40.99 0.01 |
| MCG–03–34–064 | 0.01654 | 79.3 | 11.28 | A | Sy1.8/2 | 0.85 0.07 | 23.7 | 1 | 44.00 0.05 | 41.90 0.02 |
| NGC 5135 | 0.01369 | 66.0 | 11.30 | N | Sy2 | 0.36 0.08 | 24.8 | 9 | 43.24 0.08 | 41.61 0.01 |
| IC 4518W | 0.01626 | 76.1 | 11.23 | Bd | Sy2 | 23.4 | 1 | 43.54 0.07 | 41.77d | |
| IRAS F15250+3608 | 0.05516 | 258.0 | 12.08 | D | Cp:* | 0.24 0.21 | 44.64 0.04 | 41.52 | ||
| ESO 286–19 | 0.04300 | 195.0 | 12.06 | D | Cp:* | 0.39 0.15 | 44.67 0.04 | 41.28 | ||
| NGC 7130 | 0.01615 | 68.9 | 11.42 | N | Cp | 0.39 0.12 | 24.6 | 1 | 43.17 0.09 | 41.07 0.01 |
| ESO 602–25 | 0.02504 | 109.0 | 11.34 | N | Cp:c | 0.31 0.11 | 43.08 0.17 | 40.90 0.02 | ||
| NGC 7469 | 0.01632 | 67.9 | 11.65 | A | Sy1/1.5 | 0.44 0.14 | 19.8 | 1 | 43.83 0.05 | 41.43 0.02 |
| NGC 7592W | 0.02462 | 105.0 | 11.40a | B | Cp | 0.40 0.13 | 43.65 0.16 | 40.92 0.01 | ||
| NGC 7674 | 0.02892 | 126.0 | 11.56 | A | Sy2 | 0.80 0.07 | 24.5 | 1 | 44.26 0.06 | 41.94 0.01 |
| NGC 7679 | 0.01714 | 71.7 | 11.11 | A | Cp | 0.27 0.09 | 20.3 | 1 | 42.74 0.12 | 41.32 0.01 |
Note. — Columns: (1) Object name; (2) redshift from NED; (3) luminosity distance in Mpc; (4) total infrared luminosity in units of ; (5) merger stage (N = non-merger, A = pre-merger, B = early stage merger, C = mid-stage merger, and D = late stage merger) as classified from the Hubble Space Telescope (HST) and IRAC 3.6 m imaging (see Stierwalt et al. 2013); (6) optical AGN classification; Cp means that the object has been classified as AGN/starburst composites, and the suffix ‘:’ means that the classification is uncertain; Objects marked with an * mark uncertain AGNs; (7) AGN fractional contribution to the total MIR luminosity based on five Spitzer/IRS diagnostics from Díaz-Santos et al. (2017); (8)–(9) X-ray absorption hydrogen column-density in cm-2 and its reference; (10) nuclear subarcsecond-scale monochromatic luminosities at rest-frame 12 m; (11) [O IV] 25.89 m luminosity in erg s-1. Columns (3), (6), and (10) are taken from Asmus et al. (2014). Column (4) and (11) are taken from Armus et al. (2009) and Inami et al. (2013), respectively. List of references: 1: Ricci et al. (2017a); 2: Winter et al. (2009); 3: Ricci et al. (2014); 4: Rivers et al. (2015); 5: Evans et al. (2008); 6: Ptak et al. (2015); 7: Zezas et al. (2003); 8: Romero-Cañizales et al. (2017); 9: Yamada et al. in prep. (using the NuSTAR observations.)
Contribution from star formation to the MIR continuum may be significant in a U/LIRG, even if we refer to the nuclear flux. In fact, many objects in Table 2 are classified as AGN/starburst composites. Díaz-Santos et al. (2017) estimate the fractional AGN contribution to the MIR luminosity for the GOALS sample with Spitzer/IRS observations 555The projected aperture sizes are 3”.7 12” at 9.8 m in SL module, 10”.6 35” at 26 m in LL, 4”.7 15”.5 at 14.8 m in SH, and 11”.1 36”.6 at 28 m in LH (Díaz-Santos et al., 2017)., by employing up to five diagnostics: the line flux ratios of [Ne V]14.3/[Ne II]12.8 and [O IV]25.9/[Ne II]12.8, the equivalent width of the 6.2 m Polycyclic Aromatic Hydrocarbons (PAH), the / dust continuum slope, and the Laurent diagram (Laurent et al., 2000). The averaged estimate of the MIR AGN fraction for each galaxy, , is listed in Table 2. To check their systematic uncertainties, we also calculate the mean MIR AGN fractions by excluding the [Ne V]/[Ne II] and [O IV]/[Ne II] diagnostics, because the [Ne V] and [O IV] lines may not be good AGN-power indicators in buried AGNs. We find that then the estimates become larger than those obtained with the five diagnostics by a factor of 1.1–1.7. This implies that the AGN fractions in Table 2 may be underestimated; nevertheless, in the following, we adopt these numbers for conservative discussions. It is confirmed that generally the composites have smaller than Seyfert 1.8/2s. In our paper, we distinguish U/LIRGs with 1/3 as starburst-dominant objects, and the rest as AGN-important ones. Asmus et al. (2015) find that AGN-important objects (e.g., NGC 3690W, NGC 7130) follow the same MIR-X-ray luminosity correlation as for normal Seyferts, while the starburst-dominant ones (e.g., NGC 3690E) do not.
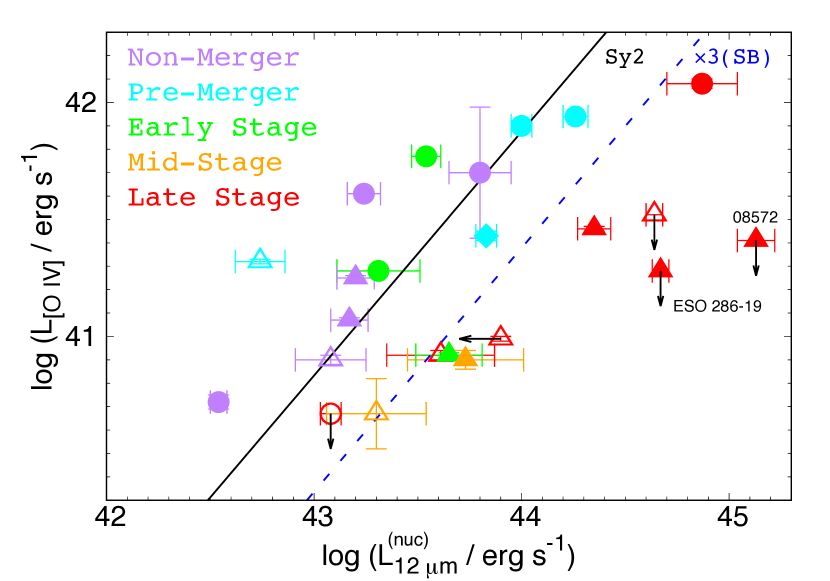
In Figure 2(a), we present the correlation between [O IV] and nuclear 12 m luminosities for the U/LIRGs in Table 2. The merger stages are distinguished with colors. We find that the non-mergers and pre-/early-stage mergers, most of which are Seyfert 1.8/2s or AGN-important composites (Table 2), follow the same correlation as for typical Seyfert 2s (the black solid line; Yang et al. 2015). By contrast, the mid- and late-stage mergers, most of which are composites, show smaller ratios than typical Seyfert 2s. We need to keep in mind, however, that their 12 m luminosities may be largely contaminated by the starburst activities. Hence, we hereafter exclude the starburst-dominant objects (empty symbols) from our discussion.
Focusing on the AGN-important objects (filled symbols), we plot the expected correlation corrected for the maximum contribution from starburst (i.e., by a factor of 3)666Here we assume that the 12 m luminosity is proportional to the MIR one. by the dashed line in Figure 2(a). This line should be taken as lower limits of , because (1) it assumes the minimum MIR AGN fraction (1/3), (2) the MIR AGN fractions in Table 2 may be underestimated (see above), and (3) we utilize the nuclear MIR flux, instead of those from the whole galaxy as used by Díaz-Santos et al. (2017). Among the five AGN-important objects in mid-/late-stage mergers, we regard IRAS F05189–2524, UGC 5101, and NGC 3690W as certain AGNs, whose hard X-ray transmitted components are detected with NuSTAR (Teng et al., 2015; Oda et al., 2017; Ptak et al., 2015, respectively). The rest two objects, IRAS 08572+3915 and ESO 286–19, are classified as “uncertain AGNs” in Asmus et al. (2014). Nevertheless, infrared observations suggest that they have “buried” AGNs (2.5–5 m, Imanishi et al. 2008; 5–8 m, Nardini et al. 2010). As noticed from Figure 2(a), all the AGN-important mid-/late-stage mergers have lower ratios than the correlation of typical Seyfert galaxies corrected for the maximum starburst contribution, indicating that they are buried by the tori with large covering fractions.
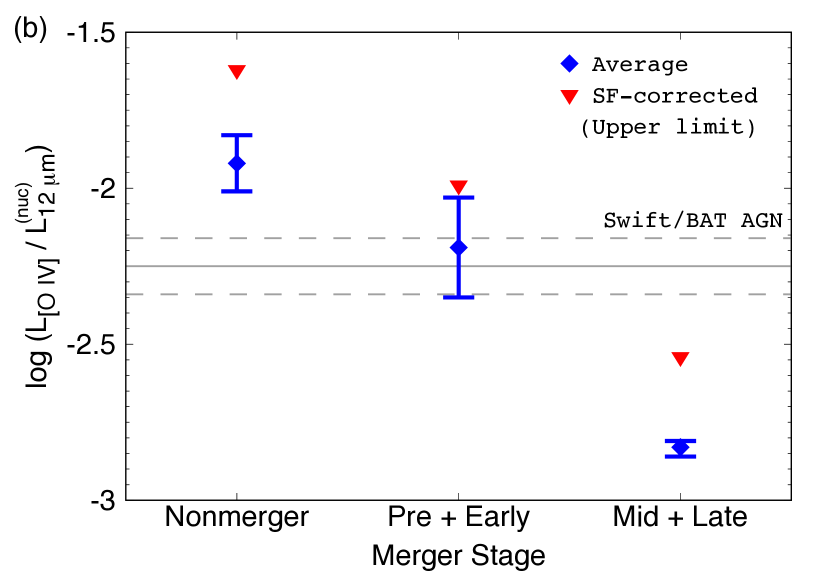
Figure 2(b) represents the mean values and standard errors of the log ratio in three different merger stages. For robust discussion, here we have excluded the Seyfert 1/1.5 (NGC 7469), starburst-dominated objects, and uncertain AGNs. In addition, we also plot the results where the star formation contributions are subtracted from the nuclear 12 m luminosities by using the MIR AGN fractions in Table 2 (red triangles). As mentioned above, these MIR AGN fractions are likely to be underestimated and hence the resultant log values should be taken as their upper limits. A trend is seen that the [O IV]-to-12 m ratio decreases with merger stage. The non-mergers and pre-/early-stage mergers show mean values similar to typical Seyfert 2s (log ; Yang et al. 2015) and to the Swift/BAT sample (; Table 1), respectively. By contrast, the mid-/late-stage mergers show a much smaller value (); this is true even if we refer to the upper limit corrected for star formation contributions (). A KS test indicates that the log distribution is different at a 99% confidence level between the mid-to-late stage mergers and the others. Thus, our results support the scenario that the fraction of buried AGNs in U/LIRGs increases as the galaxy-galaxy interaction becomes more significant.
Our conclusion is well in line with the hard X-ray results (Ricci et al., 2017a), who show that the torus covering fraction is very high % in late stage mergers on the basis of statistical argument. Our method has a potential to be applied to individual U/LIRGs for which MIR spectroscopy is available but the current sensitivities of hard X-ray observations are insufficient. We note that instead of using the spatially-resolved nuclear flux, spectral decomposition of the IR SED should be also useful in estimating the AGN contribution in the MIR fluxes (Ichikawa et al., 2019). This is a subject of future work.
4 Conclusion
For identifying whether an AGN is deeply buried, we propose new diagnostic that utilizes the ratio between [O IV] 25.89 m and nuclear 12 m luminosities. First, to confirm the validity of this diagnostics, we investigate the relation between this ratio and the X-ray scattering fraction, using a sample of 16 Swift/BAT AGNs observed with both Spitzer/IRS and ground-based high angular-resolution MIR cameras. We find that low X-ray-scattering AGNs with show smaller [O IV]-to-12 m ratios in average than normal Seyferts. Next, we apply it for 23 U/LIRGs in the GOALS sample. We find that most of the AGN-important mid- to late-stage mergers contain buried AGNs, while the earlier stage mergers contain few. These results suggest that the fraction of buried AGNs in U/LIRGs increase with merging stage. Our method is applicable to individual objects whose good X-ray spectra are not available.
We thank the reviewer for the useful comments, which helped us improve the quality of the manuscript. Part of this work was financially supported by the Grant-in-Aid for Scientific Research 17K05384 (Y.U.) and 15K05030 (M.I.). This work was also supported by the Grant-in-Aid for JSPS Research Fellow 17J06407 (A.T), 17J09016 (T.K), and 18J01050 (Y.T). We acknowledge financial support from the Ministry of Science and Technology of Taiwan (MOST 105-2112-M-001-029-MY3; Y.T.). This research has made use of data from the NASA/IPAC Infrared Science Archive and NASA/IPAC Extragalactic Database (NED), which are operated by the Jet Propulsion Laboratory, California Institute of Technology, under contract with the National Aeronautics and Space Administration.
References
- Armus et al. (2009) Armus, L., Mazzarella, J. M., Evans, A. S., et al. 2009, PASP, 121, 559
- Asmus et al. (2015) Asmus, D., Gandhi, P., Hönig, S. F., Smette, A., & Duschl, W. J. 2015, MNRAS, 454, 766
- Asmus et al. (2014) Asmus, D., Hönig, S. F., Gandhi, P., Smette, A., & Duschl, W. J. 2014, MNRAS, 439, 1648
- Díaz-Santos et al. (2017) Díaz-Santos, T., Armus, L., Charmandaris, V., et al. 2017, ApJ, 846, 32
- Evans et al. (2008) Evans, A. S., Vavilkin, T., Pizagno, J., et al. 2008, ApJ, 675, L69
- Gandhi et al. (2009) Gandhi, P., Horst, H., Smette, A., et al. 2009, A&A, 502, 457
- Glasse et al. (1997) Glasse, A. C., Atad-Ettedgui, E. I., & Harris, J. W. 1997, in Proc. SPIE, Vol. 2871, Optical Telescopes of Today and Tomorrow, ed. A. L. Ardeberg, 1197–1203
- Goto et al. (2010) Goto, T., Takagi, T., Matsuhara, H., et al. 2010, A&A, 514, A6
- Hitomi Collaboration et al. (2018) Hitomi Collaboration, Aharonian, F., Akamatsu, H., et al. 2018, PASJ, 70, 13
- Hopkins et al. (2006) Hopkins, P. F., Hernquist, L., Cox, T. J., et al. 2006, ApJS, 163, 1
- Houck et al. (2004) Houck, J. R., Roellig, T. L., van Cleve, J., et al. 2004, ApJS, 154, 18
- Ichikawa et al. (2019) Ichikawa, K., Ricci, C., Ueda, Y., et al. 2019, ApJ, 870, 31
- Imanishi et al. (2008) Imanishi, M., Nakagawa, T., Ohyama, Y., et al. 2008, PASJ, 60, S489
- Inami et al. (2013) Inami, H., Armus, L., Charmandaris, V., et al. 2013, ApJ, 777, 156
- Kartaltepe et al. (2010) Kartaltepe, J. S., Sanders, D. B., Le Floc’h, E., et al. 2010, ApJ, 721, 98
- Kataza et al. (2000) Kataza, H., Okamoto, Y., Takubo, S., et al. 2000, in Proc. SPIE, Vol. 4008, Optical and IR Telescope Instrumentation and Detectors, ed. M. Iye & A. F. Moorwood, 1144–1152
- Kawamuro et al. (2016) Kawamuro, T., Ueda, Y., Tazaki, F., Ricci, C., & Terashima, Y. 2016, ApJS, 225, 14
- Komossa et al. (2003) Komossa, S., Burwitz, V., Hasinger, G., et al. 2003, ApJ, 582, L15
- Lagage et al. (2004) Lagage, P. O., Pel, J. W., Authier, M., et al. 2004, The Messenger, 117, 12
- Laurent et al. (2000) Laurent, O., Mirabel, I. F., Charmandaris, V., et al. 2000, A&A, 359, 887
- Liu et al. (2014) Liu, T., Wang, J.-X., Yang, H., Zhu, F.-F., & Zhou, Y.-Y. 2014, ApJ, 783, 106
- Lutz et al. (2018) Lutz, D., Shimizu, T., Davies, R. I., et al. 2018, A&A, 609, A9
- Mineo et al. (2012) Mineo, S., Gilfanov, M., & Sunyaev, R. 2012, MNRAS, 419, 2095
- Murphy & Yaqoob (2009) Murphy, K. D., & Yaqoob, T. 2009, MNRAS, 397, 1549
- Nardini et al. (2010) Nardini, E., Risaliti, G., Watabe, Y., Salvati, M., & Sani, E. 2010, MNRAS, 405, 2505
- Oda et al. (2017) Oda, S., Tanimoto, A., Ueda, Y., et al. 2017, ApJ, 835, 179
- Planck Collaboration et al. (2014) Planck Collaboration, Ade, P. A. R., Aghanim, N., et al. 2014, A&A, 571, A16
- Ptak et al. (2015) Ptak, A., Hornschemeier, A., Zezas, A., et al. 2015, ApJ, 800, 104
- Ricci et al. (2014) Ricci, C., Ueda, Y., Paltani, S., et al. 2014, MNRAS, 441, 3622
- Ricci et al. (2017a) Ricci, C., Bauer, F. E., Treister, E., et al. 2017a, MNRAS, 468, 1273
- Ricci et al. (2017b) Ricci, C., Trakhtenbrot, B., Koss, M. J., et al. 2017b, ApJS, 233, 17
- Rivers et al. (2015) Rivers, E., Risaliti, G., Walton, D. J., et al. 2015, ApJ, 804, 107
- Romero-Cañizales et al. (2017) Romero-Cañizales, C., Alberdi, A., Ricci, C., et al. 2017, MNRAS, 467, 2504
- Sanders et al. (2003) Sanders, D. B., Mazzarella, J. M., Kim, D.-C., Surace, J. A., & Soifer, B. T. 2003, AJ, 126, 1607
- Sanders & Mirabel (1996) Sanders, D. B., & Mirabel, I. F. 1996, ARA&A, 34, 749
- Sanders et al. (1988) Sanders, D. B., Soifer, B. T., Elias, J. H., et al. 1988, ApJ, 325, 74
- Stalevski et al. (2016) Stalevski, M., Ricci, C., Ueda, Y., et al. 2016, MNRAS, 458, 2288
- Stierwalt et al. (2013) Stierwalt, S., Armus, L., Surace, J. A., et al. 2013, ApJS, 206, 1
- Tanaka et al. (2017) Tanaka, I., Yagi, M., & Taniguchi, Y. 2017, PASJ, 69, 90
- Tanimoto et al. (2018) Tanimoto, A., Ueda, Y., Kawamuro, T., et al. 2018, ApJ, 853, 146
- Tazaki et al. (2011) Tazaki, F., Ueda, Y., Terashima, Y., & Mushotzky, R. F. 2011, ApJ, 738, 70
- Teng et al. (2015) Teng, S. H., Rigby, J. R., Stern, D., et al. 2015, ApJ, 814, 56
- Toba et al. (2019) Toba, Y., Ueda, Y., Matsuoka, K., et al. 2019, MNRAS, 484, 196
- Tueller et al. (2008) Tueller, J., Mushotzky, R. F., Barthelmy, S., et al. 2008, ApJ, 681, 113
- Ueda et al. (2007) Ueda, Y., Eguchi, S., Terashima, Y., et al. 2007, ApJ, 664, L79
- Ueda et al. (2015) Ueda, Y., Hashimoto, Y., Ichikawa, K., et al. 2015, ApJ, 815, 1
- Vasudevan & Fabian (2007) Vasudevan, R. V., & Fabian, A. C. 2007, MNRAS, 381, 1235
- Veilleux et al. (2002) Veilleux, S., Kim, D.-C., & Sanders, D. B. 2002, ApJS, 143, 315
- Weaver et al. (2010) Weaver, K. A., Meléndez, M., Mushotzky, R. F., et al. 2010, ApJ, 716, 1151
- Weedman et al. (2012) Weedman, D., Sargsyan, L., Lebouteiller, V., Houck, J., & Barry, D. 2012, ApJ, 761, 184
- Winter et al. (2009) Winter, L. M., Mushotzky, R. F., Reynolds, C. S., & Tueller, J. 2009, ApJ, 690, 1322
- Yang et al. (2015) Yang, H., Wang, J., & Liu, T. 2015, ApJ, 799, 91
- Zezas et al. (2003) Zezas, A., Ward, M. J., & Murray, S. S. 2003, ApJ, 594, L31