Co-evolving Tracing and Fault Injection with \bop
Abstract
Distributed systems are hard to reason about largely because of uncertainty about what may go wrong in a particular execution, and about whether the system will mitigate those faults. Tools that perturb executions can help test whether a system is robust to faults, while tools that observe executions can help better understand their system-wide effects. We present \bop, a tracer and fault injector for unmodified distributed systems that addresses both concerns by interposing at the system call level and dynamically reconstructing the partial order of communication events based on causal relationships. \bop’s lightweight approach to tracing and focus on simulating the effects of partial failures on communication rather than the failures themselves sets it apart from other tracing and fault injection systems. We present evidence of the promise of \bopand its approach to lightweight observation and perturbation of distributed systems.
1 Introduction
Distributed systems are all around us and yet are riddled with bugs. This should make us uneasy even if it comes as no surprise. The space of possible executions of a distributed system is exponential in the number of communicating processes and in the number of messages, making it difficult to build confidence that distributed programs of even modest complexity are free from errors. Tools that require painstaking instrumentation and fine-grained control of runtime systems, including both bug finding approaches such as software model checking [12, 17] and debugging approaches such as deterministic replay [9, 4], have made few inroads into distributed systems software quality methodologies. Instead, the field is dominated by incomplete approaches based on testing, which can be effective at finding bugs but cannot rule them out.
In the testing community, there is increasing interest in light-weight techniques for observing and perturbing executions during integration tests, such as call graph tracing [22] and targeted [7] or random [8] fault injection. These techniques make it possible to better cover the space of possible executions (e.g., by driving the system into rare cases triggered by events like machine crashes and network partitions) and better understand such events’ system-wide effects. Better still, they impose only modest overheads, allowing observability and resiliency to be built up in a pay-as-you-go fashion.
Unfortunately, these ostensibly lightweight techniques often require instrumentation at the application layer (e.g., propagating annotations to downstream calls or identifying fault interposition points), a process that must be repeated for each application. Existing tracing and fault injection techniques tend to be coarse-grained, leading to low-fidelity signals (e.g. call graphs whose nodes represent service endpoints) and high-overhead experiments (e.g. modeling crash faults by rebooting servers). Moreover, since tracing and fault injection have evolved separately, there is often an impedance mismatch between them. For example, a fine-grained fault injection system is of little use if the granularity of the tracing system is too coarse to interpret the effects of the experiments.
Our philosophy on tracing and fault infrastructure is three-fold. First, a distributed system in which independent nodes communicate via message passing will manifest any fault 111We assume the omission failure model and are concerned only with distributed bugs—i.e., those that could not be discovered using single-site fault injection tools. as the absence of messages (or explicit error such as timeout). To understand the effects of these phenomena on the processes that witness them, then, a fault injector need only focus on removing communication edges in an execution graph; thus, we can make use of a tracing framework that focuses on reconstructing communication graphs and partial orders. Second, we believe (and will provide evidence) that although the space of possible executions of a distributed system is exponentially large in the number of events, in practice some executions are significantly more likely than others; thus, even if an understanding of a system is based on witnessing schedules of executions, we can bound the number of schedules we are likely to see. Third, tracing and fault-injection should co-evolve—tracing is necessary to inform and perform targeted fault-injection, which can only perturb events in a language that is defined by the tracing infrastructure itself; thus, economy of mechanism outweighs separation of concerns.
We are building a tracing and fault injection system, \bop, which embodies our philosophy. \bopwitnesses a schedule of a distributed system execution by tracing at the system-call level and uses those system calls to reconstruct the communication graph of the system. We argue that this interposition point is not only effective at faithfully capturing the communication pattern between threads (which constitutes an adequate fault surface), but that it also manages the trade-off between generality, ease of use (as systems need not be instrumented manually), and understanding of application-level semantics. We discuss how \bopis able to effectively trace and inject faults in a distributed system because, while the space of possible executions is large, we often need only a small representation of the whole system to find bugs [14, 24], but also because these possible different execution schedules will often be consistent with the same partial order, and so are effectively the “same” execution, moving a theoretically intractable problem into the practical realm.
2 Background
Unlike traditional model checkers that identify bugs in specifications, software model checkers (SMCs) [12, 17] systematically explore the state space of actual implementations via fine-grained control of a program’s execution schedule, and backtracking as necessary. When a bug is identified in such a concurrent system, it is often challenging to reproduce when debugging. Deterministic replay systems [9, 4] make this possible by recording traces that capture non-deterministic inputs or events and then, much like SMCs, controlling the runtime schedule during replay to ensure that the same events occur in the same order. Like these “heavyweight” techniques, we want to work with arbitrary, unmodified systems by instrumenting relatively low in the stack. However, fine-grained scheduling is costly to run and implement, and is overkill for the tasks of distributed tracing and fault injection.
Lightweight approaches to observing distributed executions based on call graph tracing [21, 5, 3] have gained a great deal of popularity in recent years, and a number of businesses are devoted to the collection and analysis of call graph traces [1, 2]. These observability infrastructures, based on Google’s Dapper [22] require modifications to application code in order to propagate trace annotations (unique identifiers and other adornments) that are attached to incoming service requests to downstream service calls. This boilerplate, while relatively straightforward to write, imposes a significant burden on the application programmer and must be repeated for each application. While we wish to provide value without requiring work on the part of the application programmer, we would nevertheless like to be able to reconstruct this application-level signal from instrumentation lower in the stack.
The distributed resiliency community has long advocated combining testing methodologies with fault injection [8, 11, 13] to increase confidence that ostensibly fault-tolerant programs operate correctly under the (rare in practice) fault events that they were designed to mitigate. Although as discussed fault injection infrastructures are often used in concert with tracing, they have tended to develop as separate concerns. A stated goal of \bopis to coevolve these concerns.
The data management community has used data lineage [16, 10, 15, 19, 23] to explain query answers in much the same way that the resilience community uses call graph tracing to explain distributed executions. Lineage-driven fault injection [6, 5], a bug-finding technique that we will discuss further in Section 6, directly uses explanations of system outcomes (formal data lineage or execution traces) to automate fault injection experiments. \bopwas designed to integrate tightly with such a bug finder, providing it with traces as performing the fault injection experiments that it suggests.
3 A Partial Argument of a Partial Order
When tracing a distributed system, we often have two options: build tracing infrastructure into the application during initial development, which requires difficult forethought, or build it in afterwards, which requires a significant engineering effort that is often avoided unless necessary. Instead, if we could trace a system at a level that provides sufficient signal to reconstruct communication we could circumvent the complexity of kernel-level tracing and the overhead of application-level instrumentation. We propose tracing at the system-call level, as this is transparent to the application, can run on an unmodified system, allows easy experimentation by simulating a system on one machine, and can still derive sufficient signal to be useful for fault injection and collection of rich system traces, as we see in this section.
One significant consequence of tracing system calls is that the tracer will see a schedule of events with little ordering among them. While each observed event on a per-thread basis is ordered with respect to other events in that thread, there are no immediate constraints on event ordering between threads. Although the tracer sees a sequentially consistent execution consistent with the true partial order of events, it cannot determine a richer partial order beyond this independent collection of total orders from witnessing schedules alone.
To understand the communication structure of a program as well as to inject faults, however, more than just this weak schedule is needed. Fortunately, since we know the semantics of the system calls, we can use their meaning to glean more information from them than we could if we strictly observed them in a particular schedule. For example, a given (successful) call to accept cannot return until a paired call to connect is made, or a (successful) call to read on a socket cannot return until a causally-paired call to write is made.
The additional ordering available to us from observing socket system calls and tracking connection and data transfer is exactly the communication pattern between the threads in the system. We can use that communication pattern to derive happens-before, which characterizes the constraints between events of different threads, thus enabling fine-grained, targeted fault injection that can specify “when” in a distributed execution to inject faults based on the communication pattern rather than wall-clock time. Furthermore, this pattern can be derived during execution (as opposed to reconstructed after completion), a requirement of a fault-injection infrastructure that injects targeted faults based on moments within a trace. The mechanism for this is described in Section 4.2.
Of course, a distributed execution might be different each time it runs, as there is inherent non-determinism in message delivery and thread scheduling. While the theoretical behavior of a system is characterized by a collection of all possible partial orders of events, for the purposes of fault injection it might be sufficient to collect only a limited number of such schedules, especially if some schedules are more likely than others. The intuition behind schedules having different probabilities is straight-forward: the most significant source of non-determinism in a distributed system is the real-time order of events between threads. However, if we recognize that we will observe the events in some sequentially consistent order, and we know that the events per-thread are totally ordered, then for the purposes of comparing two schedules we can ignore the actual order we observe the events in as long as both schedules are consistent with the same partial order.
Thus, we are left with collecting schedules of distributed systems that are truly different in their communication patterns and behavior. This dramatically reduces the space of executions, down from exponential in the number of events and number of threads to the number of valid communication patterns given a single input (which, depending on the system, might still be large). We hypothesize (and provide initial evidence) that most of the time, given a consistent input, a distributed system will often produce similar partial orders, thus allowing us to construct a representation of the system’s behavior with a small set of runs and use that to inject faults.
If this is true, we open up a wealth of possibilities, because we can then trace a distributed system and inject faults repeatedly, witnessing “good” and “bad” executions, and adjusting our fault injection over time on a real system with no manual instrumentation. This is the goal of \bop—to use the application-level signal we derive in a generic, low-overhead way to inform the decisions of bug-finding frameworks and thus fully automate tracing, fault-injection, and bug-finding.
4 Box of Pain
has three components: a tracer, a tracker, and an injector. These components all operate together, watching a distributed execution unfold. When run in a loop, \bopwill determine if the execution has been seen before, allowing it to build a collection of traces that together characterize the relevant behaviors of the system. Optionally, \bopcan be run with a failure specification that indicates precisely which events to interrupt or modify as part of fault injection (which we discuss in Section 4.3).
4.1 Tracing
operates primarily through the use of ptrace, a system call that allows a process to perform introspection on another process [18]. Whenever a traced thread (tracee) issues a system call, the tracee is stopped and \bopwakes up. This occurs both for system-call entry and exit, each referred to as an event, and \bophandles each event in full before signaling the thread to resume. Each event that \bophandles is appended to a per-thread “event log”, and is thus in the order that they occur for that thread. An entry-to-syscall event is indicated like read, and a return-from-syscall event is indicated like read.
The ultimate goal of tracing is to construct a partial order of events out of the schedule that \bopobserves. Given just a per-thread event log, we have a partial order (a collection of total orders, one for each thread), but this partial order contains no constraints on events among threads. Since the communication pattern between two threads and the contraints on ordering are equivalent in our model, we can leverage the information available in a TCP connection to provide additional edges in the partial order for a given run.
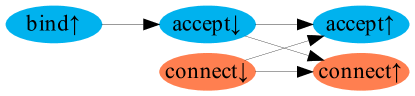
When a socket is created, it is tracked in a per-process lookup table (in a way that keeps track of changing file descriptors). During a bind event, \bopreads the process’s memory to determine the address and port that the socket is being bound to. After the subsequent accept event, a new socket is tracked (consistent with the semantics of accept). Since it is also tracing the connect-ing thread, it will see the resultant connect and connect events, the first of which provides enough information for \bopto decide which socket it is connecting to, but not necessarily which socket returned by accept the connect-ing thread is actually associated with.
To get this information, \bopissues system-calls on behalf of the tracees while handling the connect and accept events. It does this by overwriting the registers of the tracee to point to a location known to contain a syscall instruction (determined during the first event handled per-process), and setting the registers as required for the requested system call. In this case, the system calls are getsockname and getpeername, which provide sufficient information to determine the end-points of the TCP stream. The resulting partial order is shown in Figure 1.
For data transfer, we can use the tracked sockets to watch as TCP traffic is communicated between end-points. When handling a write, \boptracks the sequence number of the stream and records to which system call a particular range of data belongs. When handling a read, \boplooks through the recorded write system calls to decide which writes contributed to the data returned by the read, thus deriving an order based on the commuication pattern of data transfer. Note that one read can get data from multiple writes and one write can contribute to multiple reads, or it can be a one-to-one relationship.
While many of these system calls have variants (send instead of write, or accept4 instead of accept), the variants are similar enough that they need little additional processing. One exception is the calls sendto and recvfrom, however these calls are infrequently used for TCP communication.
Finally, while \boptraces a distributed system as a set of threads in processes on a single node, we see it as merely an engineering effort to extend the tracing infrastructure to multiple nodes. A single tracer process can run on each node, forwarding event information to a single, unified tracker node that processes schedules and computes partial orders.
4.2 Tracking
The tracing infrastructure builds a trace of a distributed system that consists of a per-thread event log, where each event can have multiple parents (as derived by the communication pattern). The trace can be serialized and viewed as a PDF, showing the communication pattern. However, executions may differ between runs, and if we want to be able to get an idea of the “true” communication pattern between nodes in a system, we’ll need to observe many of the possible schedules.
faciliates this by allowing previously collected traces to be reloaded into memory before tracing a new run. During execution, \boptries to track each loaded run by comparing the event that just occurred in the new trace to the “next” event in each loaded run. “Next” here means, “for this thread, what was the next witnessed event”. For example, if thread records events followed by , then a run is said to be “followed” if thread is witnessed executing those events in the same order, even if another thread executes some other event in between and . When a particular run cannot be followed, \bopstops tracking it. If all loaded runs are not followed, \bopfinishes tracing the execution and serializes the trace as before. If instead, at the end of the execution, a run is followed, \bopdoes not serializing the current trace since it is equivalent to the followed run.
4.3 Fault Injection
When running \bopon a distributed system, we can provide a fault specification that describes which events to perturb via fault injection. Since we are considering the space of faults to include only delay (possibly infinite) and explicit errors, \bopallows the simulation of both. The tracing infrastructure that \bopprovides, and the corresponding derivation of a partial order that reflects the communication structure of the system, faults in \bopcan be thought of in terms of specifying a particular event, which allows bug-finding software to consider faults in terms of “after thread does and thread does ”, which improves how targeted faults can be.
Delay is simulated by simply “pausing” a process by stopping and resuming it after an amount of time (or delaying it indefinitely). This kind of fault is the simplest to inject, as all that is required for the fault specification is a particular event identification. If a followed run contains such a specification, \bopwill pause the process when it observes it trying to execute that event.
Explicit error manifests more directly as \bopchanging the return value (or parameters) during a system call. For example, interrupting a connection between process and is done by changing the socket argument to connect to , thus ensuring that the connection fails, while changing the return value to a specified error code (such as -ECONNREFUSED).
We can map “real” events into our simulation space via a combination of manifesting explicit errors, pausing processes, or silently dropping communications. A lengthy garbage-collection pause can be emulated by pausing a process for some time, while a machine crash can be emulated by either stopping a process indefinitely, restarting the process, or dropping all messages after a point in the partial order. Network partitions are similar; we can observe the destinations of messages and drop them (either silently or via an error) if we simulate them crossing a network partition. Later, healing the network partition can manifest as removing those fault rules.
5 Preliminary Experiments
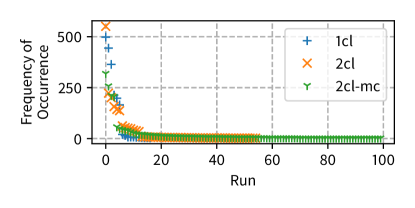
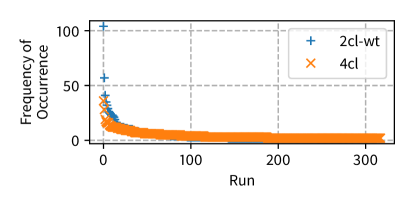
To provide an initial look at how many unique runs are generated by some small distributed systems, we ran the Redis key/value store [20] under \bop, and counted how many unique runs were generated varying different parameters: number of commands performed, and number of clients. We then re-ran our two-client scenario, but simulated network congestion by randomly forcing writes to act as if there were full TCP buffers, randomly causing writes to only actually write half or less than the system call originally would have. This was done by changing the count parameter of the write system call, reducing it to a lower value than its original value.
Figures 2 and 3 show the distribution of runs for executions by varying the parameters as described. We ran \bopfor two thousand iterations on each configuration, and the graphs show the runs that make up 99% of the resulting schedules. Each client executed a simple GET request for all experiments except the experiment where we increased the number of commands executed by each client (2cl-mc), in which case each client executed four GET and SET commands. In all cases, the distribution rapidly drops after a high initial value, indicating that the majority of runs manifests as one of a few schedules, and, while there is a long tail, we can understand much of the system behavior without needing an intractable number of schedules. Interestingly, increasing the number of commands issued by each client did not dramatically impact the width of the distribution, indicating that bugs arising from complex series of interactions would be easier to find. While the results in Figure 3 have longer tails, both of these have the same shape and 99% of runs fall within approximately 300 already known schedules after 2000 iterations (which took well under an hour to generate).
6 The Future for \bop
As excited as we are to introduce \bopand to argue its potential, we must admit that we have barely begun using it. In this section we describe what comes next, from first steps to a (we believe) far-reaching vision.
combines two concerns—tracing and fault injection—that are typically considered separate. Before tackling our larger ambitions, we plan to demonstrate its efficacy for both independent tasks. It remains to be shown that it is possible to extrapolate from our low-level traces something akin to the application-level signal provided by call graph tracing. Tracing a large-scale microservice-based application with \bopand showing that the call graphs (e.g., obtained using Zipkin) could be inferred from our traces would provide evidence that technologies like \bopcould obviate the need for painstaking application-level instrumentation in some cases. Similarly, we will compare \bopwith the state-of-the-art in distributed fault injection. While most of these approaches focus on triggering [8] or simulating [7] fault events such as machine crashes, I/O errors, memory pressure and corruption, system load, and so on, our approach focuses instead on simulating the observable effects of such faults from the perspective of other processes with which they communicate. We expect that this much smaller fault surface will be sufficient to uncover bugs in fault tolerance logic and much more efficient at doing so.
From the beginning our intention has been to use \bopin a tight loop with a trace-driven bug finder such as LDFI. To date, LDFI has shown promise in verifying protocols [6] as well in finding bugs in large-scale, microservice-based applications [5]. In the former, programs must be specified in a custom relational logic language (similar to solvers such as Alloy [14]), limiting applicability to real-world systems. In the latter, the systems must already be instrumented to support call graph tracing and fine-grained fault injection. By addressing both concerns at the system level, \boppromises to open up the LDFI approach to arbitrary, uninstrumented systems, including distributed data managment systems, configuration services, and messages queues.
7 Conclusion
In our field there are a great many things that are possible in theory but impractical in practice—so much so that the idea is a cliche. However, it is a rare day on which we learn that something which is not possible in theory is not merely possible, but practical in practice. \bop’s design for tracing and tracking is predicated on the idea that fault injection naturally fits with tracing; after all, if you want targeted fault injection, what better place to do it than in the tracer itself? The coevolution of these technologies will open a wealth of possibilities that we can make use of to further close the gap between the bugs we can easily find and the bugs we could find if only we had sufficient tracing, a bug-finder, and infrastructure support—all without the need for tracing forethought or huge engineering efforts. We have initial evidence that not only is it possible to trace a distributed system at the system call level and recover happens-before such that we can decide and target faults to inject, but we can do this without the non-determinism becoming intractible. We are excited to keep exploring this work, and evaluating more complex systems, looking for bugs, and further evaluating our hypothesis.
References
- [1] Honeycomb. https://honeycomb.io/, 2016. Accessed 2019-03-01.
- [2] Lightstep. http://lightstep.com/, 2016. Accessed 2019-03-01.
- [3] The OpenTracing Project. http://opentracing.io/, 2016. Accessed 2019-03-01.
- [4] Gautam Altekar and Ion Stoica. ODR: Output-deterministic replay for multicore debugging. In Proceedings of the ACM SIGOPS 22Nd Symposium on Operating Systems Principles (SOSP ’09), pages 193–206. ACM, 2009.
- [5] Peter Alvaro, Kolton Andrus, Ali Basiri, Lorin Hochstein, Casey Rosenthal, and Chris Sanden. Automating Failure Testing Research at Internet Scale. In submission.
- [6] Peter Alvaro, Joshua Rosen, and Joseph M Hellerstein. Lineage-driven fault injection. In Proceedings of the 2015 ACM SIGMOD International Conference on Management of Data, SIGMOD ’15, pages 331–346. ACM, 2015.
- [7] Netflix Technical Blog. FIT : Failure Injection Testing. http://techblog.netflix.com/2014/10/fit-failure-injection-testing.html, 2014. Accessed 2019-03-01.
- [8] Netflix Technology Blog. The Netflix Simian Army. http://techblog.netflix.com/2011/07/netflix-simian-army.html, July 2011. Accessed 2019-03-01.
- [9] Yunji Chen, Shijin Zhang, Qi Guo, Ling Li, Ruiyang Wu, and Tianshi Chen. Deterministic replay: A survey. ACM Computing Surveys, 48(2):17:1–17:47, September 2015.
- [10] James Cheney, Laura Chiticariu, and Wang-Chiew Tan. Provenance in Databases: Why, How, and Where. Foundations and Trends in Databases, 1(4):379–474, April 2009.
- [11] Scott Dawson, Farnam Jahanian, and Todd Mitton. ORCHESTRA: A Fault Injection Environment for Distributed Systems. In In Proceedings of the International Symposium on Fault-Tolerant Computing (FTCS ’96), 1996.
- [12] Patrice Godefroid. Model Checking for Programming Languages Using VeriSoft. In In Proceedings of The 24th ACM SIGPLAN-SIGACT Symposium on Principles of Programming Languages (POPL ’97), 1997.
- [13] Haryadi S. Gunawi, Thanh Do, Pallavi Joshi, Peter Alvaro, Joseph M. Hellerstein, Andrea C. Arpaci-Dusseau, Remzi H. Arpaci-Dusseau, Koushik Sen, and Dhruba Borthakur. FATE and DESTINI: A framework for cloud recovery testing. In In Proceedings of the 8th USENIX Conference on Networked Systems Design and Implementation (NSDI ’11), pages 238–252. USENIX Association, 2011.
- [14] Daniel Jackson. Software Abstractions: Logic, Language, and Analysis. The MIT Press, 2006.
- [15] Sven Köhler, Bertram Ludäscher, and Daniel Zinn. First-Order Provenance Games. In In Search of Elegance in the Theory and Practice of Computation, volume 8000 of LNCS. Springer, 2013.
- [16] Alexandra Meliou and Dan Suciu. Tiresias: The Database Oracle for How-to Queries. In Proceedings of the 2012 ACM SIGMOD International Conference on Management of Data, SIGMOD ’12, pages 337–348, 2012.
- [17] Madanlal Musuvathi, David Y. W. Park, Andy Chou, Dawson R. Engler, and David L. Dill. CMC: A Pragmatic Approach to Model Checking Real Code. SIGOPS Operating Systems Review, 36(SI):75–88, December 2002.
- [18] The Linux Man-pages Project. ptrace(2). Linux Programmers Manual, 2018.
- [19] Sean Riddle, Sven Köhler, and Bertram Ludäscher. Towards Constraint Provenance Games. In 6th USENIX Workshop on the Theory and Practice of Provenance (TaPP ’14).
- [20] Salvatore Sanfilippo. Redis. https://redis.io, 2019. Accessed 2019-03-01.
- [21] Yuri Shkuro. Jaeger: Uber’s Distributed Tracing System. https://uber.github.io/jaeger/, March 2017. Accessed 2019-03-01.
- [22] Benjamin H. Sigelman, Luiz André Barroso, Mike Burrows, Pat Stephenson, Manoj Plakal, Donald Beaver, Saul Jaspan, and Chandan Shanbhag. Dapper, a Large-Scale Distributed Systems Tracing Infrastructure. Technical report, Google, Inc., 2010. http://research.google.com/archive/papers/dapper-2010-1.pdf; Accessed 2019-03-01.
- [23] Yang Wu, Andreas Haeberlen, Wenchao Zhou, and Boon Thau Loo. Answering Why-not Queries in Software-defined Networks with Negative Provenance. In Proceedings of the 12th ACM Workshop on Hot Topics in Networks (HotNets ’13), pages 3:1–3:7. ACM, 2013.
- [24] Ding Yuan, Yu Luo, Xin Zhuang, Guilherme Renna Rodrigues, Xu Zhao, Yongle Zhang, Pranay U. Jain, and Michael Stumm. Simple testing can prevent most critical failures: An analysis of production failures in distributed data-intensive systems. In Proceedings of the 11th USENIX Conference on Operating Systems Design and Implementation (OSDI ’14), pages 249–265. USENIX Association, 2014.