Laplace Landmark Localization
Abstract
Landmark localization in images and videos is a classic problem solved in various ways. Nowadays, with deep networks prevailing throughout machine learning, there are revamped interests in pushing facial landmark detectors to handle more challenging data. Most efforts use network objectives based on or norms, which have several disadvantages. First of all, the generated heatmaps translate to the locations of landmarks (i.e. confidence maps) from which predicted landmark locations (i.e. the means) get penalized without accounting for the spread: a high-scatter corresponds to low confidence and vice-versa. For this, we introduce a LaplaceKL objective that penalizes for low confidence. Another issue is a dependency on labeled data, which are expensive to obtain and susceptible to error. To address both issues, we propose an adversarial training framework that leverages unlabeled data to improve model performance. Our method claims state-of-the-art on all of the 300W benchmarks and ranks second-to-best on the Annotated Facial Landmarks in the Wild (AFLW) dataset. Furthermore, our model is robust with a reduced size: the number of channels (i.e. 0.0398 MB) is comparable to the state-of-the-art in real-time on CPU. Thus, this work is of high practical value to real-life application.
1 Introduction
To localize landmarks is to find pixel locations in visual media corresponding to points of interest. In face alignment, these points correspond to face parts. For bodies and hands, landmarks correspond to projections of joints on to the camera plane [31, 35]. Historically, landmark detection and shape analysis tasks date back decades: from Active Shape Models [4] to Active Appearance Models [3], with the latter proposed to analyze and detect facial landmarks.
A need for more advanced models to handle increasingly tricky views has triggered revamped interest in facial landmark localization. Thus, came a wave of different types of deep neural architectures that pushed state-of-the-art on more challenging datasets. These modern-day networks are trained end-to-end on paired labeled data , where is the image and are the actual landmark coordinates. Many of these used encoder-decoder style networks to generate feature maps (i.e. heatmaps) to transform into pixel coordinates [23, 24, 40]. The network must be entirely differentiable to train end-to-end. Hence, the layer (or operation) for transforming the heatmaps to pixel coordinates must be differentiable [15]. Note that each of the heatmaps corresponds to the coordinates of a landmark. Typically, the softargmax operation determines the location of a landmark as the expectation over the generated 2D heatmaps. Thus, metrics like or determine the distance between the actual and predicted coordinates , i.e. .
There are two critical shortcomings of the methodology discussed above. (1) These losses only penalize for differences in mean values in coordinate space, and with no explicit penalty for the variance of heatmaps. Thus, the generated heatmaps are highly scattered: high variance means low confidence. (2) This family of objectives is entirely dependent on paired training samples (i.e. ). However, obtaining high-quality data for this is expensive and challenging. Not only does each sample require several marks, but unintentional, and often unavoidable, labels are of pixel-level marks subject to human error (i.e. inaccurate and imprecise ground-truth labels). All the while, plenty of unlabeled face data are available for free.
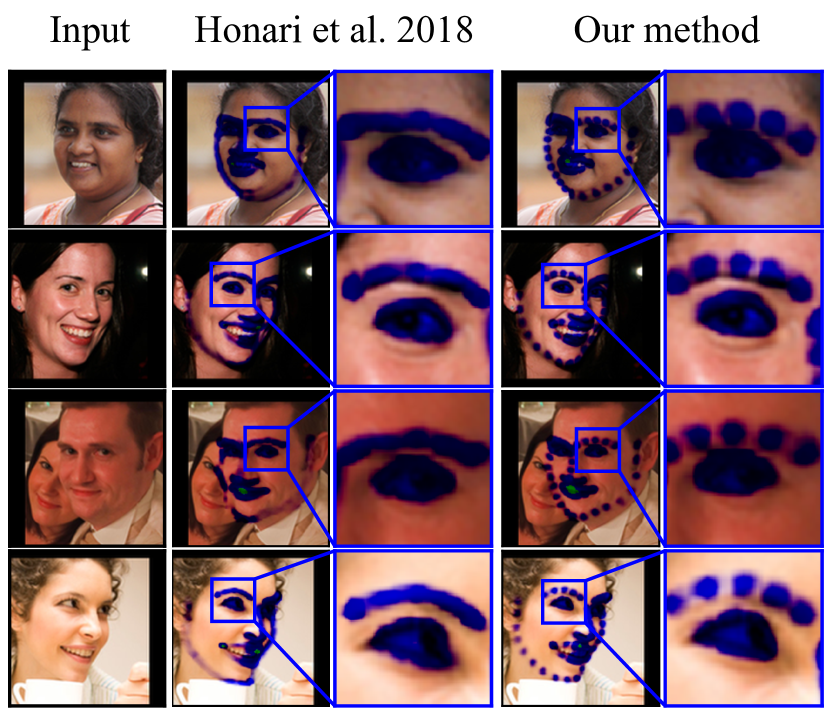
In this paper, we propose a practical framework to satisfy the two shortcomings. Thus, our first contribution alleviates the first issue. For this, we introduce a new loss function that penalizes for the difference in distribution defined by location and scatter (Fig. 1). Independently, we treat landmarks as random variables with distributions, from which the KL-divergence between the predicted and ground-truth distributions defines the loss. Hence, the goal is to match distributions, parameterized by both a mean and variance, to yield heatmaps of less scatter (i.e. higher confidence). We call this objective the LaplaceKL loss.
Our second contribution is an adversarial training framework for landmark localization. We propose this to tackle the problem of paired data requirements by leveraging unlabeled data for free. We treat our landmark detection network as a generator () of normalized heatmaps (i.e. probability maps) that pass to the discriminator () to learn to distinguish between the true and generated heatmaps. This allows for large amounts of unlabeled data to further boost the performance of our LaplaceKL-based models. In the end, proves to improve the predictive power of the LaplaceKL-based model by injecting unlabeled data into the pipeline during training. As supported by experiments, the adversarial training framework complements the proposed LaplaceKL loss (i.e. an increase in unlabeled data results in a decrease in error). To demonstrate this, we first show the effectiveness of the proposed loss by claiming state-of-the-art without adversarial training– to then further improve with more unlabeled data added during training!
Furthermore, we reduced the size of the model by using , , , and the original number of convolution filters, with the smallest costing only 79 Kb on disk. We show an accuracy drop for models trained with the proposed LaplaceKL as far less than the others trained with a softargmax-based loss. So again, it is the case that more unlabeled training data results in less of a performance drop at reduced sizes. It is essential to highlight that variants of our model at or of larger size than the original size compare well to the existing state-of-the-art. We claim that the proposed contributions are instrumental for landmark detection models used in real-time production, mobile devices, and other practical purposes.
Our contributions are three-fold: (1) A novel Laplace KL-divergence objective to train landmark localization models that are more certain about predictions; (2) An adversarial training framework that leverages large amounts of unlabeled data during training; (3) Experiments that show our model outperforms recent works in face landmark detection, along with ablation studies that, most notably, reveal our model compares well to state-of-the-art at its original size (i.e. 160 Kb) and in real-time (i.e. 20 fps).
2 Related work
In this section, we review relevant works on landmark localization and generative adversarial network (GAN).
Landmark localization has been of interest to researchers for decades. At first, most methods were based on Active Shape Models [4] and Active Appearance Models [3]. Then, Cascaded Regression Methods (CRMs) were introduced, which operate sequentially; starting with the average shape, then incrementally shifting the shape closer to the target shape. CRMs offer high speed and accuracy (i.e. 1,000 fps on CPU [26, 19]).
More recently, deep-learning-based approaches have prevailed in the community due to end-to-end learning and improved accuracy. Initial works mimicked the iterative nature of cascaded methods using recurrent convolutional neural networks [24, 32, 37, 38]. Besides, several have been several methods for dense landmark localization [12, 18] and 3D face alignment [33, 47] proposed: all of which are fully-supervised and, thus, require labels for each image.
Nowadays, there is an increasing interest in semi-supervised methods for landmark localization. Recent work used a sequential multitasking method which was capable of injecting labels of two types into the training pipeline, with one type constituting the annotated landmarks and the other type consisting of facial expressions (or hand-gestures) [15]. The authors argued that the latter label type was more easily obtainable, and showed the benefits of using both types of annotations by claiming state-of-the-art on several tasks. Additionally, they explore other semi-supervised techniques (e.g. equivariance loss). In [8], a supervision-by-registration method was proposed, which significantly utilized unlabeled videos for training a landmark detector. The fundamental assumption was that the neighboring frames of the detected landmarks should be consistent with the optical flow computed between the frames. This approach demonstrated a more stable detector for videos, and improved accuracy on public benchmarks.
Landmark localization data resources have significantly evolved as well, with the 68-point mark-up scheme of the MultiPIE dataset [11] widely adopted. Despite the initial excitement for MultiPIE throughout the landmark localization community [48], it is now considered one of the easy datasets captured entirely in a controlled lab setting. A more challenging dataset, Annotated Facial Landmarks in the Wild (AFLW) [20], was then released with up to 21 facial landmarks per face (i.e. occluded or “invisible” landmarks were not marked). Finally, came the 300W dataset made-up of face images from the internet, labeled with the same 68-point mark-up scheme as MultiPIE, and promoted as a data challenge [27]. Currently, 300W is among the most widely used benchmarks for facial landmark localization. In addition to 2D datasets, the community created several datasets annotated with 3D keypoints [1].
GANs were recently introduced [10], quickly becoming popular in research and practice. GANs have been used to generate images [25] and videos [28, 34], and to do image manipulation [9], text-to-image[42], image-to-image [45], video-to-video [36] translation and re-targeting [30].
An exciting feature of GANs are the ability to transfer visual media across different domains. Thus, various semi-supervised and domain-adaptation tasks adopted GANs [6, 13, 29, 41]. Many have leveraged synthetic data to improve model performance on real data. For example, a GAN transferred images of human eyes from the real domain to bootstrap training data [29]. Other researchers used them to synthetically generate photo-realistic images of outdoor scenes, which also aided in bettering performance in image segmentation [13]. Sometimes, labeling images captured in a controlled setting is manageable (i.e. versus an uncontrolled setting). For instance, 2D body pose annotations were available in-the-wild, while 3D annotations mostly were for images captured in a lab setting. Therefore, images with 3D annotations were used in adversarial training to predict 3D human body poses as seen in-the-wild [41]. [6] formulated one-shot recognition as a problem data imbalance and augmented additional samples in the form of synthetically generated face embeddings.
Our work differs from these others in several ways. Firstly, a majority, if not all, used a training objective that only accounts for the location of landmarks [15, 32, 38], i.e. no consideration for variance (i.e. confidence). Thus, landmarks distributions have been assumed to be describable with a single parameter (i.e. a mean). Networks trained this way yield an uncertainty about the prediction, while still providing a reasonable location estimate. To mitigate this, we explicitly parametrize the distribution of landmarks using location and scale. For this, we propose a KL-divergence based loss to train the network end-to-end. Secondly, previous works used GANs for domain adaptation in some fashion. In this work, we do not perform any adaptation between domains as in [13, 29], nor do we use any additional training labels as in [15]. Specifically, we have do the quality assessment on the predicted heatmaps for a given image. The resulting gradients are used to improve the ability of the generator to detect landmarks. We show that both contributions improve accuracy when used separately. Then, the two contributions are combined to further boost state-of-the-art results.
3 Method
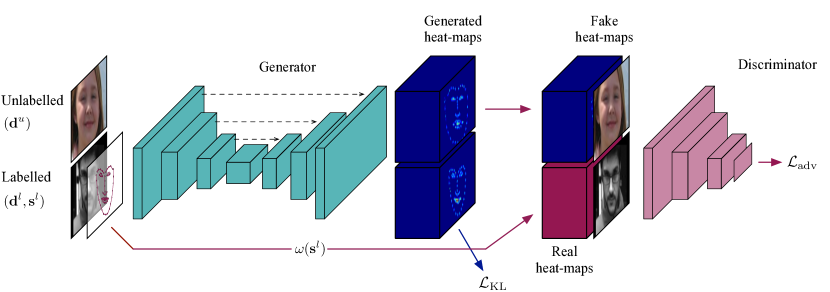
Our training framework utilizes both labeled and unlabeled data during training. Shown in Fig. 2 are the high-level graphical depiction of cases where labels are available (blue arrows) and unavailable (red arrows). Notice the framework has two branches, supervised (Eq. 3) and unsupervised (Eq. 7), where only the supervised (blue arrow)uses labels to train. Next, are details for both branches.
3.1 Fully Supervised Branch
We define the joint distribution of the image and landmarks as , where is the total number of landmarks. The form of the distribution is unknown; however, joint samples are available when labels are present (i.e. ). During training, we aim to learn a conditional distribution modeled by a neural network with parameters . Landmarks are then detected done by sampling . We now omit parameters from notation for cleaner expressions. The parameter values are learned by maximizing the likelihood that the process described by the model did indeed produce the data that was observed, i.e. trained by minimizing the following loss function w.r.t. its parameters:
| (1) |
Alternatively, it is possible to train a neural network to predict normalized probability maps(i.e. heatmaps): , where and each represents a normalized probability map for landmark , where . To get the pixel locations, one could perform the argmax operation over the heatmaps by setting ). However, this operation is not differentiable and, therefore, unable to be trained end-to-end.
A differentiable variant of argmax (i.e. softargmax [2]) was recently used to localize landmarks [15]. For the 1D case, the softargmax operation is expressed
| (2) | ||||
where is the predicted probability mass at location , is the normalization factor, and is the temperature factor controlling the predicted distribution [2]. We denote coordinate in boldface (i.e. ), and write 2D softargmax operation as with .
Essentially, the softargmax operation is the expectation of the pixel coordinate over the selected dimension. Hence, the softargmax-based loss assumes the underlying distribution is describable by just its mean (i.e. location), regardless of how sure a prediction, the objective then is to match mean values. To avoid cases in which the trained model is uncertain about the predicted mean, while still yielding a low error, we parametrize the distribution using , where is the mean or the location and is the variance or the scale, respectfully, for the selected distribution.
We want the model to be certain about the predictions (i.e. a small variance or scale). We consider two parametric distributions and with and . We define a function to compute the scale (or variance) of the predicted heatmaps using the location, where the locations are now the expectation of being a landmark in the heatmap space. Thus, , where , for Laplacian, and for Gaussian. Thus, and ) are used to parameterize a Laplace (or Gaussian) distribution for the predicted landmarks .
Denoting the true conditional distribution of the landmarks as we define the objective as follows:
| (3) |
where is the KL-divergence. We assumed a true distribution for the case of Gaussian (i.e. , where is the ground-truth locations of the landmarks). For the case with Laplace, we sought . KL-divergence conveniently has a closed-form solution for this family of exponential distributions [14]. Alternatively, sampling yields an approximation. The blue arrow in Fig. 2 represent the labeled branch of the framework.
Statistically speaking, given two estimators with different variances, we would prefer one that has a smaller variance (see [7] for an analysis of the bias-variance trade-off). A lower variance implies higher confidence in the prediction. To this end, we found an objective measuring distance between distributions is accurate and robust. The neural network must satisfy an extra constraint on variance and, thus, yields predictions of higher certainty. See higher confident heatmaps in Fig. 1 and Fig. 3. The experimental evaluation further validates this (Table 2 and Table 3). Also, Fig. 5 shows sample results.
3.2 Unsupervised Branch
The previous section discusses several objectives to train the neural network with the available paired or fully labeled data (i.e. ). We denote data samples with the superscript to distinguish them from unpaired or unlabeled data . In general, it is difficult for a human to label many images with landmarks. Hence, unlabeled data are abundant and easier to obtain, which calls for capitalizing on this abundant data to improve training. In order to do so, we adapt the adversarial learning framework for landmark localization. We treat our landmarks predicting network as a generator (), . discriminator () takes the form , where is a tensor concatenation operation . We define the real samples for as , where generates the true heatmaps given the locations of the ground-truth landmarks. Fake samples are given by . With this notation, and we define the min-max objective for landmark localization as:
| (4) |
where writes as:
| (5) |
In this setting, provided an input image, the goal of is to learn to decipher between the real and fake heatmaps from appearance. Thus, the goal of is to produce fake heatmaps that closely resemble the real. Within this framework, intends to provide additional guidance for by learning from both labeled and unlabeled data. The objective in Eq. 4 is solved using alternating updates.
3.3 Training
We fused the softargmax-based and adversarial losses as
| (6) |
with the KL-divergence version of the objective defined as:
| (7) |
with the weight for the adversarial loss . This training objective includes both labeled and unlabeled data in the formulation. In the experiments, we show that this combination significantly improves the accuracy of our approach. We also argue that the softargmax-based version cannot fully utilize the unlabeled data since the predicted heatmaps differ too much from the real heatmaps. See Algorithm 1 for the training procedure for steps of the proposed model. We show the unlabeled branch of the framework is shown graphically in red arrows (Fig. 2).
| Layers | Tensor Size | |
|---|---|---|
| Input | RGB image, no data augmentation | 80 x 80 x 3 |
| Conv() | 3 3 64, LReLU, DROP, MAX | 40 40 64 |
| Conv() | 3 3 64, LReLU, DROP, MAX | 20 20 64 |
| Conv() | 3 3 64, LReLU, DROP, MAX | 10 10 64 |
| Conv() | 3 3 64, LReLU, DROP, MAX | 5 5 64 |
| Conv() | 1 1 64 , LReLU, DROP, UP | 10 10 128 |
| Conv() | 5 5 128, LReLU | 20 20 128 |
| Conv( | 1 1 64 , LReLU, DROP, UP | 20 20 128 |
| Conv() | 5 5 128, LReLU, DROP | 40 40 128 |
| Conv() | 1 1 64 , LReLU, DROP, UP | 40 40 128 |
| Conv() | 5 5 128, LReLU, DROP | 80 80 128 |
| Conv() | 1 1 64 , LReLU, DROP, UP | 80 80 128 |
| Conv() | 5 5 128, LReLU, DROP | 80 80 128 |
| Conv() | 1 1 68, LReLU, DROP | 80 80 68 |
| Output | 1 1 68 | 80 80 68 |
3.4 Implementation
We follow the ReCombinator network (RCN) initially proposed in [16]. Specifically, we use a 4-branch RCN as our base model, with input images and output heatmaps of size 8080. Convolutional layers of the encoder consist of 64 channels, while the convolutional layers of the decoder output 64 channels out of the 128 channels at its input (i.e. 64 channels from the previous layer concatenated with the 64 channels skipped over the bottleneck via branching). We applied Leaky-ReLU, with a negative slope of 0.2, on all but the last convolution layer. See Table 1 for details on the generator architecture. Drop-out followed this, after all but the first and last activation. We use Adam optimizer with a learning rate of 0.001 and weight decay of . In all cases, networks were trained from scratch, using no data augmentation nor any other ’training tricks.’
was a 4-layered PatchGAN [17]. Before each convolution layer Gaussian noise () was added [34], and then batch-normalization (all but the top and bottom layers) and Leaky-ReLU with a negative slope of 0.2 (all but the top layer). The original RGB image was stacked on top of the heatmaps from and fed as the input of (Fig. 2). Thus, takes in ( + 3) channels. We set for 2. Pytorch was used to implement the entire framework. An important note to make is that models optimized with Laplace distribution consistently outperformed the Gaussian-based. For instance, our LaplaceKL baseline had a Normalized Mean Square Error (NMSE) of 4.01 on 300W, while Gaussian-based got 4.71. Thus, the sharper,“peakier” Laplace distribution proved to be more numerically stable under current network configuration, as Gaussian required a learning rate a magnitude smaller to avoid vanishing gradients. Indeed, we used Laplace.
| AFLW | 300W | |||
| Common | Challenge | Full | ||
| SDM [39] | 5.43 | 5.57 | 15.40 | 7.52 |
| LBF [26] | 4.25 | 4.95 | 11.98 | 6.32 |
| MDM [32] | - | 4.83 | 10.14 | 5.88 |
| TCDCN [44] | - | 4.80 | 8.60 | 5.54 |
| CFSS [46] | 3.92 | 4.73 | 9.98 | 5.76 |
| CFSS [21] | 2.17 | 4.36 | 7.56 | 4.99 |
| RCSR [38] | - | 4.01 | 8.58 | 4.90 |
| RCN+ (LELT) [15] | 1.59 | 4.20 | 7.78 | 4.90 |
| CPM SBR [8] | 2.14 | 3.28 | 7.58 | 4.10 |
| Softargmax | 2.26 | 3.48 | 7.39 | 4.25 |
| Softargmax+D(10K) | - | 3.34 | 7.90 | 4.23 |
| Softargmax+D(30K) | - | 3.41 | 7.99 | 4.31 |
| Softargmax+D(50K) | - | 3.41 | 8.06 | 4.32 |
| Softargmax+D(70K) | - | 3.34 | 8.17 | 4.29 |
| LaplaceKL | 1.97 | 3.28 | 7.01 | 4.01 |
| LaplaceKL+D(10K) | - | 3.26 | 6.96 | 3.99 |
| LaplaceKL+D(30K) | - | 3.29 | 6.74 | 3.96 |
| LaplaceKL+D(50K) | - | 3.26 | 6.71 | 3.94 |
| LaplaceKL+D(70K) | - | 3.19 | 6.87 | 3.91 |
4 Experiments
We evaluated the proposed on two widely used benchmark datasets for face alignment. No data augmentation techniques used when training our models nor was the learning rate dropped: this leaves no ambiguity into whether or not the improved performance came from training tricks or the learning component itself. All results for the proposed were from models trained for 200 epochs.
We next discuss the metric used to evaluate performance, NMSE, with differences between datasets in the normalization factor. Then, the experimental settings, results, and analysis for each dataset are covered separately. Finally, ablation studies show characterizations of critical hyper-parameters and, furthermore, the robustness of the proposed LaplaceKL+D(70K) with a comparable performance with just the number of feature channels and 20 fps.
4.1 Metric
Per convention [1, 5, 27], NMSE, a normalized average of euclidean distances, was used. Mathematically speaking:
| (8) |
where the number of visible landmarks set as , are the indices of the visible landmark, the normalization factor depends on the face size, and and are the ground-truth and predicted coordinates, respectfully. The face size ensured that the NMSE scores across faces of different size were fairly weighted. Following predecessors, NMSE was used to evaluate both datasets, except with different points referenced to calculate . The following subsections provide details for finding .
4.2 300W + MegaFace
The 300W dataset is amongst the most popular datasets for face alignment. It has 68 visible landmarks (i.e. ) for 3,837 images (i.e. 3,148 training and 689 test). We followed the protocol of the 300W challenge [27] and evaluated using NMSE (Eq. 8), where is set as the inter-ocular distance (i.e. distance between outer corners of the eyes). Per convention, we evaluated different subsets of 300W (i.e. common and challenge, which together form full).
We compared the performance of the proposed objective trained in a semi-supervised fashion. During training, 300W dataset made-up the labeled data (i.e. real), and a random selection from MegaFace provided the unlabeled data (i.e. fake) [22]. MTCNN111https://github.com/davidsandberg/facenet was used to detect five landmarks (i.e. eye pupils, corners of the mouth, and middle of nose and chin) [43], which allowed for similar face crops from either dataset. Specifically, we extended the square hull that enclosed the five landmarks by 2 the radii in each direction. In other words, the smallest bounding box spanning the 5 points (i.e. the outermost points lied on the parameter), and then transformed from rectangles-to-squares with sides of length 2. Note that the midpoint of the original rectangle was held constant to avoid shift translations (i.e. rounded up a pixel if the radius was even and extended in all directions).
| L-KL+D(70K) | SAM+D(80K) | L-KL+D(70K) | SAM+D(80K) | ||
|
|||||
The LaplaceKL+D(70K) model obtained state-of-the-art on 300W, yielding the lowest error on 300W (Table 2 (300W columns)). LaplaceKL+D() and softargmax+D() denote the models trained with unlabeled data, where representing the number of unlabeled images added from MegaFace.
First, notice that LaplaceKL trained without unlabeled data still achieved state-of-the-art. The LaplaceKL-based models then showed relative improvements with more unlabeled data added. The softargmax-based models cannot fully take advantage of the unlabeled data without minimizing for variance (i.e. generates heatmaps of less confidence and, thus, more spread). Our LaplaceKL, on the other hand, penalizes for spread (i.e. scale), making the job of more challenging. As such, LaplaceKL-based models benefit from increasing amounts of unlabeled data.
Also, notice the largest gap between the baseline models [8] and our best LaplaceKL+D(70K) model on the different sets of 300W. Adding more unlabeled helps more (i.e. LaplaceKL vs. LaplaceKL+D(70K) improvement is about 2.53%). However, it is essential to use samples not covered in the labeled set. To demonstrate this, we set the real and fake sets to 300W (i.e. in the second term of Eq. 7). NMSE results for this experiment are listed as follows: LaplaceKL+D(300W) 4.06 (baseline– 4.01) and softargmax+D(300W) 4.26 (baseline– 4.24). As hypothesized, all the information from the labeled set had already been extracted in the supervised branch, leaving no benefit of using the same set in the unsupervised branch. Therefore, more unlabeled data yields more hard negatives to train with, which improves the accuracy of the rarely seen samples (Table 2 (300W challenge set)). Our best model was 2.7% better than [8] on easier samples (i.e. common), 4.7% better on average (i.e. full), and, moreover, 9.8% better on the more difficult (i.e. challenge), 4.7% better on average (full), and, moreover, 9.8% better on the more difficult (challenge). These results further highlight the advantages of training with the proposed LaplaceKL loss, along with the adversarial training framework.
Additionally, the adversarial framework further boosted our 300W baseline was further boosted by (i.e. more unlabeled data yields a lower NMSE). Specifically, we demonstrated this by pushing state-of-the-art of the proposed on 300W from a NMSE of 4.01 to 3.91 (i.e. no unlabeled data to 70K unlabeled pairs, respectfully). There were boosts at each step size of full (i.e. larger NMSE).
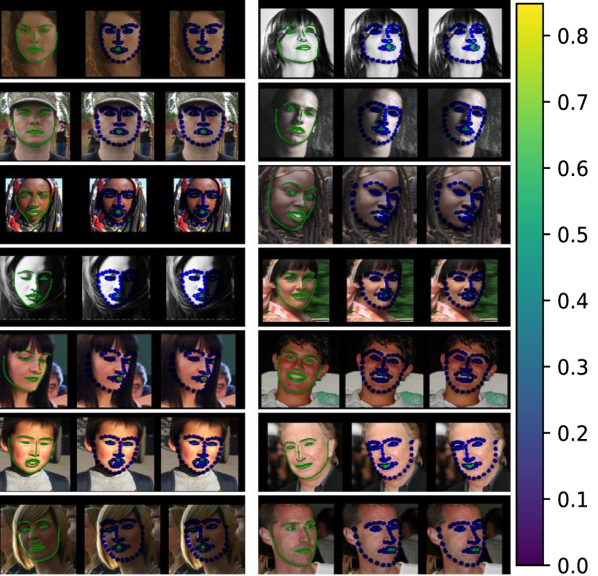
We randomly selected unlabeled samples for LaplaceKL+D(70K) and softargmax+D(70K) to visualize predicted heatmaps (Fig. 3). In each case, the heatmaps produced by the softargmax-based models spread wider, explaining the worsened quantitative scores (Table 2). The models trained with the proposed contributions tend to yield higher probable pixel location (i.e. a more concentrated predicted heatmaps). For most images, the heatmaps generated by models trained with the LaplaceKL loss have distributions for landmarks that were more confident and properly distributed: our LaplaceKL+D(70K) yielded heatmaps that vary 1.02 pixels from the mean, while softargmax+D(70K) has a variation of 2.59. Learning the landmark distributions with our LaplaceKL loss is conceptually and theoretically intuitive (Fig. 1). Moreover, it is experimentally proven (Table 2).
4.3 The AFLW dataset
We evaluated the LaplaceKL loss on the AFLW dataset [20]. AFLW contains 24,386 faces with up to 21 landmarks annotations and 3D head pose labels. Following [15], 20,000 faces were used for training with the other 4,386 for testing. We ignored the two landmarks for the left and right earlobes, leaving up to 19 landmarks per face [8].
Since faces of AFLW have such variety head poses, most faces have landmarks out of view (i.e. missing). Thus, most samples were not annotated with the complete 19 landmarks, meaning that it does not allow for a constant sized tensor (i.e. real heatmaps) for the adversarial training. Therefore, we compared the softargmax and KL-based objectives with existing state-of-the-art. The face size for the NMSE was the square root of the bounding box hull [1].
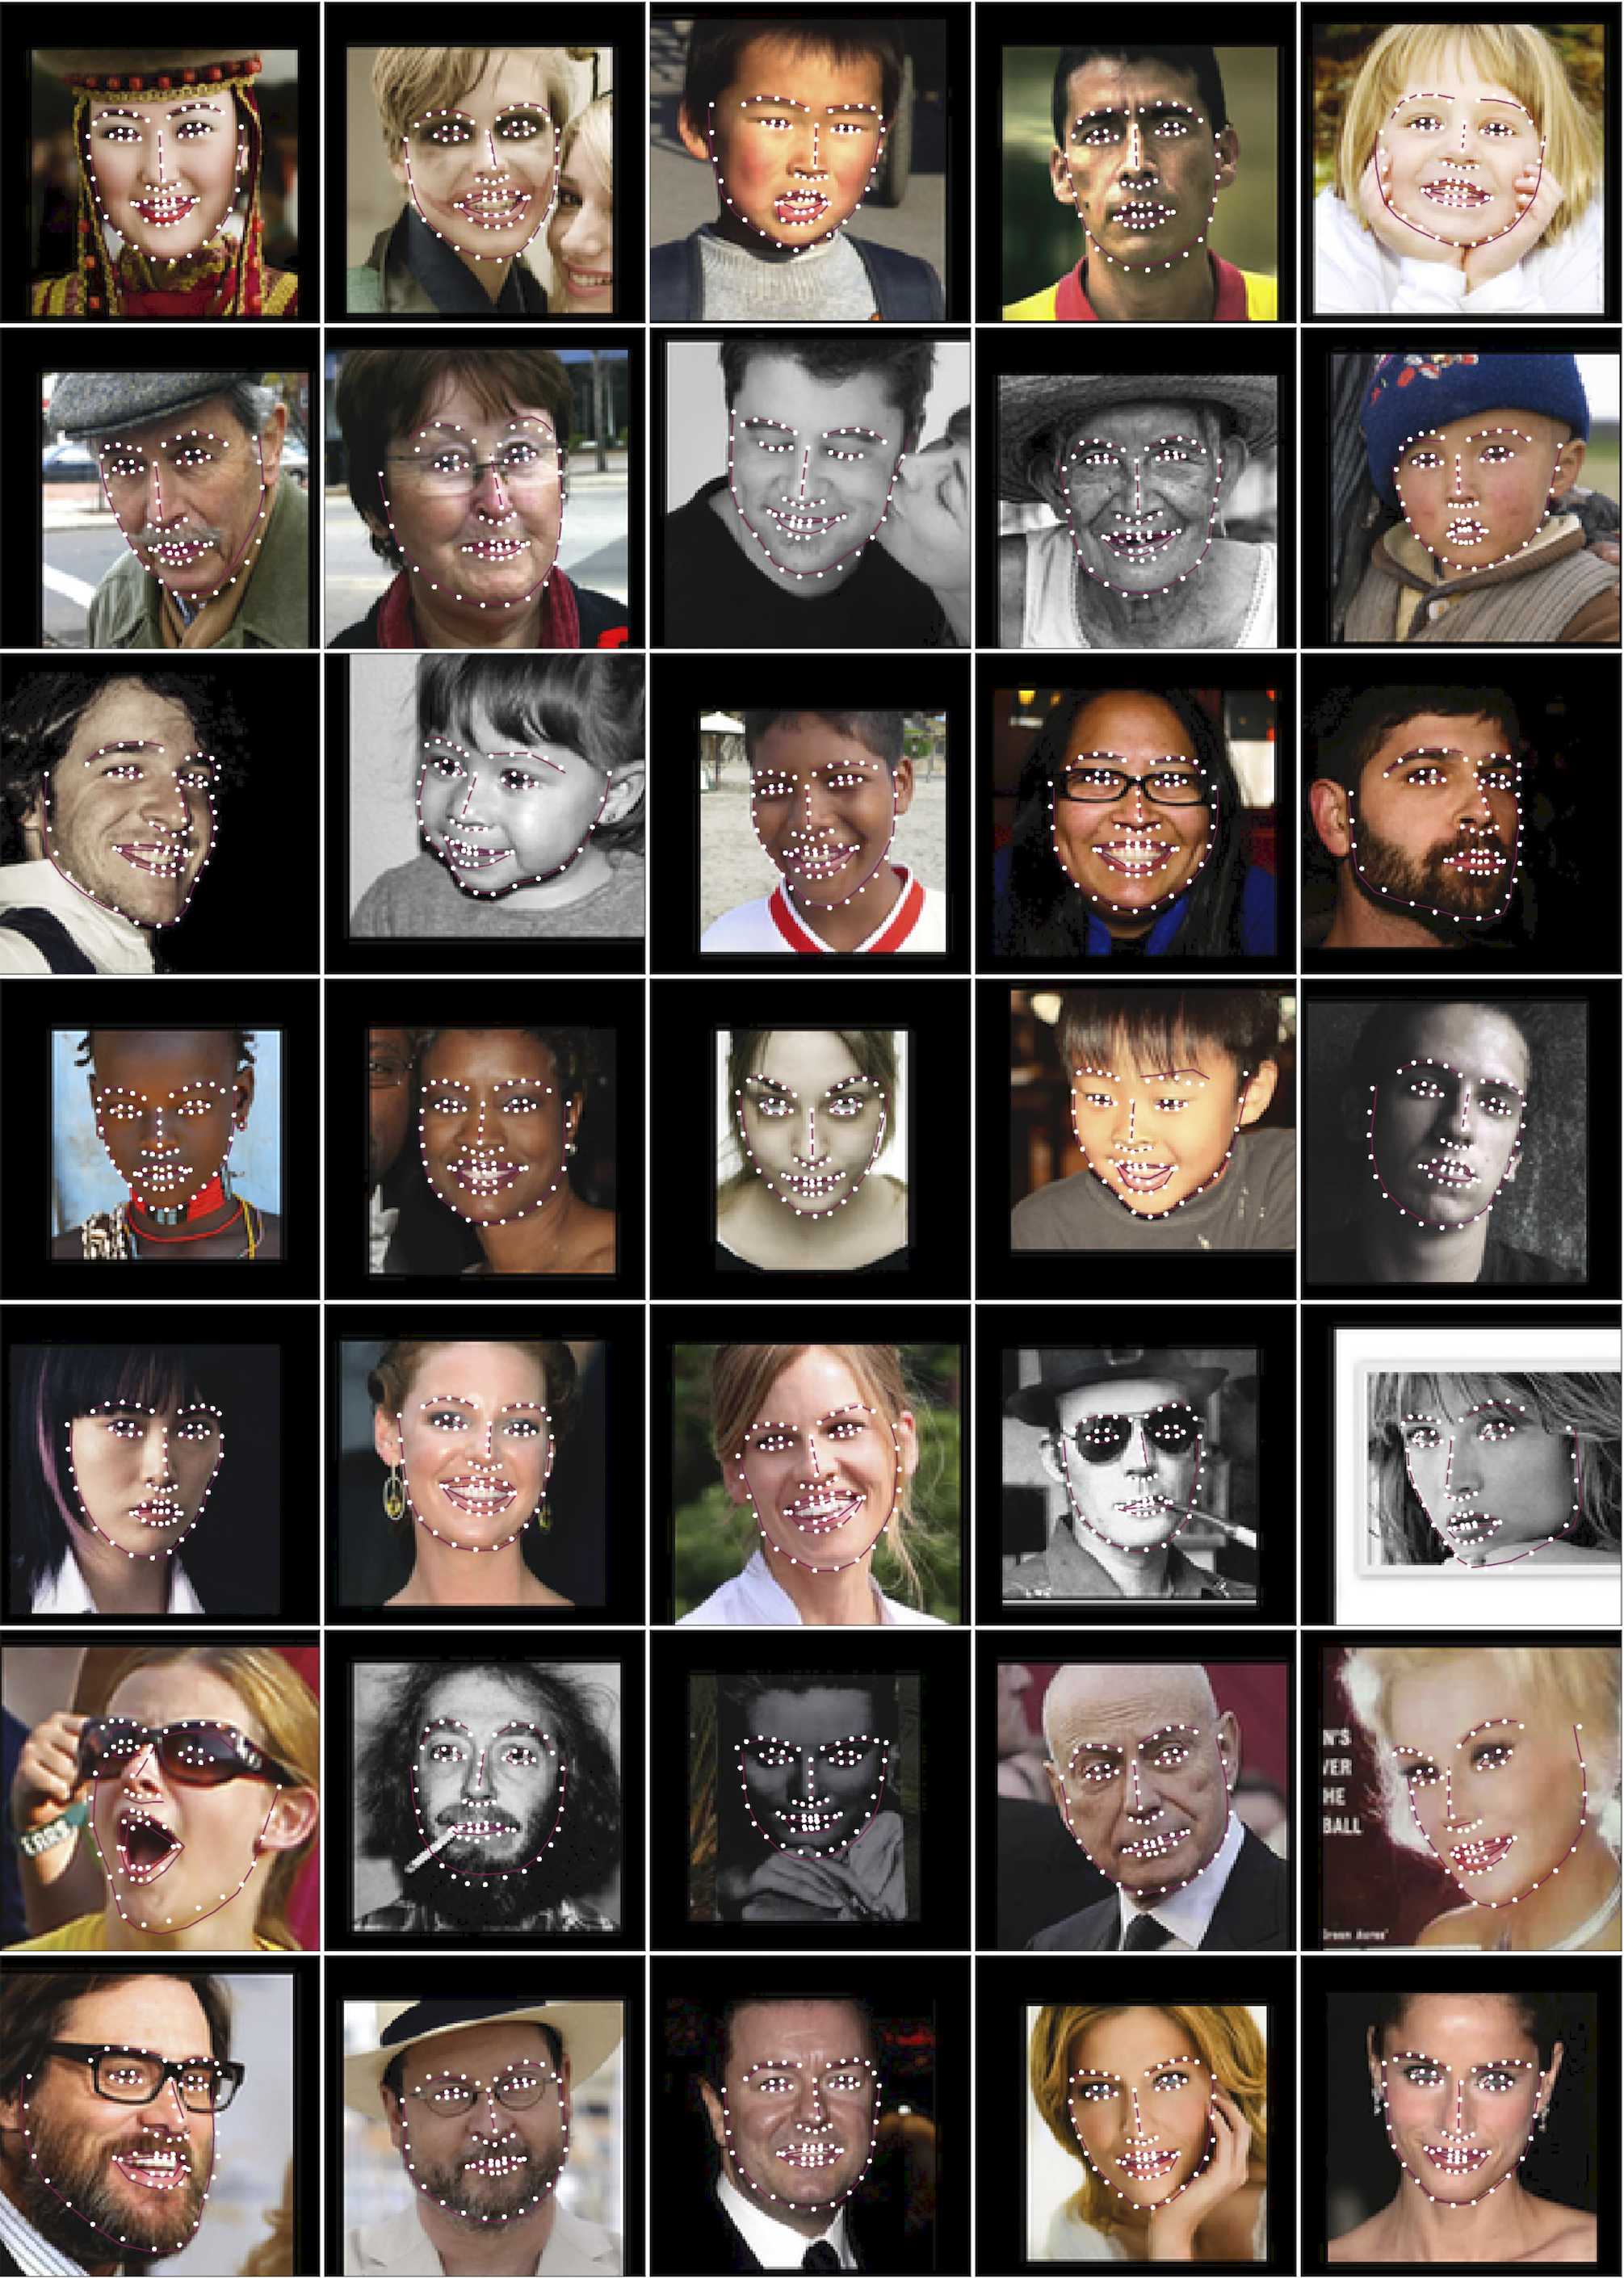
Our LaplaceKL-based model scored results comparable to existing state-of-the-art (i.e. RCN+ (LELT) [15]) on the larger, more challenging AFLW dataset while outperforming all others. It is essential to highlight here that [15] puts great emphasis on data augmentation, while we do not apply any. Also, since landmarks are missing in some samples (i.e. no common reference points exist across all samples), we were unable to prepare faces for our semi-supervised component– a subject for future work.
| Number of parameters, millions | |||||
| Softargmax | 9.79 | 6.86 | 4.83 | 4.35 | 4.25 |
| Softargmax+D(70K) | 9.02 | 6.84 | 4.85 | 4.38 | 4.29 |
| LaplaceKL | 7.38 | 5.09 | 4.39 | 4.04 | 4.01 |
| LaplaceKL+D(70K) | 7.01 | 4.85 | 4.30 | 3.98 | 3.91 |
| Storage (MB) | 0.076 | 0.162 | 0.507 | 1.919 | 7.496 |
| Speed (fps) | 26.51 | 21.38 | 16.77 | 11.92 | 4.92 |
4.4 Ablation Study
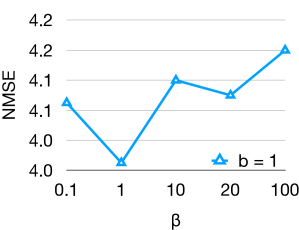
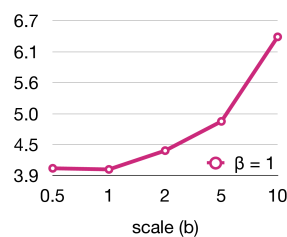
The error is next measured as a function of model size (Table 3), along with different values (Eq. 2) and scales used to parameterize the Laplacian (Fig. 4). The latter characterizes the baseline and supports the values used for these hyper-parameters, while the former reveals a critical characteristic for the practicality of the proposed.
Specifically, we decreased the model size by reducing the number of channels at each convolutional layer by factors of 2. The softargmax-based model worsened by about 47% and 79% in NMSE at an and the channel count, respectfully (i.e. 4.25 6.86 and 9.79). LaplaceKL, on the other hand, decreased by about 24% with an and 59% with a the number of channels (i.e. 4.01 5.09 and 7.38, respectfully). Our model trained with unlabeled data (i.e. LaplaceKL+D(70K)) dropped just about 21% and 57% at factors of 8 and 16, respectfully (i.e. 3.91 4.85 and 7.01). In the end, LaplaceKL+D(70K) proved best with reduced sizes: with 0.040M parameters, it still compares to previous state-of-the-art [15, 21, 38], which is a clear advantage. For instance, SDM [39], requires 1.693M parameters (25.17MB) for 7.52 in NMSE (300W full).222https://github.com/tntrung/sdm_face_alignment Yet our smallest and next-to-smallest get 7.01 and 4.85 with only 0.174M (0.076 MB) and 0.340M (0.166 MB) parameters.
The processing speed also boosts with fewer channels (i.e. to train and at inference). For instance, the model reduced by a factor of 16 processes 26.51 frames per second (fps) on a CPU of Macbook Pro (i.e. 2.8GHz Intel Core i7), with the original running at 4.92 fps. Our best LaplaceKL-based model proved robust to size reduction, obtaining 4.85 NMSE at 21.38 fps when reduced by .
5 Conclusions
We demonstrated the benefits of the proposed LaplaceKL loss and leveraging unlabeled data in an adversarial training framework. Hypothetically and empirically, we showed the importance of penalizing a landmark predictor’s uncertainty. Thus, training with the proposed objective yields predictions of higher confidence, outperforming previous state-of-the-art methods. We also revealed the benefits of adding unlabeled training data to boost performance via adversarial training. In the end, our model performs state-of-the-art on all three splits of the renown 300W (i.e. common, challenge, and full), and second-to-best on the AFLW benchmark. Also, we demonstrate the robustness of the proposed by significantly reducing the number of parameters. Specifically, with the number of channels (i.e. 170Kb on disk), the proposed still yields an accuracy comparable to the previous state-of-the-art in real-time (i.e. 21.38 fps). Thus, the contributions of the proposed framework are instrumental for models intended for use in real-world production.
References
- [1] Adrian Bulat and Georgios Tzimiropoulos. How far are we from solving the 2d & 3d face alignment problem? (and a dataset of 230,000 3d facial landmarks). In IEEE International Conference on Computer Vision (ICCV), 2017.
- [2] Olivier Chapelle and Mingrui Wu. Gradient descent optimization of smoothed information retrieval metrics. Information retrieval, 13(3):216–235, 2010.
- [3] Timothy F Cootes, Gareth J Edwards, and Christopher J Taylor. Active appearance models. IEEE Transactions on Pattern Analysis and Machine Intelligence (TPAMI), (6):681–685, 2001.
- [4] Timothy F Cootes and Christopher J Taylor. Active shape models—‘smart snakes’. In British Machine Vision Conference (BMVC), 1992.
- [5] David Cristinacce and Timothy F Cootes. Feature detection and tracking with constrained local models. In British Machine Vision Conference (BMVC), volume 1, page 3. Citeseer, 2006.
- [6] Zhengming Ding, Yandong Guo, Lei Zhang, and Yun Fu. One-shot face recognition via generative learning. In Automatic Face and Gesture Recognition (FG), pages 1–7. IEEE, 2018.
- [7] Pedro Domingos. A unified bias-variance decomposition. In International Conference on Machine Learning (ICML), pages 231–238, 2000.
- [8] Xuanyi Dong, Shoou-I Yu, Xinshuo Weng, Shih-En Wei, Yi Yang, and Yaser Sheikh. Supervision-by-registration: An unsupervised approach to improve the precision of facial landmark detectors. In IEEE Conference on Computer Vision and Pattern Recognition (CVPR), pages 360–368, 2018.
- [9] Zhenglin Geng, Chen Cao, and Sergey Tulyakov. 3d guided fine-grained face manipulation. In IEEE Conference on Computer Vision and Pattern Recognition (CVPR), 2019.
- [10] Ian Goodfellow, Jean Pouget-Abadie, Mehdi Mirza, Bing Xu, David Warde-Farley, Sherjil Ozair, Aaron Courville, and Yoshua Bengio. Generative adversarial nets. In Advances in Neural Information Processing Systems (NIPS), pages 2672–2680, 2014.
- [11] Ralph Gross, Iain Matthews, Jeffrey Cohn, Takeo Kanade, and Simon Baker. Multi-pie. Image and Vision Computing, 28(5), 2010.
- [12] Riza Alp Güler, George Trigeorgis, Epameinondas Antonakos, Patrick Snape, Stefanos Zafeiriou, and Iasonas Kokkinos. Densereg: Fully convolutional dense shape regression in-the-wild. In IEEE Conference on Computer Vision and Pattern Recognition (CVPR), 2017.
- [13] Judy Hoffman, Eric Tzeng, Taesung Park, Jun-Yan Zhu, Phillip Isola, Kate Saenko, Alexei A Efros, and Trevor Darrell. Cycada: Cycle-consistent adversarial domain adaptation. 2017.
- [14] Matthew D Hoffman, David M Blei, Chong Wang, and John Paisley. Stochastic variational inference. The Journal of Machine Learning Research, 14(1):1303–1347, 2013.
- [15] Sina Honari, Pavlo Molchanov, Stephen Tyree, Pascal Vincent, Christopher Pal, and Jan Kautz. Improving landmark localization with semi-supervised learning. In IEEE Conference on Computer Vision and Pattern Recognition (CVPR), 2018.
- [16] Sina Honari, Jason Yosinski, Pascal Vincent, and Christopher Pal. Recombinator networks: Learning coarse-to-fine feature aggregation. In IEEE Conference on Computer Vision and Pattern Recognition (CVPR), pages 5743–5752, 2016.
- [17] Phillip Isola, Jun-Yan Zhu, Tinghui Zhou, and Alexei A Efros. Image-to-image translation with conditional adversarial networks. arXiv preprint arXiv:1611.07004, 2017.
- [18] László A Jeni, Jeffrey F Cohn, and Takeo Kanade. Dense 3d face alignment from 2d videos in real-time. In Automatic Face and Gesture Recognition (FG), 2015.
- [19] Vahid Kazemi and Josephine Sullivan. One millisecond face alignment with an ensemble of regression trees. In IEEE Conference on Computer Vision and Pattern Recognition (CVPR), 2014.
- [20] Martin Koestinger, Paul Wohlhart, Peter M Roth, and Horst Bischof. Annotated facial landmarks in the wild: A large-scale, real-world database for facial landmark localization. In IEEE International Conference on Computer Vision (ICCV) Workshop, pages 2144–2151, 2011.
- [21] Jiang-Jing Lv, Xiaohu Shao, Junliang Xing, Cheng Cheng, Xi Zhou, et al. A deep regression architecture with two-stage re-initialization for high performance facial landmark detection. In IEEE Conference on Computer Vision and Pattern Recognition (CVPR), 2017.
- [22] Aaron Nech and Ira Kemelmacher-Shlizerman. Level playing field for million scale face recognition. In IEEE Conference on Computer Vision and Pattern Recognition (CVPR), 2017.
- [23] Alejandro Newell, Kaiyu Yang, and Jia Deng. Stacked hourglass networks for human pose estimation. In European Conference on Computer Vision (ECCV), pages 483–499. Springer, 2016.
- [24] Xi Peng, Rogerio S Feris, Xiaoyu Wang, and Dimitris N Metaxas. Red-net: A recurrent encoder–decoder network for video-based face alignment. International Journal of Computer Vision (IJCV), 2018.
- [25] Alec Radford, Luke Metz, and Soumith Chintala. Unsupervised representation learning with deep convolutional generative adversarial networks. arXiv preprint arXiv:1511.06434, 2015.
- [26] Shaoqing Ren, Xudong Cao, Yichen Wei, and Jian Sun. Face alignment at 3000 fps via regressing local binary features. In IEEE Conference on Computer Vision and Pattern Recognition (CVPR), pages 1685–1692, 2014.
- [27] Christos Sagonas, Georgios Tzimiropoulos, Stefanos Zafeiriou, and Maja Pantic. 300 faces in-the-wild challenge: The first facial landmark localization challenge. In IEEE International Conference on Computer Vision (ICCV) Workshop, 2013.
- [28] Masaki Saito, Eiichi Matsumoto, and Shunta Saito. Temporal generative adversarial nets with singular value clipping. In IEEE International Conference on Computer Vision (ICCV), 2017.
- [29] Ashish Shrivastava, Tomas Pfister, Oncel Tuzel, Joshua Susskind, Wenda Wang, and Russell Webb. Learning from simulated and unsupervised images through adversarial training. In IEEE Conference on Computer Vision and Pattern Recognition (CVPR), 2017.
- [30] Aliaksandr Siarohin, Stéphane Lathuilière, Sergey Tulyakov, Elisa Ricci, and Nicu Sebe. Animating arbitrary objects via deep motion transfer. In IEEE Conference on Computer Vision and Pattern Recognition (CVPR), 2018.
- [31] James S Supancic, Grégory Rogez, Yi Yang, Jamie Shotton, and Deva Ramanan. Depth-based hand pose estimation: data, methods, and challenges. In IEEE Conference on Computer Vision and Pattern Recognition (CVPR), pages 1868–1876, 2015.
- [32] George Trigeorgis, Patrick Snape, Mihalis A Nicolaou, Epameinondas Antonakos, and Stefanos Zafeiriou. Mnemonic descent method: A recurrent process applied for end-to-end face alignment. In IEEE Conference on Computer Vision and Pattern Recognition (CVPR), pages 4177–4187, 2016.
- [33] Sergey Tulyakov, László A Jeni, Jeffrey F Cohn, and Nicu Sebe. Viewpoint-consistent 3d face alignment. IEEE Transactions on Pattern Analysis and Machine Intelligence (TPAMI), 2018.
- [34] Sergey Tulyakov, Ming-Yu Liu, Xiaodong Yang, and Jan Kautz. Mocogan: Decomposing motion and content for video generation. 2018.
- [35] Lichen Wang, Bin Sun, Joseph Robinson, Taotao Jing, and Yun Fu. Ev-action: Electromyography-vision multi-modal action dataset. arXiv preprint arXiv:1904.12602, 2019.
- [36] Ting-Chun Wang, Ming-Yu Liu, Jun-Yan Zhu, Guilin Liu, Andrew Tao, Jan Kautz, and Bryan Catanzaro. Video-to-video synthesis. arXiv preprint arXiv:1808.06601, 2018.
- [37] Wei Wang, Sergey Tulyakov, and Nicu Sebe. Recurrent convolutional face alignment. In Asian Conference on Computer Vision (ACCV), pages 104–120. Springer, 2016.
- [38] Wei Wang, Sergey Tulyakov, and Nicu Sebe. Recurrent convolutional shape regression. IEEE Transactions on Pattern Analysis and Machine Intelligence (TPAMI), 2018.
- [39] Xuehan Xiong and Fernando De la Torre. Supervised descent method and its applications to face alignment. In IEEE Conference on Computer Vision and Pattern Recognition (CVPR), pages 532–539, 2013.
- [40] Jing Yang, Qingshan Liu, and Kaihua Zhang. Stacked hourglass network for robust facial landmark localisation. In IEEE Conference on Computer Vision and Pattern Recognition (CVPR) Workshop, pages 79–87, 2017.
- [41] Wei Yang, Wanli Ouyang, Xiaolong Wang, Jimmy Ren, Hongsheng Li, and Xiaogang Wang. 3d human pose estimation in the wild by adversarial learning. In IEEE Conference on Computer Vision and Pattern Recognition (CVPR), 2018.
- [42] Han Zhang, Tao Xu, Hongsheng Li, Shaoting Zhang, Xiaogang Wang, Xiaolei Huang, and Dimitris Metaxas. Stackgan: Text to photo-realistic image synthesis with stacked generative adversarial networks. In IEEE International Conference on Computer Vision (ICCV), 2017.
- [43] Kaipeng Zhang, Zhanpeng Zhang, Zhifeng Li, and Yu Qiao. Joint face detection and alignment using multitask cascaded convolutional networks. IEEE Signal Processing Letters, 23(10):1499–1503, 2016.
- [44] Zhanpeng Zhang, Ping Luo, Chen Change Loy, and Xiaoou Tang. Facial landmark detection by deep multi-task learning. In European Conference on Computer Vision (ECCV), pages 94–108. Springer, 2014.
- [45] Jun-Yan Zhu, Taesung Park, Phillip Isola, and Alexei A Efros. Unpaired image-to-image translation using cycle-consistent adversarial networks. 2017.
- [46] Shizhan Zhu, Cheng Li, Chen Change Loy, and Xiaoou Tang. Face alignment by coarse-to-fine shape searching. In IEEE Conference on Computer Vision and Pattern Recognition (CVPR), pages 4998–5006, 2015.
- [47] Xiangyu Zhu, Zhen Lei, Xiaoming Liu, Hailin Shi, and Stan Z Li. Face alignment across large poses: A 3d solution. In IEEE Conference on Computer Vision and Pattern Recognition (CVPR), pages 146–155, 2016.
- [48] Xiangxin Zhu and Deva Ramanan. Face detection, pose estimation, and landmark localization in the wild. In IEEE Conference on Computer Vision and Pattern Recognition (CVPR), pages 2879–2886. IEEE, 2012.