Structural and magnetic properties of GdCo5-xNix
Abstract
GdCo5 may be considered as two sublattices—one of Gd and one of Co—whose magnetizations are in antiparallel alignment, forming a ferrimagnet. Substitution of nickel in the cobalt sublattice of GdCo5 has been investigated to gain insight into how the magnetic properties of this prototype rare-earth/transition-metal magnet are affected by changes in the transition metal sublattice. Polycrystalline samples of GdCo5-xNix for 0 5 were synthesized by arc melting. Structural characterization was carried out by powder x-ray diffraction and optical and scanning electron microscope imaging of metallographic slides, the latter revealing a low concentration of Gd2(Co, Ni)7 lamellae for . Compensation—i.e. the cancellation of the opposing Gd and transition metal moments— is observed for at a temperature which increases with Ni content; for larger , no compensation is observed below 360 K. A peak in the coercivity is seen at at 10 K coinciding with a minimum in the saturation magnetization. Density-functional theory calculations within the disordered local moment picture reproduce the dependence of the magnetization on Ni content and temperature. The calculations also show a peak in the magnetocrystalline anisotropy at similar Ni concentrations to the experimentally-observed coercivity maximum.
I Introduction
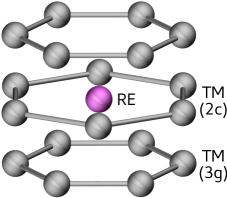
The RETM5 [(RE = rare earth; TM = transition metal)] family of materials have widely ranging magnetic properties owing to the differing number of 4 electrons found in the RE elements. These materials crystallize into a hexagonal lattice (the CaCu5 type structure, space group , Fig. 1) with a unit cell consisting of layers with a central RE atom surrounded by TM atoms in positions, alternating with layers of TM atoms in the positions Kumar (1988). One pertinent example is SmCo5, a permanent magnet which can be favored over Nd-Fe-B magnets for its superior high-temperature performance (Curie temperature of around 1020 K Strnat et al. (1967), as opposed to approximately 580 K for Nd-Fe-B magnets Sagawa et al. (1984); Croat et al. (1984)). Another member of this family is GdCo5, where the symmetry of the Gd shell causes crystal-field effects to vanish Kuz’min and Tishin (2008). The absence of crystal-field effects make GdCo5 a particularly useful system to study the rare-earth/transition-metal interaction via both theory and experiment.
GdCo5 is ferrimagnetic. Starting from K its magnetization increases with increasing temperature reaching a maximum at around 800 K Nesbitt et al. (1959); Nassau et al. (1960). With a further increase in temperature, the spontaneous magnetization decreases to zero at the Curie temperature (1014 K) Buschow (1977). This unusual temperature dependence is a consequence of the Gd moments disordering more rapidly with temperature than the Co moments Yermolenko (1980); Patrick et al. (2017).
Doping a RETM5 material can change its magnetic properties in a controlled manner Patrick et al. (2017); Bajorek et al. (2011); Grechishkin et al. (2006); de Oliveira et al. (2011); Buschow and Brouha (1976); Chuang et al. (1982, 1981); Liu et al. (1991); Burzo and Pop (1999); Drzazga et al. (1989). Here, only doping of the TM sublattice is considered. The effects of doping on coercive field and saturation magnetization have been studied for single crystals of GdCo5-xCux by Grechishkin et al. Grechishkin et al. (2006) and later by de Oliveira et al. de Oliveira et al. (2011). The Cu reduces the TM sublattice magnetization. Both papers report a peak in coercivity at a composition of . This is found to be the compensation composition of this intermetallic at room temperature, where the (Co,Cu) sublattice magnetization exactly cancels (fully compensates) the Gd sublattice magnetization. A peak in coercivity was also found in YCo5-xNix Buschow and Brouha (1976) and for RECo5-xNix (RE = Sm, La, Y, Th and Ce) Chuang et al. (1982) for certain compositions. It is interesting that RECo5 compounds containing nonmagnetic REs such as Y and La still exhibit a peak in coercivity, despite not having a compensation composition. Buschow and Brouha (Ref. 14) suggested that the presence of narrow Bloch walls in YCo5-xNix is primarily responsible for the high coercivity observed for certain compositions.
In a previous work Patrick et al. (2017) we prepared polycrystalline samples of GdCo5-xTMx and YCo5-xTMx (TM = Ni and Fe) with and single crystal GdCo5 and YCo5, and compared the experimentally determined magnetic properties of these samples with theoretical calculations made using density-functional theory. An increase (decrease) in magnetization was observed for Fe (Ni) doping. The calculations showed that substituting Ni onto the Co lattice led to Ni preferentially occupying the site, although experimentally this may depend on the method of sample preparation. The doping site was not found to have a large effect on magnetization, but did affect the Curie temperature, with a larger change for the site doping. However, possible effects on the coercivity and magnetocrystalline anisotropy were not explored in the paper, nor were concentrations with .
The magnitude of the Ni moment in GdCo5-xNix is very small Bajorek et al. (2011) compared to that of Co and Gd (in GdCo5, the Co moment is /atom at both the and the sites and the Gd moment is Patrick et al. (2017)), hence the (Co, Ni) sublattice magnetization is expected to decrease with increasing Ni content. The fully substituted material GdNi5 is ferrimagnetic, but the main contribution to the magnetization comes from the ferromagnetic Gd sublattice, giving a Curie temperature of 32 K Gignoux et al. (1976); Bajorek et al. (2011). At absolute zero at a particular composition for GdCo5-xNix the (Co, Ni) sublattice magnetization will fully compensate the Gd sublattice magnetization. The compensation composition at absolute zero will fulfill the condition . Taking approximate zero temperature values for the moments of Co, Ni, and Gd (1.6, 0.6, 7/f.u. [formula unit]), respectively, the compensation composition is . At other compositions there may exist a finite compensation temperature where the different disordering of the Gd and (Co, Ni) sublattice magnetizations again leads to compensation.
Chuang et al. Chuang et al. (1981) replaced Co with Ni in GdCo5-xNix for measuring magnetization versus temperature at 12 kOe for several compositions, focusing primarily on temperatures from 300 to 1015 K, with the exception of GdCo2Ni3 and GdCoNi4 for which measurements were taken over the ranges of 77–1015 K and 77–300 K, respectively. Therefore, for compositions with , any compensation point at temperatures lower than 300 K would not have been observed. GdCo5-xNix has been investigated by Liu et al. Liu et al. (1991) for in order to determine the intersublattice RE/TM coupling constant. Magnetization compensation has also been studied in Gd(Co4-xNix)Al Burzo and Pop (1999), where increased Ni content was observed to increase the compensation temperature and in RE(Co4-xFexB) (RE = Gd and Dy) Drzazga et al. (1989), where the compensation temperature was reduced for increased Fe content.
In this paper the magnetic behavior of polycrystalline powders and buttons of GdCo5-xNix is reported for temperatures from 5 to 360 K for , 0.5, 1, 1.25, 1.28, 1.3, 1.5, 2, 2.5, 3, 3.5, 4, and 5. The compensation temperature, coercivity and magnetization at 70 kOe are presented as a function of . This extends the previous work of Chuang et al. Chuang et al. (1981) to a temperature range in which the compensation point can be observed for . The behavior is then analyzed with the help of density functional theory calculations within the disordered local moment picture Gyorffy et al. (1985); Staunton et al. (2006), calculating the composition-dependent magnetization, coercivity, and magnetocrystalline anisotropy. The calculations provide microscopic insight into the macroscopic quantities observed experimentally, demonstrating the utility of the joint computational/experimental approach in understanding the behavior of RE/TM permanent magnets.
II Methodology
II.1 Experimental approach
Polycrystalline samples of the series GdCo5-xNix were synthesized by arc melting the constituent elements on a water cooled copper hearth under an argon atmosphere. The starting elements (99% purity) were taken in the stoichiometric ratios with 1% excess of Gd to compensate for losses during melting. To ensure homogeneity, the ingots were flipped and remelted at least three times. Annealing for 10 days at 950 ∘C was tried to improve phase homogeneity, as discussed by Buschow and den Broeder Buschow and den Broeder (1973). However, analysis of the annealed samples (via the same methods described below) showed no convincing evidence that annealing promotes the 1:5 [Gd:(Co, Ni)] phase formation over the neighboring phases of 2:17 and 2:7, and so as-cast samples were used (provided they were found to be sufficiently phase pure, as described in the remainder of this section).
The structures were characterized by powder x-ray diffraction using a Panalytical Empryean diffractometer with Co radiation. To confirm the phase content, metallographic slides were prepared from slices of ingots mounted in Epomet-F plastic and polished using progressively finer diamond suspensions. Optical microscopy and scanning electron microscopy (SEM) imaging of the slides were used to further examine the structure.
Magnetization measurements were made as a function of temperature and applied field using a Quantum Design Magnetic Property Measurement System (MPMS) superconducting quantum interference device (SQUID) magnetometer. Free to rotate powders were used to obtain the best estimate of saturation magnetization. The magnetization vs temperature, , data were taken in a 10 kOe field with the temperature decreasing from 360 to 10 K at a rate of 3 K/min. The magnetization versus field [] data were taken at 10 K (5 K for , 0.5, and 1) by first applying a 70 kOe field then collecting the magnetization data at incrementally decreasing fields (until 0 kOe). Polycrystalline buttons were fixed to a sample holder using GE varnish to measure coercivity in an Oxford Instruments vibrating sample magnetometer. The buttons were fixed in this manner to prevent sample rotation, and thus get a more accurate measurement of coercivity. The coercivities were determined from four quadrant hysteresis loops starting at 70 kOe, as the coercivity is known to depend on the initial applied field Katayama et al. (1976).
II.2 Theoretical approach
The magnetic properties of Ni-doped GdCo5 were calculated at zero and finite temperature using density-functional theory within the disordered local moment (DFT-DLM) picture Gyorffy et al. (1985). In this approach, both the temperature-induced local moment disorder and the compositional disorder from the Ni doping are modeled using the coherent potential approximation (CPA) within the Korringa-Kohn-Rostocker (KKR) multiple-scattering formulation of DFT Ebert et al. . A detailed description of this approach applied to Ni-doped GdCo5 is given in Ref. 10; here the computational details specific to this work are given.
The calculations were performed on the CaCu5 structure with lattice parameters fixed at Å, Å, which were measured for pristine GdCo5 at 300 K Andreev and Zadvorkin (1991). As discussed in Section IV the Ni dopants were set to either occupy the 2 and 3 crystal sites with equal probability, or to preferentially sit at the 2 crystal sites. The KKR multiple-scattering equations were solved within the atomic sphere approximation (ASA) with Wigner-Seitz radii of (1.58, 1.39, 1.42) Å at the (Gd, 2, 3) sites.
The KKR-CPA code Hutsepot Däne et al. (2009) was used to generate scalar-relativistic potentials for the magnetically-ordered (ferrimagnetic) state, expanding the key quantities in an angular momentum basis up to a maximum quantum number . Exchange and correlation were treated within the local spin-density approximation Vosko et al. (1980), with the local self-interaction correction Lüders et al. (2005) also applied to the Gd- electrons.
The scalar-relativistic potentials were then fed into our own code which solves the fully-relativistic scattering problem in the presence of magnetic disorder Staunton et al. (2006). For selected Ni concentrations an orbital polarization correction (OPC) Eriksson et al. (1990); Steinbeck et al. (2001) was included on the scattering channels Ebert and Battocletti (1996); Patrick and Staunton (2018). The DFT-DLM Weiss fields, which govern the temperature dependence of the calculated quantities, were calculated self-consistently using an iterative procedure Matsumoto et al. (2014); Patrick et al. (2017). The magnetocrystalline anisotropy constants were calculated using the torque formalism described in Ref. 22, using an adaptive reciprocal-space sampling scheme to ensure numerical accuracy Bruno and Ginatempo (1997).
To calculate magnetization versus field curves the first-principles approach to calculate temperature-dependent magnetization vs field (FPMVB) curves introduced in Ref. 36 was used. A set of 28 DFT-DLM calculations are used to fit the parameters contained in , which quantify exchange and magnetic anisotropy. The magnetization for a given field and sample orientation is then determined by minimizing the free energy with respect to the angles between the Gd and the transition metal magnetizations and the crystal axes. The approach does not account for any canting between moments within the transition metal sublattices, since this was previously calculated to be less than 0.1∘ for GdCo5 Patrick et al. (2018a).
III Results
III.1 Structural characterization
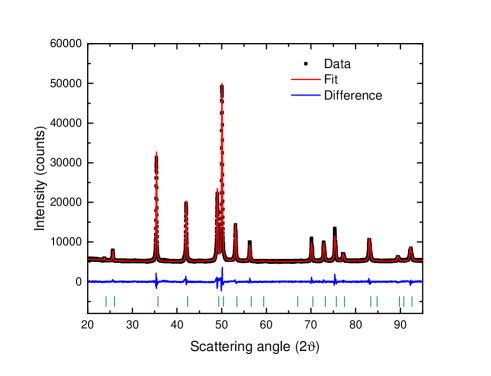
Figure 2 shows the powder x-ray diffraction pattern obtained from GdCo3Ni2 (, black data). The red line is the fit obtained when a Rietveld refinement is carried out using the TOPAS software Top . The goodness of fit parameter is 2.03 (a similar value was found from fitting the diffraction patterns of all samples). The blue line is the difference plot between the observed data and the fit. The green ticks represent indexed peaks. All the peaks in each diffraction pattern have been indexed using the GdCo5 structure—space group —as demonstrated here, suggesting the samples form as single phase materials to within the detection limits of the technique. The lattice parameters for all are given in Table 1, along with the lattice parameters found in the literature. As expected from previous research, there is a contraction in the plane with increasing Ni content, and a less pronounced general contraction along the axis.
| Reported | Reported | |||
|---|---|---|---|---|
| (Å) | (Å) | (Å) | (Å) | |
| 4.946(9) | 3.999(7) | 4.979111Ref. 16 | 3.972111Ref. 16 | |
| 4.960222Ref. 38 | 3.989222Ref. 38 | |||
| 4.974333Ref. 39 | 3.973333Ref. 39 | |||
| 4.9680(4) | 3.9790(3) | - | - | |
| 4.9681(4) | 3.9794(3) | 4.959111Ref. 16 | 3.977111Ref. 16 | |
| 4.957(1) | 3.9790(5) | - | - | |
| 2 | 4.9493(1) | 3.9803(1) | 4.948111Ref. 16 | 3.980111Ref. 16 |
| 2.5 | 4.9439(1) | 3.9785(1) | 4.94111Ref. 16 | 3.979111Ref. 16 |
| 3 | 4.9338(2) | 3.9738(2) | 4.932111Ref. 16 | 3.967111Ref. 16 |
| 3.5 | 4.9306(1) | 3.9708(1) | - | - |
| 4 | 4.9245(1) | 3.9704(1) | 4.92111Ref. 16 | 3.969111Ref. 16 |
| 5 | 4.9139(1) | 3.9683(1) | 4.909111Ref. 16 | 3.965111Ref. 16 |
| 4.91444Ref. 40 | 3.967444Ref. 40 | |||
| 4.90555Ref. 41 | 3.97555Ref. 41 | |||
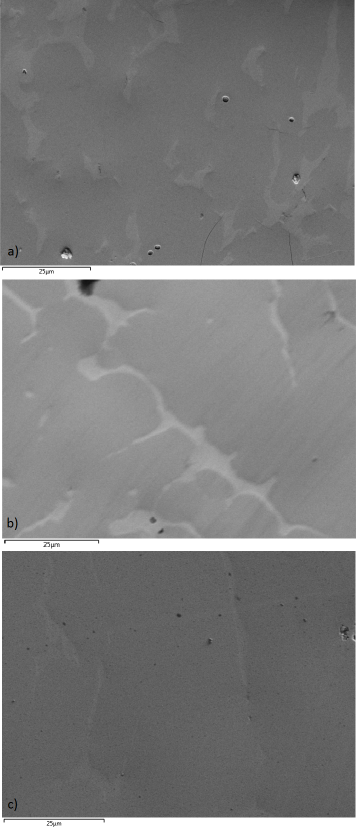
The x-ray diffraction measurements show that the samples are single phase, but this technique may miss small percentages of impurity phases. For this reason, optical microscopy and SEM images were taken of metallographic slides; some example SEM images are shown in Fig. 3. A decreasing quantity of lamellae of a secondary phase were observed with increasing , until 2.5, beyond which no lamellae were observed. Energy-dispersive x-ray spectroscopy showed that the majority phase is the 1:5 [Gd:(Co, Ni)] phase and the small lamellae are a 2:7 phase. Table 2 shows the percentage of the 2:7 phase found in the as-cast samples. Buschow and den Broeder noted that a slight excess of Co during the arc-melting promotes the formation of the 2:7 phase within the 1:5 matrix Buschow and den Broeder (1973). GdNi5 forms congruently from the melt, and is stable down to, at least, room temperatures. On the other hand, GdCo5 undergoes eutectic decomposition at 775 ∘C into Gd2Co7 (2:7 Gd:Co) and Gd2Co17 (2:17 Gd:Co) Buschow (1977) and so increasing Ni content improves the stability of the 1:5 phase.
| 2:7 phase (%) | |
| 1 | 5.2 |
| 1.25 | 6.7 |
| 1.5 | 5.7 |
| 2 | 2.1 |
The relative unimportance of the secondary 2:7 phase in these quantities (2–7%) to the measurement of intrinsic quantities such as the magnetization can be demonstrated for the case of no Ni doping. The moment per formula unit of GdCo5 is 1.37/f.u. Buschow (1977) and of Gd2Co7 is 2.5/f.u. Buschow (1977). Assuming no other impurities or other phases, taking 93% of the total powder to be GdCo5 and 7% to be Gd2Co7 (i.e. the maximum amount of the impurity phase estimated) the total moment becomes 1.45/f.u. This is an 6% increase to pure GdCo5; which is insignificant compared to the almost 300% increase in moment from GdCo5 to GdNi5. On the other hand, it is possible that the presence of a secondary phase affects extrinsic properties such as the coercivity, as in Sm-Co or Nd-Fe-B magnets Sepehri-Amin et al. (2017). As no 2:7 phase was observed in as-cast samples of , these can be used as a comparison when studying trends in the measurements.
III.2 Compensation temperature
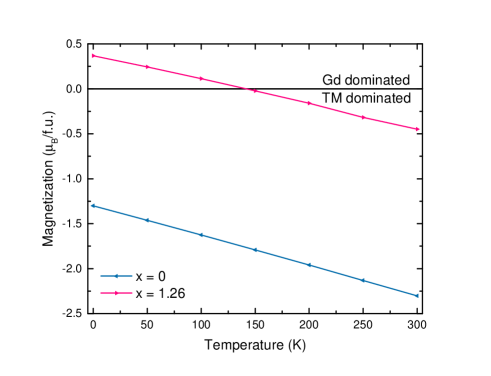
versus curves are shown in Fig. 4 for , 2, and 3 measured in an applied magnetic field of 10 kOe. A clear minimum occurs at progressively lower temperatures as Ni content is decreased. At this minimum the net total magnetization aligns with the bias field of 10 kOe. In contrast, when the sample is warmed in the (small, negative) trapped field of the magnetometer magnet, after cooling in 10 kOe, the magnetization changes sign at the compensation temperature, as shown in Fig. 5 for .
As shown in Fig. 4, the magnetization of the powders subject to the 10 kOe applied field does not go to zero, even at the compensation temperature. An explanation for this behavior in terms of a change in the internal magnetic structure of the powder particles (from antiparallel to canted RE/TM moments) is given in Sec. IV.4.
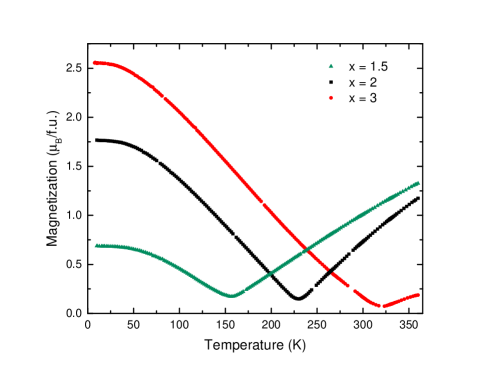

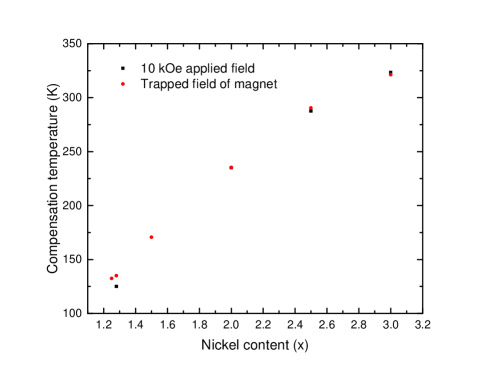
Fig. 6 shows the dependence of the compensation temperature with composition. A small hysteresis in compensation temperature with increasing/decreasing temperature was noted in a 10 kOe field for . No hysteresis was found for these compositions in the trapped field of the magnet. The compensation temperature increases for increasing nickel content, as expected. Compensation is not observed for and in this temperature range. In the case of low Ni doping, the Co sublattice magnetization, whilst reduced by the addition of Ni, remains dominant over the Gd sublattice for all measured temperatures. At high Ni doping, the Co sublattice magnetization is reduced so much that the Gd sublattice magnetization dominates for all measured temperatures.
Chuang et al. (Ref. 16) reported a compensation temperature for of 380 K in a 12 kOe field, however here it is 323 K in a 10 kOe field. Earlier results used a large temperature step size, and hence some disagreement is to be expected. Measurements here were obtained on as-cast powder samples, whereas Ref. 16 reports on annealed samples.
III.3 Magnetization and coercivity
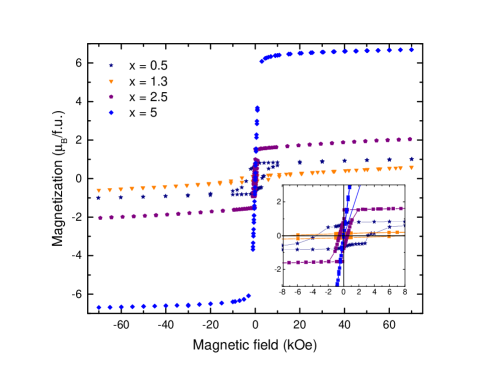
Four-quadrant versus loops for buttons of composition , 1.3, 2.5, and 5 are shown in Fig. 7, with the inset showing the low-field region. It is clear that the samples do not reach full saturation at 70 kOe, which is the experimental limit. This is to be expected, since the samples consist of a number of grains with randomly oriented axes, such that both easy and hard axes are being probed.
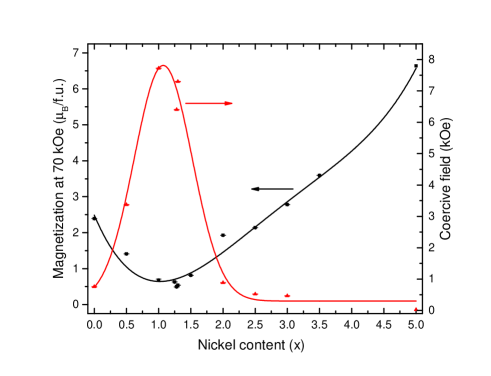
The magnetization at 70 kOe and the coercive field obtained from the versus loops on powders/buttons as discussed above are shown in Fig. 8 as a function of composition. The magnetization has a minimum at , which is the composition for which the sublattice magnetizations cancel maximally in the presence of a 70 kOe applied field at 10 K. This is consistent with the value predicted in section I and with the values obtained via the theoretical approach, section IV. The coercive field has a broad peak that corresponds with the minimum in magnetization. This behavior is consistent with that observed for single crystals of Cu-doped GdCo5, Grechishkin et al. (2006); de Oliveira et al. (2011) and other RECo5-xNix materials Buschow and Brouha (1976); Chuang et al. (1982). A corresponding peak in magnetocrystalline anisotropy is found in the theoretical calculations discussed in IV.
IV Theory
IV.1 Zero temperature magnetization
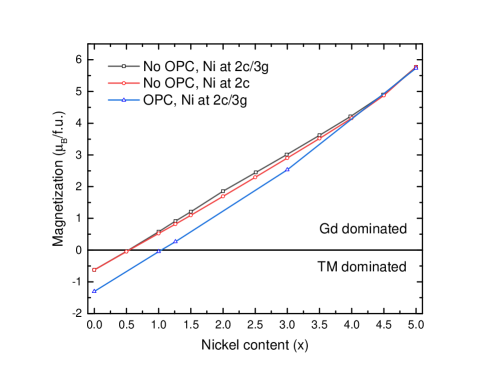
Figure 9 shows zero temperature DFT-DLM calculations of the magnetization of GdCo5-xNix as a function of nickel content . The antiferromagnetic coupling of the RE and TM moments means that the total moment is obtained as the difference between these two contributions. For GdCo5, without the orbital polarisation correction a total moment of 0.62/f.u. is calculated, which consists of a contribution from the Co sublattices of and from the Gd atom of 7.49. The main effect of the OPC is to increase the orbital moments on each Co atom by , giving an increased Co contribution to the moment of and total moment of 1.30/f.u. The theoretical justification for including the OPC is that it approximates the contribution to the exchange-correlation energy from the orbital current, which is missing in the local spin-density approximation Eschrig et al. (2005). Practically, previous work both on YCo5 and GdCo5 found that including the OPC improved the agreement of magnetic moments and magnetocrystalline anisotropy with experiment Steinbeck et al. (2001); Patrick et al. (2018a); Daalderop et al. (1996).
Considering the other limit of GdNi5, the Ni sublattices give a much weaker contribution of (no OPC). The weaker TM magnetism leads to a smaller induced contribution to the Gd moment, whose total value is reduced to 7.27. The total GdNi5 moment is therefore 5.78/f.u. The OPC has a much smaller effect on the Ni orbital moments compared to Co, so that the OPC-calculated total moment is reduced only slightly, to 5.73/f.u.
The absolute value of the moment of GdNi5 exceeds that of GdCo5. The difference is that, in GdCo5 the total moment points in the same direction as the transition metal moments (TM dominated), whereas in GdNi5 the total moment points in the same direction as the Gd moment (Gd dominated). In Fig. 9 the sign convention is adopted that Gd (TM) dominated systems have positive (negative) moments. The gradual addition of Ni weakens the TM contribution, causing a compositionally-induced transition from TM to Gd dominated magnetism with increasing .
At the concentration when the TM and Gd contributions to the magnetization are equal, the moments are fully compensated and the total magnetic moment of GdCo5-xNix is zero. Since the OPC increases the TM moment whilst leaving the Gd moment largely unaffected, this compensation concentration is different for calculations with and without the OPC. With or without the OPC, compensation occurs at or respectively. Comparing the calculations with the experimentally-estimated compensation concentration of also supports the use of the OPC for GdCo5-xNix.
The calculations discussed above were performed assuming that the Ni atoms substitute onto the and sites with equal probability, and are shown as the blue triangles and black squares in Fig. 9 (with and without OPC, respectively). However, previous calculations found it to be more energetically favorable for Ni to substitute at the sites Patrick et al. (2017). Neutron diffraction experiments on Ni-doped YCo5 also found this preferential occupation Deportes et al. (1976). To investigate how this site preference affects the magnetic properties, calculations were also performed where the Ni atoms fill the sites first, with the sites only becoming occupied with Ni atoms for . The moments calculated in this way (without the OPC) are shown as the red circles in Fig. 9. The location of the Ni dopants does not have a large effect on the calculated moment, yielding a maximum difference of /f.u. at . The compensation concentration is also unaffected. However, as discussed below, there is a more pronounced effect on the magnetocrystalline anisotropy from site-preferential doping.
IV.2 Temperature dependent magnetization
We now consider the magnetization at finite temperature, focusing on two cases: pristine GdCo5 and GdCo3.74Ni1.26. The latter Ni concentration was selected due to the interesting coercivity behavior observed experimentally for samples around this composition, as shown in Fig. 8. In these calculations the OPC was included, and the Ni dopants occupied the 2 sites only.
Figure 10 shows the DFT-DLM magnetizations calculated for the temperature range 0–300 K. As in Fig. 9, positive values correspond to the Gd moment having a larger moment than the TM contribution. The magnetization of both GdCo5 and GdCo3.74Ni1.26 becomes more negative (TM-dominated) in this temperature range. The change is effectively linear with temperature, with a difference of 1.0/f.u. for GdCo5 and /f.u. for GdCo3.74Ni1.26 between 0 and 300 K.
The origin of the change in magnetization is a faster disordering of Gd moments compared to the TM as the temperature is increased Patrick et al. (2017). This disordering is quantified by the order parameters , which vary between 1 at 0 K and zero at the Curie temperature. At 300 K, in GdCo5 and (0.75,0.83) in GdCo3.74Ni1.26. Therefore in both cases the relative strength of the TM contribution compared to Gd has increased with increasing temperature, producing a shift towards TM dominated magnetization.
The fact that for both cases at 300 K shows that the introduction of Ni at the sites has not affected the rate of Gd disordering, consistent with results obtained previously Patrick et al. (2017). However, the presence of Ni does lead to a faster disordering of TM moments ( compared to 0.91), which is why the change in magnetization between 0–300 K is smaller for GdCo3.74Ni1.26 than GdCo5. Overall, this faster disordering reduces the Curie temperature, which is calculated to be 915 K for GdCo5 and 713 K for GdCo3.74Ni1.26. These values are consistent with the experiments of Chuang et al. Chuang et al. (1981), who observed a Curie temperature of 1000 K for GdCo5 and 730 K for GdCo3.75Ni1.25.
As shown in Fig. 10, at 140 K GdCo3.74Ni1.26 switches from Gd to TM dominated magnetization. This temperature, where the antiparallel Gd and TM moments cancel each other, is the calculated compensation point of this composition, and agrees well with the experimental data shown in Fig. 6. In passing, we note that not including the OPC shifts the magnetization to a more negative value by 0.55/f.u. at 0 K, and raises the compensation temperature to 300 K (not shown).
IV.3 Zero temperature magnetocrystalline anisotropy
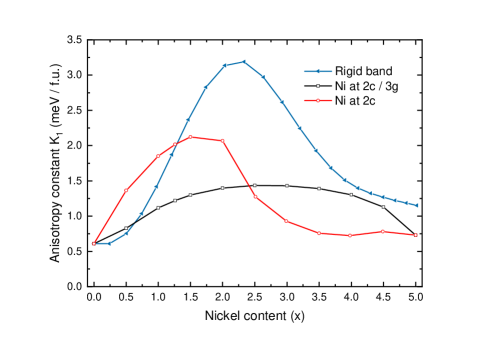
We next consider the experimentally-observed variation in coercive field with composition (Fig. 8). Arguably the simplest model of coercivity is based on magnetization rotation (the Stoner-Wohlfarth [SW] model) Chikazumi (1997) which gives a coercive field of for a ferromagnet of anisotropy and magnetization . The same expression is obtained for the nucleation of reverse domains within micromagnetic theory Brown (1957). Postponing a discussion of to Sec. IV.4, we first consider the magnetocrystalline anisotropy of GdCo5-xNix. At zero temperature, the angular variation of the free energy was calculated, when the Gd and TM moments are held antiparallel to each other and rotated from being parallel to perpendicular to the crystallographic axis. This variation is well described by , with . Fig. 11 shows as a function of Ni composition . The dominant contribution to this anisotropy energy is the TM sublattice, with a minor contribution from Gd Patrick et al. (2018a).
As for the zero temperature magnetization in Fig. 9, both preferentially substituting the Ni at 2 sites (circles in Fig. 9) and equally distributing the Ni over the 2 and 3 sites (squares) was investigated. In both cases, adding Ni increases compared to pristine GdCo5. Furthermore, both cases show a peak in with Ni content. For preferential 2 substitution this peak occurs for between 1.5–2.0, while for equal 2/3 substitution the peak for is between 2.5–3.0. The enhanced is much more pronounced for preferential 2 substitution, becoming 3.5 times larger compared to pristine GdCo5 at .
In these calculations, the Ni doping has been modeled using the CPA. In a simpler rigid-band calculation, the effects of Ni-doping are simulated by shifting the Fermi level of pristine GdCo5 so that the integrated density of states equals the number of electrons in the Ni-doped system. The rigid band calculations of are shown as the blue triangles in Fig. 11. Here, the enhancement in with is even greater than that found with the CPA. The rigid band model does not provide a fully consistent picture of doping, e.g. with the value of at not coinciding with calculated for GdNi5. Nonetheless, the rigid band data emphasizes how, as has been previously discussed for YCo5 Daalderop et al. (1996); Steinbeck et al. (2001), changing the occupations of the bands located close to the Fermi level can have large effects on the anisotropy.
The calculations in Fig. 11 were performed without the OPC. Calculations including the OPC show the same variation with band filling, but the values of are strongly enhanced, as observed previously for YCo5 Daalderop et al. (1996); Steinbeck et al. (2001). For instance, for with preferential 2 Ni doping, values of 2.0 and 6.5 meV/f.u. for without and with the OPC, respectively, are found.
IV.4 Zero temperature coercivity
The previous section showed that increasing the Ni content causes a boost to the anisotropy energy of the transition metal sublattice. Assuming Ni substitutes preferentially at 2 sites, the calculated peak in anisotropy and the experimentally measured peak in coercivity are located at similar concentrations. This observation may explain the increased coercivity with Ni doping of RECo5 compounds with nonmagnetic REs Buschow and Brouha (1976); Chuang et al. (1982). However, as shown in Fig. 8, the maximum in the coercive field for GdCo5-xNix coincides with a minimum in magnetization. Referring again to the micromagnetic expression for the coercive field of a ferromagnet of , we note that naively setting to zero at finite should yield a divergent coercive field at the compensation point. This divergence remains even when Kronmüller’s prefactor Kronmüller (1987) is introduced in order to account for microstructural variation in . Therefore the boost in coercivity in GdCo5 may simply result from compensation of the Gd and TM magnetic moments.
However, GdCo5-xNix is a ferrimagnet, so it is by no means obvious that models based on the rotation of a single magnetization vector should apply. Extending the SW model for a ferrimagnet produces a two-sublattice model, which was investigated for positive applied fields in Ref. 49. Crucially, the competition between the external field, the antiparallel exchange interaction and the magnetocrystalline anisotropy can lead to canting between the Gd and the TM sublattices when a magnetic field is applied.
We recently introduced a method of calculating magnetization versus field curves including this effect from first principles, which we applied to GdCo5 () at low Patrick et al. (2018a) and high Patrick et al. (2018b) magnetic fields. In this approach, DFT-DLM calculations are used to parameterize the following expression for the free energy .
| (1) | |||||
with . The first line of Eq. 1 resembles the free energy found in the Stoner-Wohlfarth model. denotes the angle that the magnetization of sublattice makes with the axis, represents the various anisotropy constants, and represents the anisotropy energy due to dipolar interactions. quantifies the exchange interaction, which with a positive value favors antiferromagnetic alignment of the Gd and TM moments.
For a compensated magnet, and in the absence of an external field the magnetic moments are antiparallel. Naively we might therefore set and, from inspection of equation 1, argue that the external field can have no effect on the free energy or magnetization, corresponding to infinite coercivity. However, is only true as long as the moments remain antiparallel. If the antiparallel alignment breaks, the magnetic sublattices couple individually to the external field. For instance, in the limit of extremely strong external fields both sublattices align to the field, giving a resultant magnetization of .
We note that this model provides an explanation for the magnetization measurements of the powder in a 10 kOe field as a function of temperature (Fig. 4). On free-to-rotate samples, the critical field required to trigger the transition from antiparallel to canted moments essentially scales as Patrick et al. (2018b); Isnard et al. (2012). Therefore, as one approaches the compensation point in the (free-to-rotate) powder, the antiparallel alignment can be broken with a small field, and a nonzero magnetic moment measured.
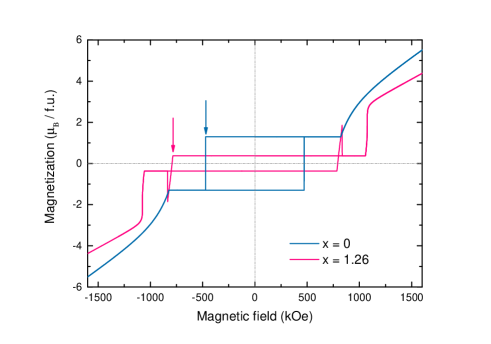
Now, considering fixed samples, in Fig. 12, the results of minimizing along the full multi-quadrant magnetization curve are shown, sweeping the field along the sequence , for GdCo5 and GdCo3.74Ni1.26. Here the OPC is included, preferential Ni doping at the 2 sites is assumed (cf. Fig. 10), and the calculations performed at zero temperature. The field is applied along the crystallographic axis. The size of the field is not intended to match experimental results, as described below, but the relative changes between different compositions can be extracted.
Focusing first on GdCo5 (blue line) for kOe, the boxlike curve resembles that of a SW ferromagnet. At 820 kOe, there is a transition from the rigid antiparallel alignment of Gd and Co moments to a canted configuration, with the energy gain of the Gd moments aligning with the magnetic field competing with the exchange and anisotropy terms. This transition is reversible, such that there is no hysteresis in the first quadrant. In the second quadrant, at kOe (blue arrow in Fig. 12) there is a discontinuous jump in the magnetization corresponding to a simultaneous 180∘ rotation of the Gd and Co moments. This jump is irreversible, so returning the field to zero now gives a negative magnetization, with the majority of the Co moments now pointing opposite to the field until the symmetric jump at kOe occurs.
GdCo3.74Ni1.26 (, pink line) shows broadly the same behavior, but the nature of the transitions themselves are slightly different. At the high-field transition from antiparallel to canted moments at kOe, the moments rotate rapidly with field such that there is a very sudden, but reversible, increase in magnetization. However, the demagnetizing curve in the second quadrant shows a new feature, which is a continuous and reversible decrease of magnetization in the region -835 kOe -785 kOe. The magnetization passes through zero at -792 kOe, and becomes increasingly negative, exceeding its zero-field magnitude at -800 kOe. This new feature is a result of the system getting trapped in a metastable energy minimum corresponding to canted Gd and TM moments. For kOe this minimum disappears, and the system undergoes an irreversible transition back to antiparallel moments.
Equating the coercive fields with the magnitudes of the applied fields which produce zero magnetization in the second quadrant, we extract values of 473 kOe for and 792 kOe for . For now ignoring the fact that these numbers are huge compared to experiment, in terms of relative magnitudes an increase in coercivity by a factor of 1.7 is observed at a Ni doping of . We note that this increase is relatively modest compared to a naive prediction based on assuming that the coercivity was proportional to ; since and increase/decrease by a factor of 3 respectively, we might have expected a coercivity enhancement by a factor of 9.
The calculations in Fig. 12 are illustrative, but cannot be considered a realistic picture of macroscopic magnetization reversal. In reality, the nucleation of reverse domains, e.g. at the edge of the sample, will facilitate magnetization reversal at far lower fields than found here Kumar (1988); Fischbacher et al. (2017). The coercivity will then depend on how the domain walls propagate through the sample, which is likely to be affected by the presence of the secondary phase Sepehri-Amin et al. (2017). We also note that the peak in coercivity observed experimentally here was found for polycrystalline samples. However, it is interesting that the small single crystals of Cu-doped GdCo5 reported in Ref. 12 do show box-like demagnetization curves such as the calculated ones shown in Fig. 12.
V Summary & Conclusions
Polycrystalline samples of GdCo5-xNix for to 5 have been synthesized using an arc furnace. The predominant formation of a single phase was confirmed by comparing powder x-ray diffraction patterns to the pattern measured for pure GdCo5. Optical and SEM imaging showed small (7%) amounts of a 2:7 phase in the 1:5 matrix for , and no 2:7 phase at higher concentrations. No evidence was found to say with confidence that the annealing improves (or indeed, affects at all) the microstructure and phase purity of the samples.
The magnetization of the samples measured at 70 kOe and 10 K initially decreases as the nickel content is increased. At a composition of , the (absolute) magnetization reaches a minimum and then increases with further Ni addition. This behavior is due to the Ni weakening the magnetization of the transition metal sublattice, such that at low temperature, for the net magnetization points along the direction of the transition metal moments, while for the net magnetization points along the direction of the Gd moments. Zero temperature DFT-DLM calculations find the compensation composition, i.e. the point at which the transition metal and Gd sublattice magnetizations cancel each other to be , in good agreement with the experimentally-observed minimum. The calculations found the magnetization to be rather insensitive to the location of the Ni dopants, which can occupy either 2 or 3 crystallographic sites.
For a Ni content of , compensation temperatures in the range 10–360 K were observed. The compensation temperatures increase with increasing Ni doping, and occur due to the faster disordering of the Gd moments compared to the transition metal. Finite temperature DFT-DLM calculations on pristine GdCo5 and GdCo3.74Ni1.26 demonstrate this behavior explicitly, finding a compensation temperature of 140 K for the latter compound which corresponds well to the experimental measurements shown in Fig. 6.
The coercivity of polycrystalline buttons measured below 10 K is found to have a maximum value at a composition , coinciding with the minimum in magnetization. One might argue that such behavior is consistent with the Stoner-Wohlfarth model and micromagnetics, where the coercive field is inversely proportional to the magnetization (). However, such a picture is based on the rotation of a single magnetic sublattice and neglects the possibility that magnetization reversal might proceed via a canted arrangement of Gd and transition metal moments. Magnetization versus field loops calculated allowing for such canting do show an increase in coercivity from to , but not by as great an amount as predicted by the Stoner-Wohlfarth model given the reduction in . Apart from the reduction in magnetization, the DFT-DLM calculations also found an increase in the magnetocrystalline anisotropy of the transition-metal sublattice with Ni doping. Indeed, assuming preferential substitution at the 2 sites the peak in anisotropy was found for a concentration of , reasonably close to the experimentally observed coercivity maximum. Such an explanation for increased coercivity, independent of phenomena related to compensation, would be consistent with measurements on doped RECo5 compounds with nonmagnetic RE, which also undergo peaks in coercivity despite having no compensation points.
However, apart from these intrinsic factors, it should also be noted that the peak in coercivity also coincides with the largest amount of secondary 2:7 phase (Table 2). Although the amount of secondary phase we observe is small in terms of measuring intrinsic quantities, interfaces between the 1:5 and 2:7 phases could inhibit the motion of domain walls through the sample, increasing the coercivity. Being able to better control the formation of the 2:7 phase would allow the magnitude of this extrinsic effect to be tested.
The current study emphasizes the complementary roles played by experiments and theory. On one hand, the experiments provide valuable input for developing the calculations, particularly in terms of validating the methodology. On the other hand, the calculations provide microscopic insight into macroscropic measurements. Here we have shown that quantitative comparisons are possible between intrinsic quantities such as magnetizations and compensation temperatures.
However, whilst the calculations can give hints about extrinsic quantities such as the coercivity, in reality a multiscale approach capable of describing e.g. microstructure and long range demagnetizing fields is required. Nonetheless, the first-principles calculations (as validated by experimental measurements of intrinsic quantities) can still play a fundamental role by providing the microscopic parameters required as input for such simulations.
Acknowledgements
This work forms part of the PRETAMAG project, funded by the UK Engineering and Physical Sciences Research Council (EPSRC) Grant No. EP/M028941/1. Crystal growth work at Warwick was also supported by EPSRC Grant No. EP/M028771/1. We thank the Warwick Research Technology Platform (X-ray Diffraction and Electron Microscopy) for their assistance. We acknowledge the Warwick Manufacturing Group and Buehler for assistance with slide production. We thank E. Mendive-Tapia and G. Marchant for useful discussions.
References
- Kumar (1988) K. Kumar, J. Appl. Phys. 63, R13 (1988).
- Strnat et al. (1967) K. Strnat, G. Hoffer, J. Olson, W. Ostertag, and J. J. Becker, J. Appl. Phys. 38, 1001 (1967).
- Sagawa et al. (1984) M. Sagawa, S. Fujimura, N. Togawa, H. Yamamoto, and Y. Matsuura, J. Appl. Phys. 55, 2083 (1984).
- Croat et al. (1984) J. J. Croat, J. F. Herbst, R. W. Lee, and F. E. Pinkerton, J. Appl. Phys. 55, 2078 (1984).
- Kuz’min and Tishin (2008) M. D. Kuz’min and A. M. Tishin, in Handbook of Magnetic Materials, edited by K. H. J. Buschow (Elsevier B.V., Amsterdam, 2008), Vol. 17, Chap. 3, p. 149.
- Nesbitt et al. (1959) E. A. Nesbitt, J. H. Wernick, and E. Corenzwit, J. Appl. Phys. 30, 365 (1959).
- Nassau et al. (1960) K. Nassau, L. V. Cherry, and W. E. Wallace, J. Phys. Chem. Solids. 16, 131 (1960).
- Buschow (1977) K. H. J. Buschow, Rep. Prog. Phys. 40, 1179 (1977).
- Yermolenko (1980) A. S. Yermolenko, Fiz. Metal. Metalloved. 50, 741 (1980).
- Patrick et al. (2017) C. E. Patrick, S. Kumar, G. Balakrishnan, R. S. Edwards, M. R. Lees, E. Mendive-Tapia, L. Petit, and J. B. Staunton, Phys. Rev. Mater. 1, 024411 (2017).
- Bajorek et al. (2011) A. Bajorek, G. Chełkowska, and B. Andrzejewski, J. Alloy. Compd. 509, 578 (2011).
- Grechishkin et al. (2006) R. M. Grechishkin, M. S. Kustov, O. Cugat, J. Delamare, G. Poulin, D. Mavrudieva, and N. M. Dempsey, Appl. Phys. Lett. 89, 122505 (2006).
- de Oliveira et al. (2011) L. A. S. de Oliveira, J. P. Sinnecker, R. Grössinger, A. Pentón-Madrigal, and E. Estévez-Rams, J. Magn. Magn. Mater. 323, 1890 (2011).
- Buschow and Brouha (1976) K. H. J. Buschow and M. Brouha, J. Appl. Phys. 47, 1653 (1976).
- Chuang et al. (1982) Y. C. Chuang, C. H. Wu, and Y. C. Chang, J. Less-Common Met. 84, 201 (1982).
- Chuang et al. (1981) Y. C. Chuang, C. H. Wu, T. C. Li, S. C. Chang, and M. S. Wang, J. Less-Common Met. 78, 219 (1981).
- Liu et al. (1991) J. P. Liu, X. P. Zhong, F. R. de Boer, and K. H. J. Buschow, J. Appl. Phys. 69, 5536 (1991).
- Burzo and Pop (1999) E. Burzo and V. Pop, J. Magn. Magn. Mater. 196–197, 768 (1999).
- Drzazga et al. (1989) Z. Drzazga, A. Winiarska, and F. Stein, J. Less-Common Met. 153, L21 (1989).
- Gignoux et al. (1976) D. Gignoux, D. Givord, and A. del Moral, Solid State Commun. 19, 891 (1976).
- Gyorffy et al. (1985) B. L. Gyorffy, A. J. Pindor, J. Staunton, G. M. Stocks, and H. Winter, J. Phys. F Met. Phys. 15, 1337 (1985).
- Staunton et al. (2006) J. B. Staunton, L. Szunyogh, A. Buruzs, B. L. Gyorffy, S. Ostanin, and L. Udvardi, Phys. Rev. B 74, 144411 (2006).
- Buschow and den Broeder (1973) K. H. J. Buschow and F. J. A. den Broeder, J. Less-Common Met. 33, 191 (1973).
- Katayama et al. (1976) T. Katayama, M. Ohkoshi, Y. Koizumi, T. Shibata, and T. Tsushima, Appl. Phys. Lett. 28, 635 (1976).
- (25) H. Ebert, D. Ködderitzsch, and J. Minár, Rep. Prog. Phys 74, 096501 (2011).
- Andreev and Zadvorkin (1991) A. V. Andreev and S. M. Zadvorkin, Physica B. 172, 517 (1991).
- Däne et al. (2009) M. Däne, M. Lüders, A. Ernst, D. Ködderitzsch, W. M. Temmerman, Z. Szotek, and W. Hergert, J. Phys.: Condens. Matter 21, 045604 (2009).
- Vosko et al. (1980) S. H. Vosko, L. Wilk, and M. Nusair, Can. J. Phys. 58, 1200 (1980).
- Lüders et al. (2005) M. Lüders, A. Ernst, M. Däne, Z. Szotek, A. Svane, D. Ködderitzsch, W. Hergert, B. L. Györffy, and W. M. Temmerman, Phys. Rev. B 71, 205109 (2005).
- Eriksson et al. (1990) O. Eriksson, B. Johansson, R. C. Albers, A. M. Boring, and M. S. S. Brooks, Phys. Rev. B 42, 2707 (1990).
- Steinbeck et al. (2001) L. Steinbeck, M. Richter, and H. Eschrig, J. Magn. Magn. Mater. 226–230, 1011 (2001), proceedings of the International Conference on Magnetism (ICM 2000).
- Ebert and Battocletti (1996) H. Ebert and M. Battocletti, Solid State Commun. 98, 785 (1996).
- Patrick and Staunton (2018) C. E. Patrick and J. B. Staunton, Phys. Rev. B 97, 224415 (2018).
- Matsumoto et al. (2014) M. Matsumoto, R. Banerjee, and J. B. Staunton, Phys. Rev. B 90, 054421 (2014).
- Bruno and Ginatempo (1997) E. Bruno and B. Ginatempo, Phys. Rev. B 55, 12946 (1997).
- Patrick et al. (2018a) C. E. Patrick, S. Kumar, G. Balakrishnan, R. S. Edwards, M. R. Lees, L. Petit, and J. B. Staunton, Phys. Rev. Lett. 120, 097202 (2018a).
- (37) A. A. Coelho, TOPAS-Academic, Ver.6, Bruker-AXS, Karlsruhe, Germany, 2016.
- Lihl et al. (1969) F. Lihl, J. R. Ehold, H. R. Kirchmayr, and H. D. Wolf, Acta Phys. Austriaca 30, 164 (1969).
- Wernick and Geller (1959) J. H. Wernick and S. Geller, Acta Crystallogr. 12, 662 (1959).
- Sorgic et al. (1995) B. S̆orgić, A. Dras̆ner, and Ẑ. Blaẑina, J. Alloy. Compd. 221, 169 (1995).
- Lemaire and Paccard (1969) R. Lemaire and D. Paccard, Bull. Soc. Fr. Mineral. Cristallogr. 92, 9 (1969).
- Sepehri-Amin et al. (2017) H. Sepehri-Amin, J. Thielsch, J. Fischbacher, T. Ohkubo, T. Schrefl, O. Gutfleisch, and K. Hono, Acta Mater. 126, 1 (2017).
- Eschrig et al. (2005) H. Eschrig, M. Sargolzaei, K. Koepernik, and M. Richter, Europhys. Lett. 72, 611 (2005).
- Daalderop et al. (1996) G. H. O. Daalderop, P. J. Kelly, and M. F. H. Schuurmans, Phys. Rev. B 53, 14415 (1996).
- Deportes et al. (1976) J. Deportes, D. Givord, J. Schweizer, and F. Tasset, IEEE Trans. Magn. 12, 1000 (1976).
- Chikazumi (1997) S. Chikazumi, Physics of Ferromagnetism, 2nd ed. (Oxford University Press, Oxford, 1997) p. 495.
- Brown (1957) W. F. Brown, Phys. Rev. 105, 1479 (1957).
- Kronmüller (1987) H. Kronmüller, Phys. Status Solidi (b) 144, 385 (1987).
- Radwański (1986) R. J. Radwański, Physica B+C 142, 57 (1986).
- Patrick et al. (2018b) C. E. Patrick, S. Kumar, K. Götze, M. J. Pearce, J. Singleton, G. Rowlands, G. Balakrishnan, M. R. Lees, P. A. Goddard, and J. B. Staunton, J. Phys.: Condens. Matter 30, 32LT01 (2018b).
- Isnard et al. (2012) O. Isnard, Y. Skourski, L. V. B. Diop, Z. Arnold, A. V. Andreev, J. Wosnitza, A. Iwasa, A. Kondo, A. Matsuo, and K. Kindo, J. Appl. Phys. 111, 093916 (2012).
- Fischbacher et al. (2017) J. Fischbacher, A. Kovacs, H. Oezelt, M. Gusenbauer, T. Schrefl, L. Exl, D. Givord, N. M. Dempsey, G. Zimanyi, M. Winklhofer, G. Hrkac, R. Chantrell, N. Sakuma, M. Yano, A. Kato, T. Shoji, and A. Manabe, Appl. Phys. Lett. 111, 072404 (2017).