Testing Cosmic Distance-Duality Relation from Future Gravitational Wave Standard Sirens
Abstract
A validation of the cosmic distance-duality relation (CDDR) is crucial because any observational departure from it could be a signal of new physics. In this work, we explore the potentialities of luminosity distance data from the gravitational wave (GW) standard sirens of future Einstein Telescope (ET) to test the CDDR. The angular diameter distance data are used from the galaxy clusters samples and the baryon acoustic oscillation (BAO) measurements. The basic advantage of GW measurements substituting for the observations from the type Ia supernovae (SNIa) is that the luminosity distance from it is insensitive to the non-conservation of the number of photons. By simulating 550 and 1000 data points of future GW measurements in the low redshift range , we show that the measurements of future GW events will be a powerful tool to test the CDDR.
Cosmic distance-duality relation, gravitation wave, galaxy cluster
pacs:
98.80.Es, 95.36.+x, 98.80.-kI Introduction
The cosmic distance-duality relation (CDDR), which relates luminosity distance (LD) and angular diameter distance (ADD) to a given source at redshift through the following identity
| (1) |
was firstly proved by Etherington in 1933 eth1933 based on two fundamental hypotheses, namely, that light travels always along null geodesics in a Riemannian geometry, and the number of photons is conserved ellis1971 ; ellis2007 . This equation has been used, without any doubt, in astronomical observations and modern cosmology, since it is independent of Einstein field equations and the nature of matter. However, the possibilities of the CDDR violation may be resulted from non-conservation of the number of photons or a non-metric theory of gravity, in which the light does not travel along null geodesics uzan2004 ; Santana2017 . The non-conservation of the total number of photon may be resulted by the presence of scattering and absorption of some opacity sources Csaki2002 ; Lima2011 or non-standard mechanisms such as scalar fields with a non-minimal coupling to the electromagnetic Lagrangian Hees2014 ; Holanda2017 ; Holanda20161 ; Aguirre1999 or oscillation of photons propagating in extragalactic magnetic fields into light axion Csaki2002 ; Avgoustidis2009 ; Avgoustidis2010 ; Jaeckel2010 . Any violation of CDDR from astronomical observations may even be considered as a signal of exotic physics or the existence of some unaccounted errors in the observations bassett . Thus, testing the validity of this relation with different observational data sets and methods is worthy and necessary.
To check the validity of the CDDR with astronomical observations, one should in principle obtain the LD and ADD of some objects at the same redshift. The LD can be generally obtained through the observation of the type Ia supernovae (SNIa) standard candles, and the ADD can be estimated from the observation of galaxy clusters, the cosmic microwave background (CMB) and baryon acoustic oscillation (BAO). Since the redshifts of LD and ADD data points in the present observations usually do not match, some tests on the CDDR are performed through comparing the observed values with the corresponding theoretical ones from an assumed cosmological model. With the LDs from CDM model, Uzan et al. uzan2004 and De Bernardis et al. DeBernardis2006 tested successively the CDDR with galaxy cluster samples Reese2002 ; Boname06 , and found no violation from the CDDR. Then, combining the SNIa data with the standard rulers from the CMB and BAO measurements, Lazkoz et al. verified the validity of the CDDR at the confidence level (CL) Lazkoz2008 . Using the galaxy cluster data from the elliptical and spherical models Boname06 ; DeFilippis05 , Holanda et al. obtained that the CDDR is compatible with the elliptical and spherical models at and CL, respectively holanda2010 .
Recently, in order to match the redshifts of the galaxy cluster samples Boname06 ; DeFilippis05 with those of SNIa data by the cosmological-model-independent method, Holanda et al. holanda20103 adopted a criterion () and chose the closest one. From the Constitution SNIa compilation Hicken2009 , they found that the CDDR is marginally consistent with the elliptical model at , but, it indicates a strong violation from the spherical model even at CL. Using the Union 2 SNIa compilation, Li et al. also performed tests on the CDDR, and found that the CDDR is consistent with the elliptical model at CL, and the spherical model at Li2011 . In order to avoid larger statistical errors brought by using merely one SNIa data point from all those available which meet the selection criterion, Meng et al. Meng2012 , instead of using the nearest point of SNIa compilation, binned these data available to obtain LD to match the corresponding ADD sample. They studied different morphological models of galaxy clusters, and found that the marked triaxial ellipsoidal model is a better geometrical hypothesis to describe the structure of galaxy cluster than the spherical model if the CDDR is valid. Then, Wu et al. tested the CDDR by combining the Union 2.1 compilation and five ADD data points from the BAO measurements, and found that the BAO measurement is a very powerful tool to test the CDDR due to the precision of the BAO measurements Wu2015 . Still some other tests, involving the ADD of galaxy clusters Boname06 ; DeFilippis05 , current cosmic microwave background (CMB) observations Ellis2013 , Hubble parameter data from cosmic chronometers, gas mass fraction measurements in galaxy clusters Goncalves2012 , strong gravitational lensing (SGL) Cao2012 ; Cao2015 and time delay lenses Balmes , are performed to investigate the validity of the CDDR by assuming a deformed CDDR, such as , in different redshifts ranges, and the results show that the CDDR is consistent with the observations at certain CLs avtidisgous ; Holanda2012a ; Santos2015 ; Stern2010 ; Holanda2012 ; Liao2011 ; Holanda20171 ; Liao2016 ; fuxiangyun ; Fu2017 ; Liang2013 ; Rana ; Ruan .
It is worthy noting that the LD from SNIa measurements is dependent on the conservation of the number of photons. Any kind of violation from the conservation of the number of photons, such as absorption and scattering of photon or axion-photon mixing, sensibly imprints its impact on the test of the CDDR Tolman1930 . So a common limitation of the aforementioned tests involving LD from SNIa compilations is that, if the evidence of the CDDR violation is obtained, the fundamental reason for the departure may not be known because the results from these tests are sensitive to the both fundamental hypotheses for the CDDR.
More recently, the joint detections of the gravitational-wave (GW) event GW170817 with electromagnetic (EM) counterpart (GRB 170817A) from the merger of binary neutron stars (NSs) Abbott ; Abbott2 ; Daz ; Cowperthwaite have opened the new era of multi-messenger cosmology, and it makes for the first time that a cosmic event can be investigated in both EM waves and GWs. The application of GW information in cosmology was first proposed by Schuts Schutz , who suggested that the Hubble constant can be determined from GW observations using the fact that the waveform signals of GWs from inspiraling and merging compact binaries encode distance information. So, GW sources can be considered as standard sirens in astronomy, analogous to supernovae standard candles. Unlike the distance estimation from SNIa observations, one can, from the GW observations, obtain the luminosity distances directly without the need of cosmic distance lader since stand sirens are self-calibrating. This advantage of GW measurements can help us dodge the influence of the non-conservation of the number of photon on the test of CDDR. If compact binaries are NS-NS or black hole (BH)-NS binaries, the source redshift may be observed from EM counterparts that occur coincidentally with the GW events Zhao2011 ; Nissanke2010 ; Cai2017 . Thus, the LD-redshift relation can be constructed by a cosmological-model-independent way through combining the measurements of the sources’ redshifts from the EM counterpart, and it provide us with an opportunity to make constraints on the cosmological parameters and the possible departures from the CDDR. It is worth mentioning that the propagation of GWs in modified gravity theories is in general different from that in General Relativity and the LDs from GWs are different from that for the electromagnetic signals Belgacem2018 ; Saltas2014 . Therefore, if one tests the CDDR with LDs from GW measurements and distances from electromagnetic observations, the violation of CDDR might indicate deviations of gravity theory from General Relativity besides the existence of new phsics. In this work, the main motivation is to employ the GW as alternative for the SNIa to test CDDR in the frame of General Relativity.
Up to now, the simulated GW data have been used to measure the cosmological parameters Zhao2011 ; Pozzo201217 ; Liao2017 ; Cai2016 ; Wei2017 , determine the total mass of neutrino Wang2018 , investigate the anisotropy of the universe Cai2018 ; Wei2018 and make constraints on the evolving Newton’s constant G Zhao2018 . More recently, Yang et al explored the potentialities of future GW detections to constrain a possible departure from the CDDR through combining LD of simulated gravitational wave data from the Einstein Telescope (ET) and ADD from SGL systems in a relative high redshifts range Yang2017 . They obtained that future results from GW data will be at least competitive with current constraints on CDDR from SNIa+GRBs+SGLs analyses. However, it is shown that mass profile of lensed galaxies and dynamical structure may bring forth significant changes in lensing studies Cao2012 ; Cao2015 , and its impact on the test of CDDR needs further investigations. Thus, one needs more relevant ADD data to explore the potentialities of GW measurements on the test of the validity of CDDR. It is well known that BAO measurement is a very precise astronomical observation Bassett2010 ; Wu2015 and can be used as a very powerful tool to test the CDDR Wu2015 . In addition, the measurement of galaxy clusters also plays an important role to test this relation. So, it is worth to confirm the ability of future GW measurements jointly with the ADD data from BAO and galaxy clusters to constrain a possible departure from this reciprocal relation.
In this work, we detect the potentialities of future GW measurements to test CDDR. The analyses are carried out with the LD () from simulated GW data jointly with ADD from BAO and galaxy cluster samples. We simulate 550 and 1000 data points of GWs from the ET in the redshifts range as reference, and impose limits on to estimate the possible departures from the CDDR. In order to compare our results with that from Refs. Meng2012 ; Wu2015 , we also employ the binning method to obtain the corresponding LDs from simulated GW data for each BAO or galaxy cluster systems. The results indicate that measurement of future GW events will be a very powerful tool to realize the validation of this reciprocal relation.
II samples and simulated GW data
The structure of galaxy clusters is essential for the cosmological probe Suwa2003 ; Allen2004 . Generally speaking, to get reasonable results of ADD from galaxy cluster observation, one has to assume certain cluster morphologies and employ the joint analysis of SZE and X-ray brightness measurements SZE . Two galaxy cluster samples are utilized to obtain the ADD through different morphological assumptions. The first one involves 25 X-ray-selected galaxy clusters DeFilippis05 described as an isothermal elliptical model. The second samples includes 38 galaxy clusters Boname06 , whose plasma and matter distributions were analyzed by assuming hydrostatic equilibrium model and spherical symmetry. Therefore, the CDDR tests are sensitive to the models for the cluster gas distribution, since the ADD data is closely relate to the assumption of cluster models. For the galaxy cluster samples, the statistical and systematic errors account for about and (Reese20023, ; Boname06, ) and they are combined in quadrature for the ADD holanda20103 ; Boname06 .
The observational ADD data can be also obtained from the BAO measurements Bassett2010 . The early universe consists of a hot, dense plasma of electrons and baryons. Photon is coupled with the baryons via Thomson scattering. A system of standing sound waves within the plasma can be created on account of the existence of a competition between radiation pressure and gravity, so called BAOs. As the universe expands, the plasma cools to below —a low enough energy such that the electrons and protons in the plasma could combine to form neutral hydrogen atoms, i.e. recombination. The free electrons are quickly captured and the coupling between photons and baryons ends abruptly, which leads to a overdensity of baryons at the scale about 150Mpc today. This scale can be observed in the clustering distribution of galaxies today and can be used as a standard ruler. One can obtain the ADD by combining of the measurements of the baryon acoustic peak and the Alcock-Paczynski distortion from galaxy clustering (see Bassett2010 for a review). The five ADD data points from BAO measurements are released by the WiggleZ Dark Energy Survey Blake2012 , the Sloan Digital Sky Survey (SDSS) Xu2013 and Data Release 11 Samushia2014 ( also listed in Table I from Ref. Wu2015 ).
The ET is the third generation of the ground based GW detector, and it, as proposed by programme, consists of three collocated underground arms with the length of 10 km and a opening angle. The ET would be able to detect GW signals to be ten times more sensitive in amplitude than the advanced ground-based detectors, covering a wide frequency range of Hz with the redshits range for the NS-NS and for the BH-NS mergers systems. If compact mergers are NS-NS or BH-NS binaries, the source redshift may be observed from EM counterparts that occur coincidentally with the GW events Zhao2011 ; Nissanke2010 ; Cai2017 . Thus, the LD-redshifts relation can be constructed with a cosmological-model-independent way, and it can be employed to make constraints on the basic parameters of cosmology. The ratio between NS-NS and BH-NS binaries, in this work, is taken to be 0.03, as illustrated by the Advanced LIGO-Virgo network Abadie2010a . Here, for brevity, we only summarize the process of Refs. Zhao2011 ; Cai2017 ; Wei2018 ; Yang2017 in which observations of GW from future ET are simulated, and then we will forecast the constraints on CDDR.
For the waveform of GW, the stationary phase approximation is applied to compute the Fourier transform of the time domain waveform ,
| (2) |
where the Fourier amplitude is given by
| (3) |
where denotes the observational chirp mass and is the LD which plays the most important role in this test. The definition of the beam pattern functions , the polarization angle , the epoch of the merger , the phase parameter such as the angle of inclination and are introduced in Refs. Zhao2011 ; Cai2017 ; Wei2018 ; Yang2017 . The cosmological parameters of fiducial concordant model are adopted with the most recent Planck results Plank2015 :
| (4) |
where , and denote the Hubble constant, dark matter density parameter, the cosmic curvature parameter today and the dark energy equation of state respectively. It is known that the redshift range of ADD data from galaxy cluster and BAO is in the region , and the corresponding number of data points from SNIa Union 2 or Union 2.1 compilation is 537 or 551, respectively. In order to compare our results relevantly with the number density of data points from Union compilation in this redshifts region, we first simulate 550 data points (set A) from future GW events. We also simulate 1000 data points (set B) to study the impact of the quantity of GW data on the test. The mock results are shown in Fig. (1).


III Methods
The most straightforward method to test CDDR is to compare the LD with the ADD at the same redshifts through the identity of Eq. (1). Generally, in the checking process, some departures from CDDR are allowed through defining the following function
| (5) |
The CDDR holds while . All deviations from CDDR, which occur possibly at some redshifts, will be encoded in the function . In this work, four potential parameterizations for the are adopted, namely, linear one (), and three non-linear ones, (), (), and ().
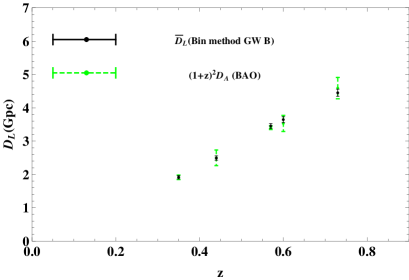
In principle, given a ADD sample from each galaxy cluster or BAO system, one should select a LD () data point from GW data that shares the same redshift with the given ADD data to test the CDDR. However, this condition usually can not be met in recent astronomical observations. To achieve this goal, a number of methods have been proposed holanda20103 ; Li2011 ; Liao2016 ; Meng2012 ; Yang2017 . In order to compare our results with that from Refs. Meng2012 ; Wu2015 , we employ a cosmological model-independent binning methods to obtain the LD () from certain GW data points.
III.1 Method: Binning the GW data
In order to test the validity of CDDR with a cosmological-model-independent way, Holanda et al. holanda2010 ; holanda20103 , Li et al. Li2011 and Liao et al. Liao2016 adopted a selection criterion , where and denote the redshift of a ADD sample and SNIa data respectively, and chose the nearest SNIa data to match a ADD sample. However, using merely one SNIa data point from all those available which meet the selection criterion will lead to larger statistical errors. In order to avoid them, instead of using the nearest point of Union 2.1 SNIa, Wu et al. Wu2015 , Meng et al. Meng2012 bin these data available to obtain LD to match the corresponding ADD sample. Following the process, we bin the simulated GW data which meet the criterion. In order to avoid correlations among the individual CDDR tests, we choose the LD samples with a procedure that the data points will not be used again if they have been matched to some cluster or BAO samples. In this method, we employ an inverse variance weighted average of all the selected data. If denotes the th appropriate luminosity distance data points with representing the corresponding observational uncertainty, we can straightly obtain the following with conventional data reduction techniques in Chapter.() of the Ref. Bevington2003 ,
| (6) |
| (7) |
where represents the weighted mean luminosity distance and corresponds its uncertainty.
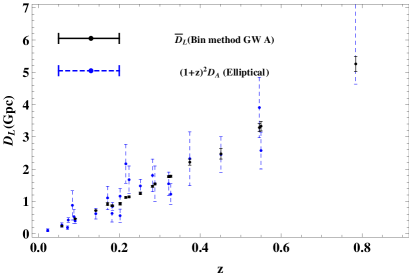
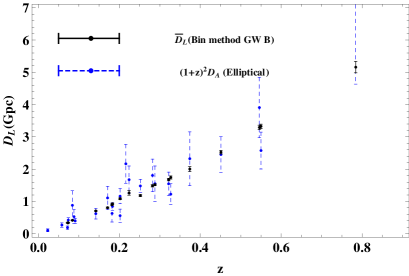
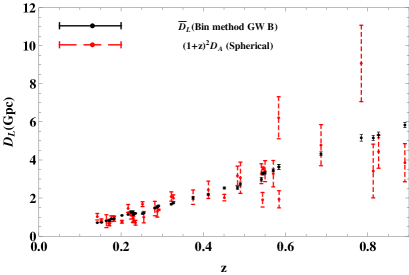
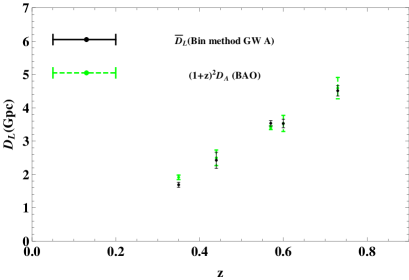
The selection criterion can be generally satisfied with all the samples of spherical model and BAO. However, for the elliptical model, only 20 and 21 samples satisfied with this selection criteria for set A and B from the simulated GW data except for some data points in the low redshift region , since the number density of the simulated GW data in this region is very small. The distributions of ADD samples and LD data obtained by this method are shown in Fig.( 2).

IV Analysis and Results
To place constraints on , one must firstly obtain with
| (8) |
from the galaxy cluster or BAO samples and the luminosity distance from the binning method. The corresponding error of can be obtained through
| (9) |
Thus, using the following equation
| (10) |
one can obtain the constraints on . Results are shown in Fig. (3) and Tab. (1).
| Parametrization | (elliptical) | (elliptical) | (spherical) | (spherical) | (BAO) | (BAO) |
|---|---|---|---|---|---|---|
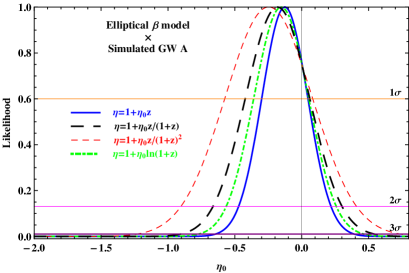
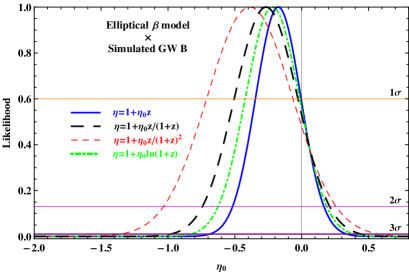
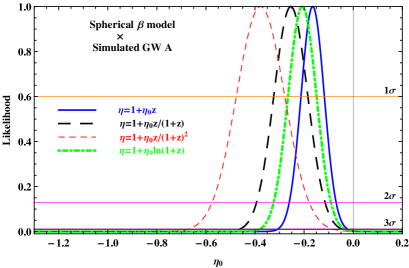
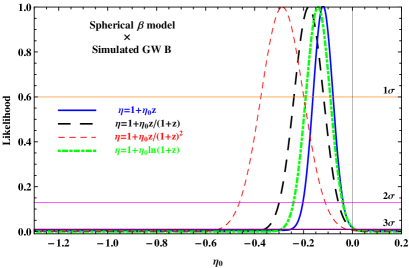
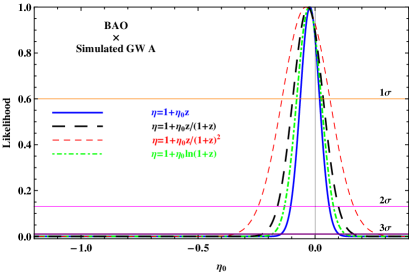

For the galaxy cluster, seen from Fig. (3) and Tab. (1), it can be obtained that the CDDR is consistent with the elliptical model and the simulated GW data set A or B at CL or CL respectively, which is consistent with that from refs. holanda20103 ; Li2011 ; Meng2012 . However, for the spherical model, the CDDR is not compatible with the observational data even at CL. This result suggests a stronger violation than that from Refs. holanda20103 ; Li2011 ; Meng2012 . It should be noted that, unlike SNIa observations, the violation from the CDDR is obtained from the LD of GW measurements which is insensitive to the conservation of photon number. If photon does follow along the null geodesics in a Riemannian geometry, the CDDR is valid in the test from GW measurements. One may conclude that the violation of the CDDR may be resulted from the existence of large deviation while the spherical model is used to describe the structure of galaxy cluster. For BAO samples, the CDDR is compatible with the observational data at CL, which is consistent with the results from Ref. Wu2015 . As for the four parameterizations, one can conclude that the linear form can provide the strictest constraints and the best fits on the test for the CDDR.
By comparing the constraints on the at CL, for the spherical model, we obtain error bars about smaller than that obtained from Ref. Meng2012 where Union 2 SNIa compilation are used, regardless the functions adopted. For the BAO samples, the results are about smaller than that from Ref. Wu2015 , where and with and of the functions, respectively. For the elliptical model, the error bars are similar to that from Ref. Meng2012 . However, it should be noted that the number of available samples is only 20, which is less than that used in Ref. Meng2012 . As one may see that, much tighter constraints can be obtained by using future measures of GW events while the same number of ADD samples are considered. By comparing the results from simulated GW data set A with the results from set B at CL, one may find that the tests are almost independent on the quantity of simulated GW data, which may show that the errors of galaxy clusters and BAO samples dominate the constraints on the CDDR.
V conclusion and discussion
The cosmic distance-duality relation (CDDR) plays a fundamental role in astronomical observations and modern cosmology. Its validation with various observational data is an important issue in modern cosmology, as any violation of it could be a signal of new physics in the modern theory of gravity or in particle physics. However, most of the previous tests involving the luminosity distance from SNIa on the CDDR are sensitive to the conservation of number of photons.
The direct detections of the gravitation wave (GW) events have thrown the observational cosmology into a new era of multi-messenger. More precisely, for this astronomical observation, the luminosity distances (LD) can be measured from the waveform and amplitude of the gravitational wave, and it is insensitive to a possible non-conservation of the number of photons.
In this work, we have simulated 550 and 1000 data points of future GW measurements from the Einstein Telescope. The angular diameter distances (ADDs) are from the galaxy clusters samples DeFilippis05 ; Boname06 obtained by using SZE and X-ray surface brightness observations and the BAO data Wu2015 . In order to compare our results to that from Refs. Meng2012 ; Wu2015 where Union 2 or Union 2.1 SNIa are adopted, 550 data points are adopted to ensure that the average number density of the GWs is nearly equal to the number density of the SNIa Union compilation in this redshift range, and the binning method is employed to obtain the corresponding LDs from simulated GW data for each BAO or galaxy cluster system. Then we detect the potentialities of future GW measurements to test the CDDR. The results show that future GW measurements may provide much tighter constraints on the CDDR, while we compare the results at CL with previous ones from SNIa Union2.1 or Union2 Meng2012 ; Wu2015 if the same number of ADD samples are adopted. With the increase of the measuring quality and quantity of future observations, we can forecast that future GW measurement can be considered as a powerful tool to validate this reciprocal relation.
Acknowledgements.
We very much appreciate helpful comments and suggestions from anonymous referees, and also like to thank for helpful discussion from Puxun Wu and Zhengxiang Li. This work was supported by the National Natural Science Foundation of China under Grant Nos. 11147011, the Hunan Provincial Natural Science Foundation of China under Grant No. 12JJA001, the National Natural Science Foundation of China under Grants Nos. 11465011,11865011, the Foundation of Department of science and technology of Guizhou Province of China under Grants No. J [2014] 2150 and the Foundation of the Guizhou Provincial Education Department of China under Grants No. KY [2016]104.References
- (1) I. M. H. Etherington, Phil. Mag. 15, 761 (1933); reprinted in Gen. Relativ. Gravit. 39, 1055 (2007).
- (2) G. F. R. Ellis, Proc. Int. School Phys. Enrico Fermi, R. K. Sachs (ed.), pp. 104-182 1971(Academic Press: New York) reprinted in Gen. Rel. Grav. 41, 581 (2009).
- (3) G. F. R. Ellis, Gen. Relativ. Gravit. 39, 1047 (2007).
- (4) J. P. Uzan, N. Aghanim and Y. Mellier, Phys. Rev. D 70, 083533 (2004). [astro-ph/0405620].
- (5) L. T. Santana, M. O. Calvao, R. R. R. Reis and B. B. Sif fert, Phys. Rev. D 95, no. 6, 061501 (2017). [arXiv:1703.10871 [gr-qc]].
- (6) C. Csaki, N. Kaloper and J. Terning, Phys. Rev. Lett. 88, 161302 (2002).
- (7) J. A. S. Lima, J. V. Cunha and V. T. Zanchin, Astrophys. J. 742, 2(2011) [arXiv:1110.5065].
- (8) A. Hees, O. Minazzoli and J. Larena, Phys. Rev. D 90, 124064 (2014) [arXiv:1406.6187 [astro-ph.CO]].
- (9) R. F. L. Holanda and S. H. Pereira, Phys. Rev. D 94, no. 10, 104037 (2016) [arXiv:1610.01512 [astro- ph.CO]].
- (10) R. F. L. Holanda, S. H. Pereira and S. Santos-da-Costa, Phys. Rev. D 95, no. 8, 084006 (2017) [arXiv:1612.09365 [astro-ph.CO]].
- (11) A. Aguirre, Astrophys. J. 525, 583 (1999).
- (12) A. Avgoustidis, L. Verde and R. Jimenez, J. Cosmol. Astropart. Phys. 0906, 012 (2009) [arXiv:0902.2006 [astro-ph.CO]].
- (13) A. Avgoustidis, C. Burrage, J. Redondo, L. Verde and R. Jimenez, J. Cosmol. Astropart. Phys. 1010, 024 (2010) [arXiv:1004.2053 [astro-ph.CO]].
- (14) J. Jaeckel and A. Ringwald, Ann. Rev. Nucl. Part. Sci. 60, 405 (2010) [arXiv:1002.0329 [hep-ph]].
- (15) B. A. Bassett and M. Kunz, Astrophys. J. 607, 661 (2004); B. A. Bassett and M. Kunz, Phys. Rev. D 69, 101305 (2004).
- (16) F. DeBernardis , E. Giusarma and A. Melchiorri, Int. J. Mod. Phys. D 15, 759 (2006).
- (17) E. D. Reese, J. E. Carlstrom, M. Joy, J. J. Mohr, L. Grego, and W. L. Holzapfel, Astrophys. J. 581, 53 (2002).
- (18) M. Bonamenteet et al., Astrophys. J. 647, 25 (2006).
- (19) R. Lazkoz, S. Nesseris and L. Perivolaropoulos, J. Cosmol. Astropart. Phys. 07 012 (2008).
- (20) E. De Filippis, M. Sereno, M. W. Bautz and G. Longo, Astrophys. J. 625, 108 (2005).
- (21) R. F. L. Holanda, J. A. S. Lima and M. B. Ribeiro, Astron. Astrophys. 528, L14 (2011).
- (22) R. F. L. Holanda, J. A. S. Lima and M. B. Ribeiro, Astrophys. J. 722, 233 (2010).
- (23) M. Hicken et al., Astrophys. J. 700, 1097 (2009).
- (24) Z. Li, P. Wu and H. Yu, Astrophys. J. 729, L14 (2011).
- (25) X. L. Meng, T. J. Zhang and H. Zhan, Astrophys. J. 745, 98 (2012).
- (26) P. Wu, Z. Li, X. Liu and H. Yu, Phys. Rev. D 92, 023520 (2015).
- (27) G. F. R. Ellis, R. Poltis, J. P.Uzan and A. Weltman, Phys. Rev. D 87, 103530 (2013).
- (28) R. S. Gonçalves, R. F. L. Holanda and J. S. Alcaniz, Mon. Not. R. Astron. Soc. 420, 43 (2012).
- (29) S. Cao, et al., J. Cosmol. Astropart. Phys. 03, 016 (2012).
- (30) S. Cao et. al., Astrophys. J. 806 185 (2015) [arXiv:1509.07649].
- (31) I. Balmes and P. S. Corasaniti, Mon. Not. R. Astron. Soc. 431 1528, (2013)[arXiv:1206.5801].
- (32) A. Rana, et al., J. Cosmol. Astropart. Phys., 7, (7) (2017).
- (33) C. Ruan, F. Melia and T. Zhang, [arXiv:1808.09331 [astro-ph.CO]].
- (34) A. Avgoustidis, et al., J. Cosmol. Astropart. Phys. 1010, 024 (2010).
- (35) D. Stern, R. Jimenez, M. Kamionkowski and S. A. Stanford, J. Cosmol. Astropart. Phys. 1002, 008 (2010).
- (36) R. F. L. Holanda, R. S. Gonçalves and J. S. Alcaniz, J. Cosmol. Astropart. Phys. 06, 022 (2012).
- (37) S. Santos-da-Costa, V. C. Busti and R. F. L. Holanda, J. Cosmol. Astropart. Phys. 10, 061 (2015).
- (38) R. F. L. Holanda, J. C. Carvalho and J. S. Alcaniz, J. Cosmol. Astropart. Phys. 1304, 027 (2013).
- (39) K. Liao, Z. Li, J. Ming and Z. Zhu, Phys. Lett. B 718, 1166-1170 (2013).
- (40) K. Liao, et al., Astrophys. J. 822, 74 (2016).
- (41) R. F. L. Holanda, V. C. Busti F. S. Lima and J. S. Alcaniz, J. Cosmol. Astropart. Phys. 1709, no. 09, 039 (2017).
- (42) X. Y. Fu et al., Research in Astron. Astrophys., 8, 895 (2011).
- (43) X. Fu and P. Li, Int. J. Mod. Phys. D 26, no. 9, 1750097 (2017) [arXiv:1702.03626 [gr-qc]].
- (44) N. Liang, Z. Li, P. Wu, S. Cao, K. Liao and Z. H. Zhu, Mon. Not. R. Astron. Soc. 436, 1017 (2013).
- (45) R. C. Tolman, Proc. Natl. Acad. Sci. 16, 511 (1930).
- (46) B. P. Abbott et al. [LIGO Scientific and Virgo Collab- orations], Phys. Rev. Lett. 119, no. 16, 161101 (2017) [arXiv:1710.05832 [gr-qc]].
- (47) B. P. Abbott et al. [LIGO Scientific and Virgo and Fermi- GBM and INTEGRAL Collaborations], Astrophys. J. 848, no. 2, L13 (2017) [arXiv:1710.05834 [astro-ph.HE]].
- (48) M. C. Daz, et al. [TOROS Collaboration], Astrophys. J. Lett. 848, no. 2, 29 (2017) [arXiv:1710.05844 [astro-ph.HE]].
- (49) P. S. Cowperthwaite et al., Astrophys. J. 848, no. 2, L17 (2017).
- (50) B. F. Schutz, Nature 323, 310 (1986).
- (51) W. Zhao, C. VanDenBroeck, D. Baskaran, and T. G. F. Li, Phys. Rev. D 83, 023005 ( 2011).
- (52) S. Nissanke, D. E. Holz, S. A. Hughes, N. Dalal, and J. L. Sievers, Astrophys. J. 725, 496 (2010).
- (53) R. G. Cai and T. Yang, Phys. Rev. D 95, 044024 (2017).
- (54) E. Belgacem, Y. Dirian, S. Foffa and M. Maggiore, Phys. Rev. D 97, 104066 (2018).
- (55) I. D. Saltas, I. Sawicki, L. Amendola, and M. Kunz, Phys. Rev. Lett., 113, 191101 (2014).
- (56) W. Del Pozzo, Phys. Rev. D 86, 043011 (2012); W. Del Pozzo, T. G. F. Li, and C. Messenger, Phys. Rev. D 95, 043502 (2017).
- (57) R. G. Cai, Z. K. Guo, and T. Yang, Phys. Rev. D 93, 043517 (2016).
- (58) K. Liao, X. Fan, X. Ding, M. Biesiada, and Z. Zhu, Nature Communications 8, 1148 (2017).
- (59) J. Wei, and X. Wu, Mon. Not. R. Astron. Soc. 472, 2906 (2017); J. Wei, and X. Wu, and H. Gao, Astrophys. J. 860, L7 (2018).
- (60) L. Wang, X. Zhang, J. Zhang and X. Zhang, Phys. Lett. B 782, 87 (2018).
- (61) J. Wei, ArXiv e-prints, arXiv:1806.09781 (2018).
- (62) R. G. Cai, T. B. Liu, X. W. Liu, S. J. Wang and T. Yang, Phys. Rev. D 97, 103005 (2018).
- (63) W. Zhao, B. S. Wright and B. Li, ArXiv e-prints, arXiv:1804.03066 (2018).
- (64) T. Yang, R. F. L. Holanda and B. Hu, ArXiv e-prints, arXiv:1710.10929 (2017).
- (65) B. A. Bassett and R. Hlozek, edited by P. Ruiz-Lapuente, (Cambridge University Press, Cambridge, 2010), ISBN-13: 9780521518888.
- (66) T. Suwa, A. Habe, K. Yoshikawa, and T. Okamoto, Astrophys. J. , 588, 7 (2003); Y. P. Jing, and Y. Suto, Astrophys. J. , 574, 538 (2002).
- (67) S. W. Allen, R. W. Schmidt, H. Ebeling, A. C. Fabian, and L. van Speybroeck, Mon. Not. R. Astron. Soc., 353, 457 (2004).
- (68) R. A. Sunyaev, and Y. B. Zel dovich, Comments on Astrophysics and Space Physics, 4, 173 (1972); J. E. Carlstrom, G. P. Holder, and E. D. Reese, 2002, ARA&A, 40, 643.
- (69) M. Ribeiro and W. Stoeger, Astrophys. J. 592, 1 (2003).
- (70) C. Blake, S. Brough, M. Colless et al., Mon. Not. R. Astron. Soc. 425, 405 (2012).
- (71) X. Xu, A. J. Cuesta, N. Padmanabhan, D. J. Eisenstein, and C. K. McBride, Mon. Not. R. Astron. Soc. 431, 2834 (2013).
- (72) L. Samushia, B. A. Reid, M. White et al., Mon. Not. R. Astron. Soc. 439, 3504 (2014).
- (73) J. Abadie et al. [LIGO Scientific Collabora- tion], Nucl. Instrum. Meth. A 624, 223 (2010) doi:10.1016/j.nima.2010.07.089 [arXiv:1007.3973 [gr- qc]].
- (74) P. A. R. Ade et al. [Planck Collaboration], Planck 2015 results. XIII. Cosmological parameters, Astron. Astro- phys. 594, A13 (2016) [arXiv:1502.01589 [astro-ph.CO]].
- (75) P. R. Bevington and D. K. Robinson, Data reduction and error analysis for the physical sciences, 3rd ed., by Philip R. Bevington, and Keith D. Robinson. Boston, MA: McGraw-Hill, ISBN 0-07-247227-8, (2003).