Design for the First Narrowband Filter for the Dark Energy Camera: Optimizing the LAGER Survey for 7 Galaxies
Abstract
We present the design for the first narrowband filter NB964 for the Dark Energy Camera (DECam), which is operated on the 4m Blanco Telescope at the Cerro Tololo Inter-American Observatory. The NB964 filter profile is essentially defined by maximizing the power of searching for Lyman alpha emitting galaxies (LAEs) in the epoch of reionization, with the consideration of the night sky background in the near-infrared and the DECam quantum efficiency. The NB964 filter was manufactured by Materion in 2015. It has a central wavelength of 964.2 nm and a full width at half maximum (FWHM) of 9.2 nm. An NB964 survey named LAGER (Lyman Alpha Galaxies in the Epoch of Reionization) has been ongoing since December 2015. Here we report results of lab tests, on-site tests and observations with the NB964 filter. The excellent performances of this filter ensure that the LAGER project is able to detect LAEs at 7 with a high efficiency.
1 Introduction
The narrowband imaging technique has been widely used to search for high-redshift star-forming galaxies since about two decades ago (Cowie & Hu, 1998; Hu et al., 1998; Rhoads et al., 2000). Targeting the Lyman alpha (Ly) emission produced in high-redshift star formation, the narrow-band imaging can select high-redshift galaxies by the excess flux in the narrowband compared to the broadband. Thousands of high-redshift Lyman alpha emitting galaxies (LAEs) have been selected this way with ground-based 4-10m telescopes from redshift 2 to redshift 6.6 (e.g., Guaita et al., 2010; Gawiser et al., 2007; Nilsson et al., 2009; Ouchi et al., 2008; Finkelstein et al., 2008; Ouchi et al., 2010; Hu et al., 2010), with a very large fraction being spectroscopically confirmed (e.g., Kashikawa et al., 2011; Jiang et al., 2017). The large number of LAEs have ensured intense studies of the galaxy formation and evolution (e.g., Gronwall et al., 2007; Finkelstein et al., 2009; Ouchi et al., 2010), and the large scale structure of the universe over the cosmic time (e.g., Steidel et al., 2000; Zheng et al., 2016; Cai et al., 2017; Jiang et al., 2018).
At 7, the epoch of reionization (EoR), the resonant scattering of Lyman alpha photons in the neutral hydrogen intergalactic medium (IGM) makes it very important to study LAEs in the EoR, which will enable us to put constraints on the fraction of the neutral hydrogen in the EoR and its evolution with time(Malhotra & Rhoads, 2004). However, previous searches at 7 only yielded about two dozen LAEs (Willis & Courbin, 2005; Iye et al., 2006; Cuby et al., 2007; Ota et al., 2008, 2010; Hibon et al., 2011, 2012; Shibuya et al., 2012; Konno et al., 2014), with several being spectroscopically confirmed. The small number of 7 LAEs were mainly limited by the moderate field-of-views (FOVs, 0.2 deg2) of the telescopes/instruments with which the surveys were carried out.
Recently, thanks to the emergence of the new-generation survey cameras with very large FOVs, e.g., Dark Energy Camera (DECam, FOV 3 deg2, Flaugher et al., 2015) and Hyper-Suprime Camera (HSC, FOV 1.8 deg2, Miyazaki et al., 2012), which take advantage of the full prime focal plane of the telescopes, we can carry out narrowband imaging surveys for LAEs in the EoR with times higher efficiency than previous ones. Two such narrowband surveys with DECam (Zheng et al., 2017) and HSC (Ouchi et al., 2018; Itoh et al., 2018) have been underway. They use narrowband filters designed to avoid strong sky emission and absorption in the bandpass. However, since such narrowband filters are quite large (e.g., filter diameter 600mm) and operated with a much smaller focal ratio (about f/3 to f/2 for the prime focal plane), the design and manufacture of these narrowband filters are quite challenging. The narrowband filter encounters wavelength shifts in the case of small focal ratios, and the wavelength shifts may vary at different locations of the filter. This could bring unwanted strong OH emission lines into the filter, and decrease the survey efficiency for 7 galaxies.
In this paper, we discuss the design for the first narrowband filter for DECam, the NB964 filter. With this filter, a survey named LAGER (Lyman Alpha Galaxies in the Epoch of Reionization) is ongoing since December 2015 (see Zheng et al., 2017; Hu et al., 2017, for the first results of LAGER). The parameters of the narrowband filter NB964 are optimized to maximize the survey efficiency for 7 galaxies.
This paper is organized as follows. In Section 2, we optimize the design for the narrowband filter NB964 for DECam. In Section 3, we introduce the production of the narrowband filter NB964. In Section 4, we report lab tests, on-site tests and observations with the narrowband filter NB964, and discuss the impact of the filter profile. We finally summarize the results in Section 5.
2 Optimizing the narrowband filter NB964 for DECam
We design the narrowband filter with the purpose of optimizing the narrowband survey for 7 Ly galaxies. The filter bandpass, defined by the central wavelength and its full width at half maximum FWHM, is specified by considering the night sky OH emission spectrum, the H2O absorption spectrum, and the DECam quantum efficiency (QE) curve close to 1. We also take into account the effects of different angles of incidences (AOIs) and focal ratios (F-ratios) on the filter design. Finally, the filter parameters are well tuned based on the Ly luminosity function model, so that the survey efficiency for LAEs at 7 is maximized.
2.1 CCD QE and Sky-background close to 1
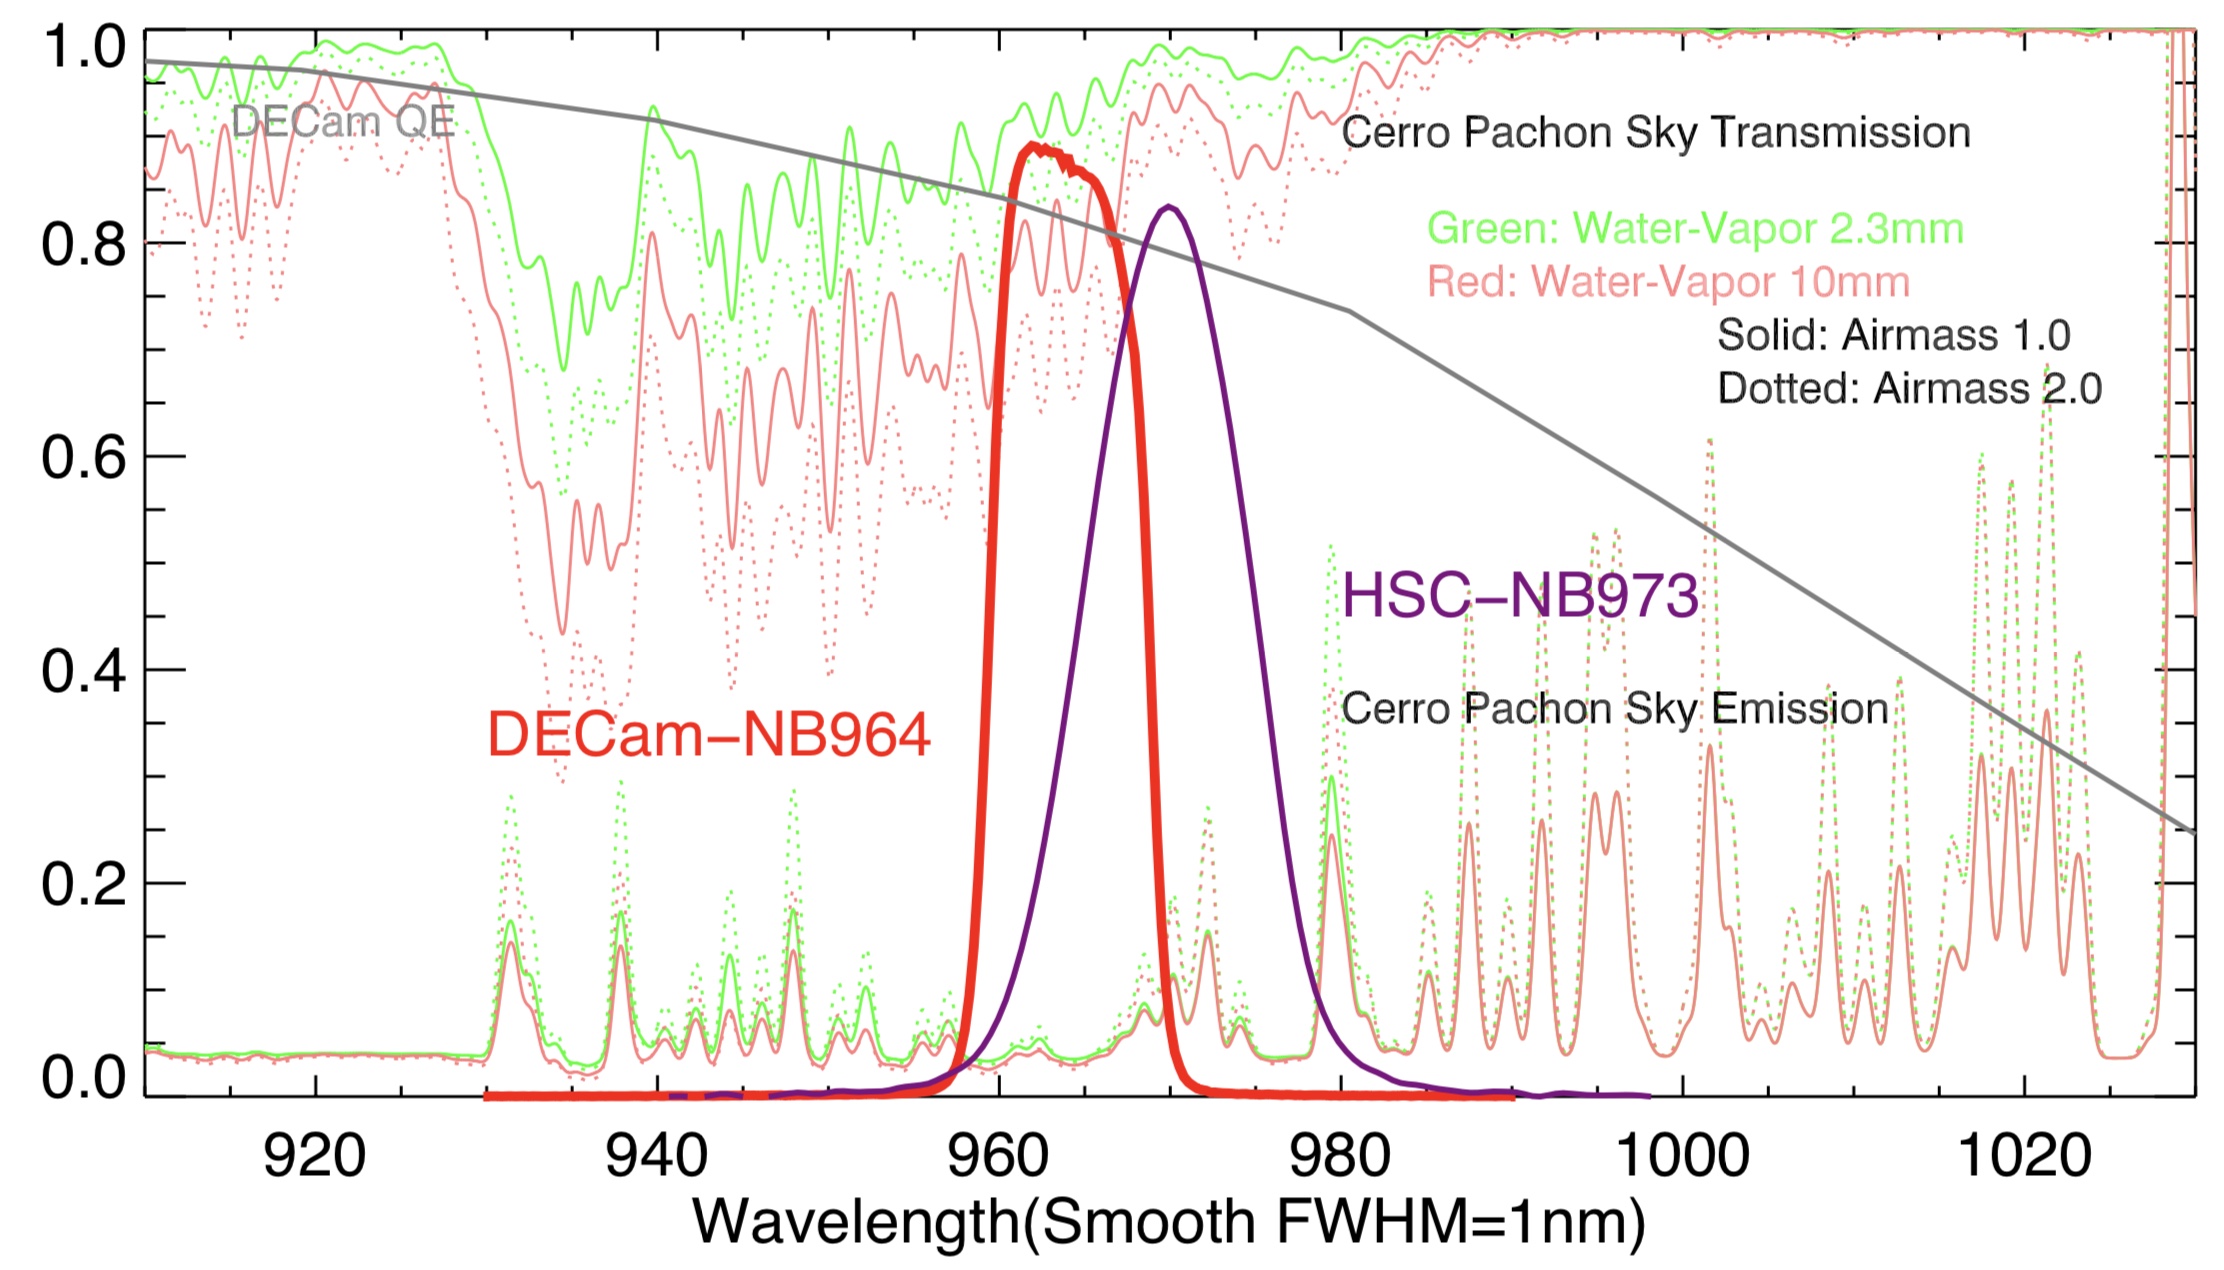
As a ground-based optical survey with CCDs, the CCD QE curve and the sky-background spectra (Fig. 1) can roughly determine the wavelength range of the narrowband filter, and hence set the redshift range of the corresponding high- LAE survey. The CCD QE drops sharply towards 1, so that the central wavelength of the filter should be set shorter than 1 , which gives an upper boundary of the LAE surveys’ redshift of 7.3.
We employ the near-Infrared sky background data from Gemini South111Gemini South is located at Cerro Pachon, Chile. The observational conditions of the site are listed at https://www.gemini.edu/sciops/telescopes-and-sites/observing-condition-constraints to investigate the sky background at wavelength around 970nm, which is the wavelength of the 7 Ly line in the observer-frame. The Gemini South Observatory is located on a mountain adjacent to Cerro Tololo where DECam resides, only about 10 km away but at 500m greater altitude. Therefore, it would be a good approximation to use the sky background data at the site of Gemini South to design our narrowband filter.
The Gemini website lists the near-Infrared sky transmission and emission data under airmass values of 1.0, 1.5, 2.0, and water-vapor column values of 2.3 mm, 4.3 mm, 7.6 mm, and 10 mm, respectively. Both airmass and water-vapor column would affect sky transmission and emission. A larger column water-vapor means larger absorption on the sky transmission, and a higher airmass leads to stronger sky emission. In the following, we choose a water-vapor column of 10 mm which is the worst case, and the airmass of 1.0 and 2.0 to examine the filter bandpass.
2.2 Optimizing the Narrowband Filter Profile
In this section, we discuss how to design the NB964 profile for the purpose of maximizing the LAE survey capacity with the sky background and CCD QE close to 1 shown in Sec. 2.1. We also consider the changes of the filter profile modified by different AOIs and F-ratios.
2.2.1 SNR Spectrum from Sky-background and CCD QE
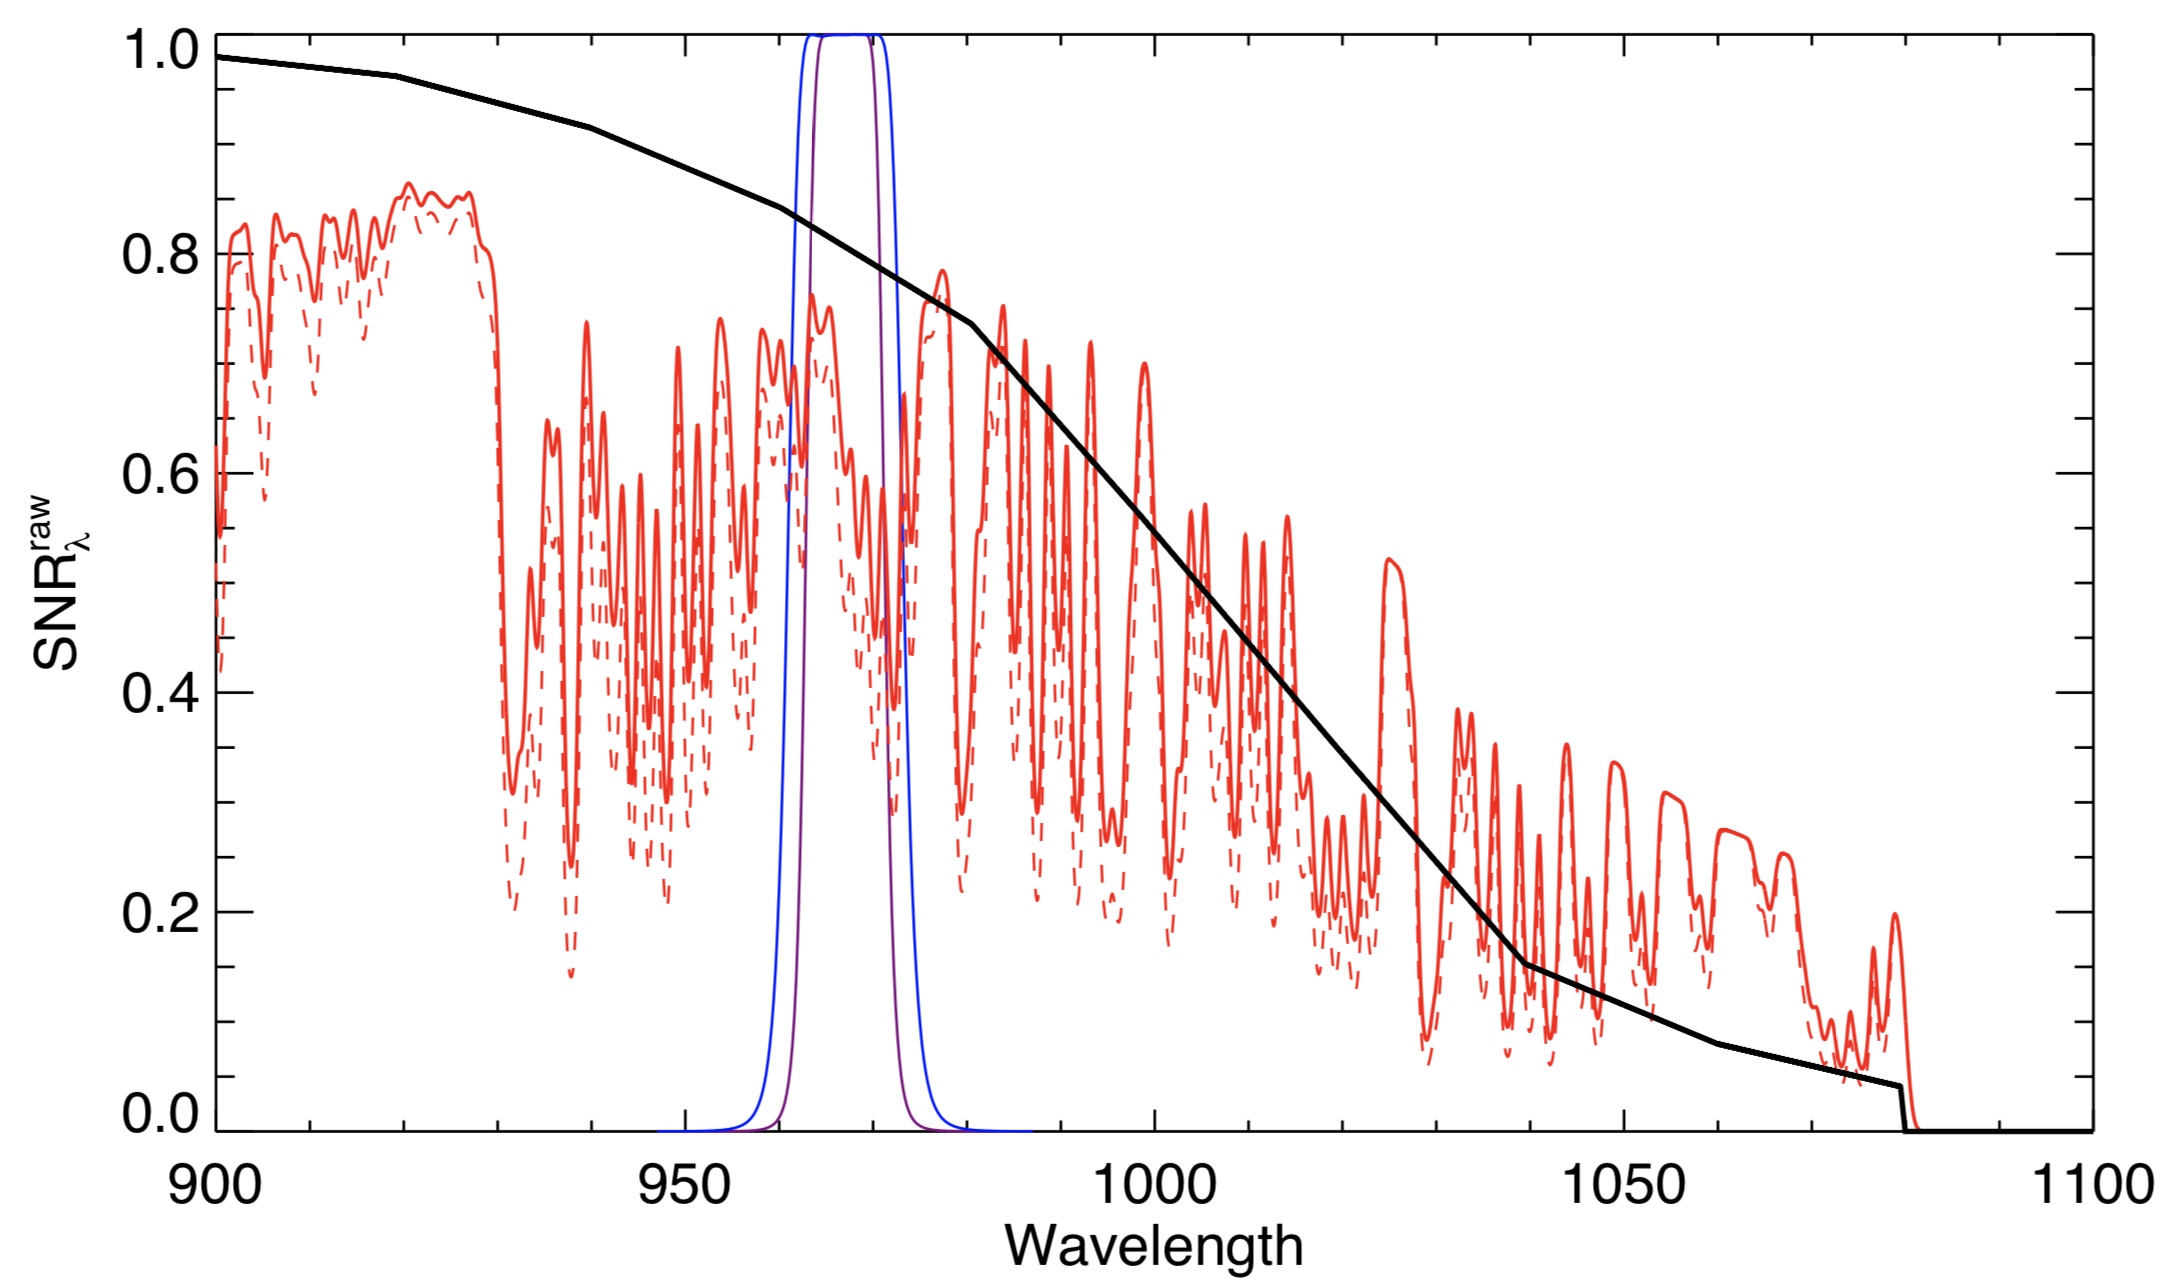
In the case of sky dominated background, the signals and the noises of a narrowband imaging survey are affected by the sky transmission and the sky emission, respectively. Therefore, we can define a raw signal-to-noise ratio (SNR) spectrum, which is a ratio of source signal to the sky background fluctuation (Sky_BKG_RMS) as a function of wavelength , to estimate the approximate filter bandpass. The raw SNR spectrum is defined as
| (1) |
where T is the survey exposure time with the narrowband filter, is the input source spectrum, is the sky transmission, Skyλ is the sky emission spectrum, and QEλ is the DECam quantum efficiency. Assuming a flat input spectrum (), we obtain a SNR spectrum as shown in Fig. 2. The SNR spectrum follows the CCD QE curve on the whole, while in detail the SNR spectrum is modified by the sky transmission and emission. In the wavelength range of 930 nm 1, there are two SNR peaks at 962nm and 975nm, separated by a big gap in between. Therefore, an efficient narrowband filter for LAEs at 7 should have the central wavelength set at around one of the two peaks. To display the possible location of the filter in the raw SNR spectrum, in Fig. 2 we overplot two models of the filter profile generated by Materion around the first peak, with FWHM = 8.74 nm and 12.76 nm, respectively.
2.2.2 Effects of AOI and F-ratio on the Filter Profile
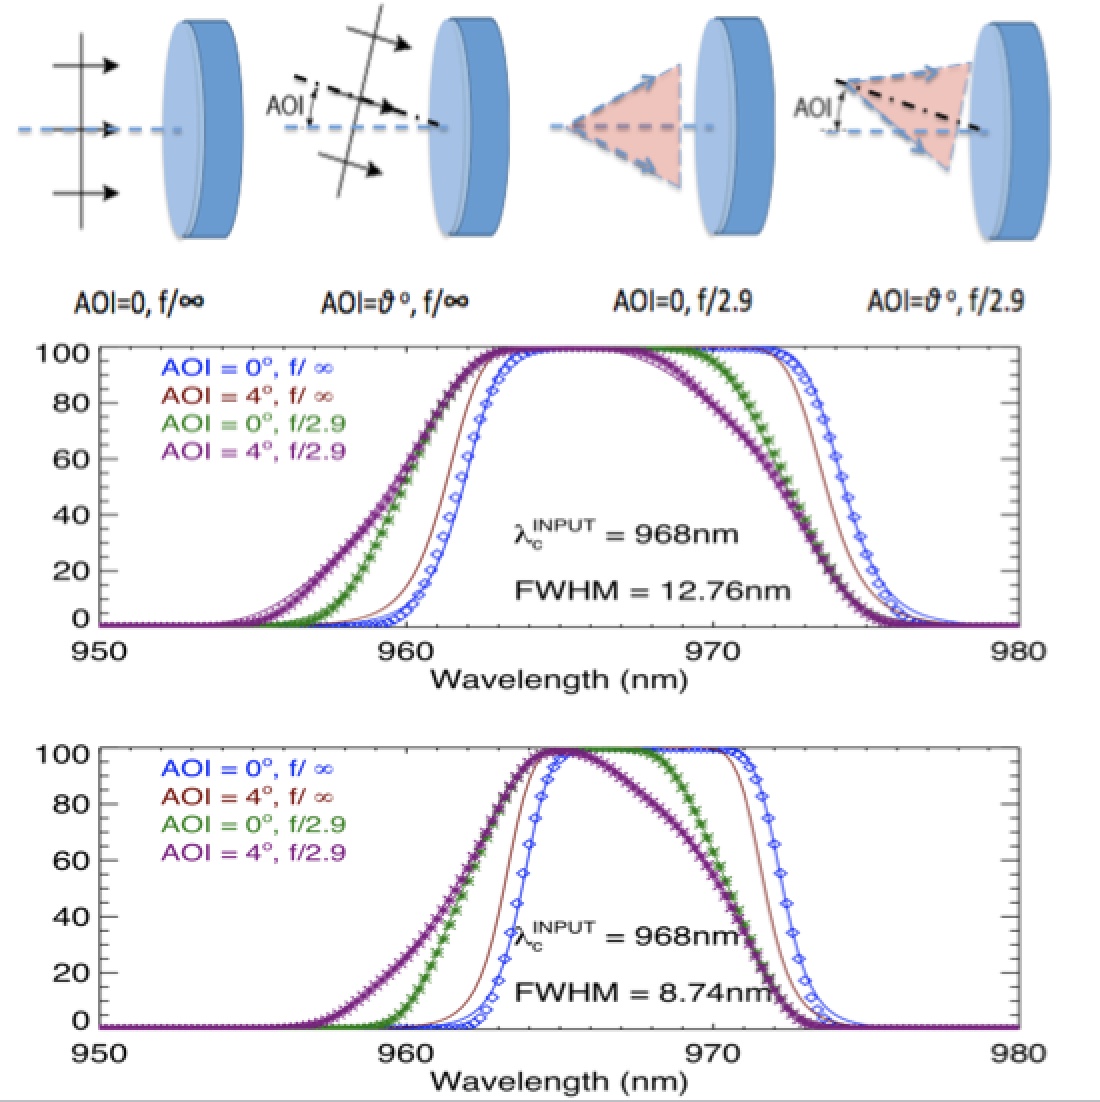
In this section, we create the model filters to see the effects of AOI and F-ratio on the filter bandpass. AOI is the light beam’s incidence angle, and F-ratio is the ratio of an optical system’s focal length to the diameter of the entrance pupil. There are several F-ratios for DECam and the Blanco 4-m telescope. For the prime focus of the Blanco 4-m telescope, the focal ratio is f/2.7 (Flaugher et al., 2015). With the optical design, the focal ratio for the DECam focal plane is f/3.1222See DECam Data Handbook at https://www.noao.edu/meetings/decam/media/DECam_Data_Handbook.pdf. While at the position of the filter slot, the focal ratio is f/2.9 for NB964’s operational environment. Ideally the filter profile is assumed in a square ”boxcar” shape, which is adopted in the previous section. In reality, the manufactured filter usually has a shape between a square ”boxcar” and a gaussian, and the filter profile changes at different AOI and F-ratio.
We discuss the changes of the filter profile in 4 cases of different AOI and F-ratio, which is presented in Fig. 3. In the case of a collimated light beam falling at normal incidence, which means AOI = 0∘ and F-ratio f/, the model profile of a narrowband filter, , can be fitted with a convolution of a square ”boxcar” shape (width = FWHM) and a gaussian function ( = FWHM/2.35). If a collimated light beam falls at a non-zero incidence angle to the filter, i.e., AOI 0∘ and F-ratio f/, the bandpass of the interference filter shifts towards bluer wavelengths, according to
where is the wavelength of the input light and 2.0 is the mean refractive index of the material of multilayers. For our narrowband filter, approximately equals to 970 nm. Therefore, when the incidence angle of the input light beam varies from 0∘ to 4∘, the modeled filter profile would shift from 0 nm to -0.59 nm in the wavelength direction entirely.
If the input light beam is not collimated, e.g., in the case of and zero incidence angle, the input angle would vary from 0∘ at the filter center to 9.88∘ at the filter edge. At the filter’s annulus to , which corresponds to the input angle to , the wavelength shift of the transmission curve is a value between and + . Based on Eq. 2.2.2, the wavelength shifts vary from 0 nm in the filter center to -3.6 nm on the edge of the filter. The corresponding normalization of the transmission curve in that annulus is scaled by the ratio of the solid angle of the annulus to that of the whole aperture. Therefore, the total output of the filter profile is an integration over the aperture of the filter radially, which is
| , | ||||
This equation describes a convolution of the normal-incidence filter profile with a boxcar function that extends from the maximum wavelength shift to zero wavelength shift. The output profile is shown as the green lines in Fig. 3. If the input f/2.9 light beam falls at a non-zero incidence angle, the filter profile will be distorted in a way that a part of the profile at the red shoulder will be cut and added back to the profile at the blue wing, which is shown as the purple lines in Fig. 3.
In the following sections, we define the filter bandpass in the cases of filter profiles with F-ratio of f/2.9 and two AOI values of 0 deg and 4 deg, respectively.
2.2.3 Filter Design for the Maximization of the LAE Survey
We define the real filter bandpass with which the LAE survey efficiency is maximized. Including the real filter shape , the raw SNR spectrum in Eq. 1 is updated to be
| (4) |
where the definitions are the same in Eq. 1 except that the filter profile is added. The central wavelength and FWHM should be chosen to avoid the strong sky emission lines inside, so as to maximize the detecting efficiency for LAEs.
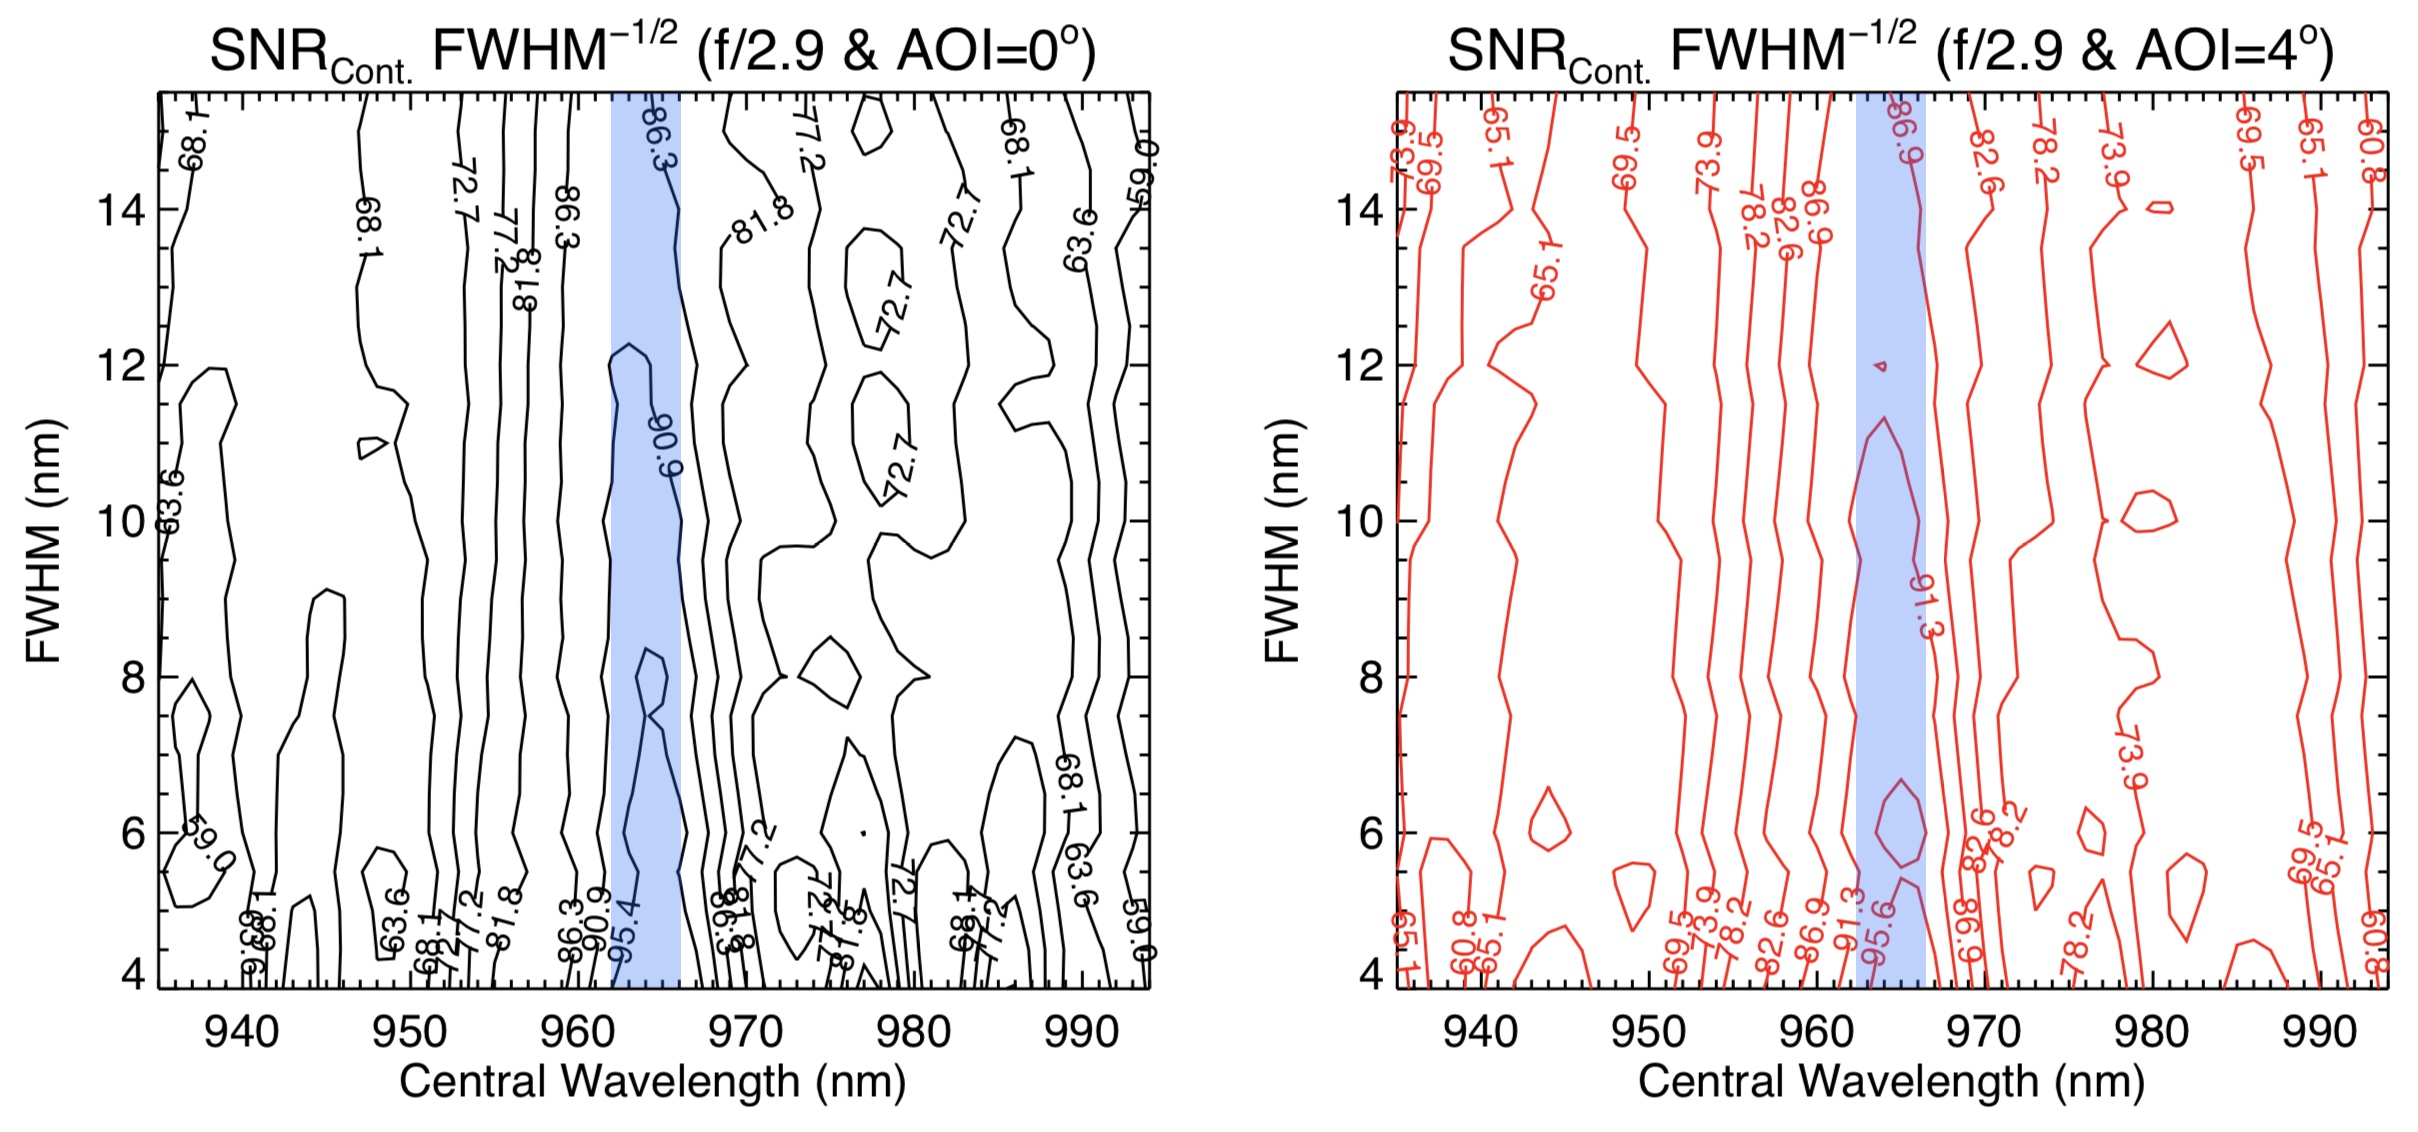
Considering the two cases of the input spectrum , a line and a continuum, the total SNR (integrated over the filter profile) would be SNR and SNR for the line and the continuum, respectively. Therefore, the distributions of SNR and SNR are a function of the central wavelength and roughly independent of FWHM. We display the distributions of SNR and SNR as a function of and FWHM in Fig. 4. The contours show that the total SNR of the narrowband survey peaks at 9652 nm, which indicates that the best central wavelength of the filter bandpass should be around this wavelength range.
Next we define the filter width FWHM, which is directly connected to the survey volume. A wider NB filter design (larger FWHM) would cover a larger survey volume, but the inclusion of more sky background in the NB filter would make the survey depth shallower, and hence decreasing the survey efficiency. However, when choosing a narrower NB filter, fewer sky background will be covered, but the survey volume becomes smaller. Therefore, it is required to balance the survey volume and the survey depth when designing the narrowband filter for DECam. The strategy would be the same for future narrowband surveys in NIR regions with dense sky background, such as (possible) LSST narrowband surveys for galaxies at 7.
The survey depth is quantified by the limiting luminosity , which is converted from the 5- background RMS signal times the luminosity distance modulus. It is calculated as
where is the luminosity distance at redshift , and is the conversion factor from background RMS signal in Eq. 4 to a detection flux limit . Since is a constant, after integrating over , it is obvious that is a function of and FWHM.
We can quantify the survey efficiency by estimating the number of LAEs which can be detected based on a survey volume and a survey depth. Assuming a Schechter luminosity function with characteristic luminosity L∗, characteristic density and faint-end slope , the estimated number of LAEs between redshift and + is caculated as
where is the minimal line luminosity in the case of a boxcar shape, accounts for the effect of a non-boxcar shape, and is an incomplete gamma function representing the integration over the Schechter luminosity function. Because = /121.567 nm, the survey volume V between redshift and + is also a function of wavelength . In the filter center, = 1, while decreases towards the wings of the filter. Therefore, the total number of detectable LAEs from a narrowband imaging with filter profile is an integration over Eq. 2.2.3, which is
where is the number of detectable LAEs with an ideal square boxcar shape filter, and is the modification on that number when the real NB filter profile is not in that shape. By adjusting the exposure time , we can reach = 0.5 , a typical survey depth, then assuming the faint-end slope = -2333Through an ultra-deep spectroscopic measurement of the faint-end slope for LAEs at = 5.7, Dressler et al. (2015) constrained the faint-end slope to -2.35 -1.95 (1). So we choose = -2 in the calculation. and integrating over the luminosity range of 0.5L* to 10L* with the gamma function, the relative number of observed LAEs under different parameters of the narrowband filter is derived.
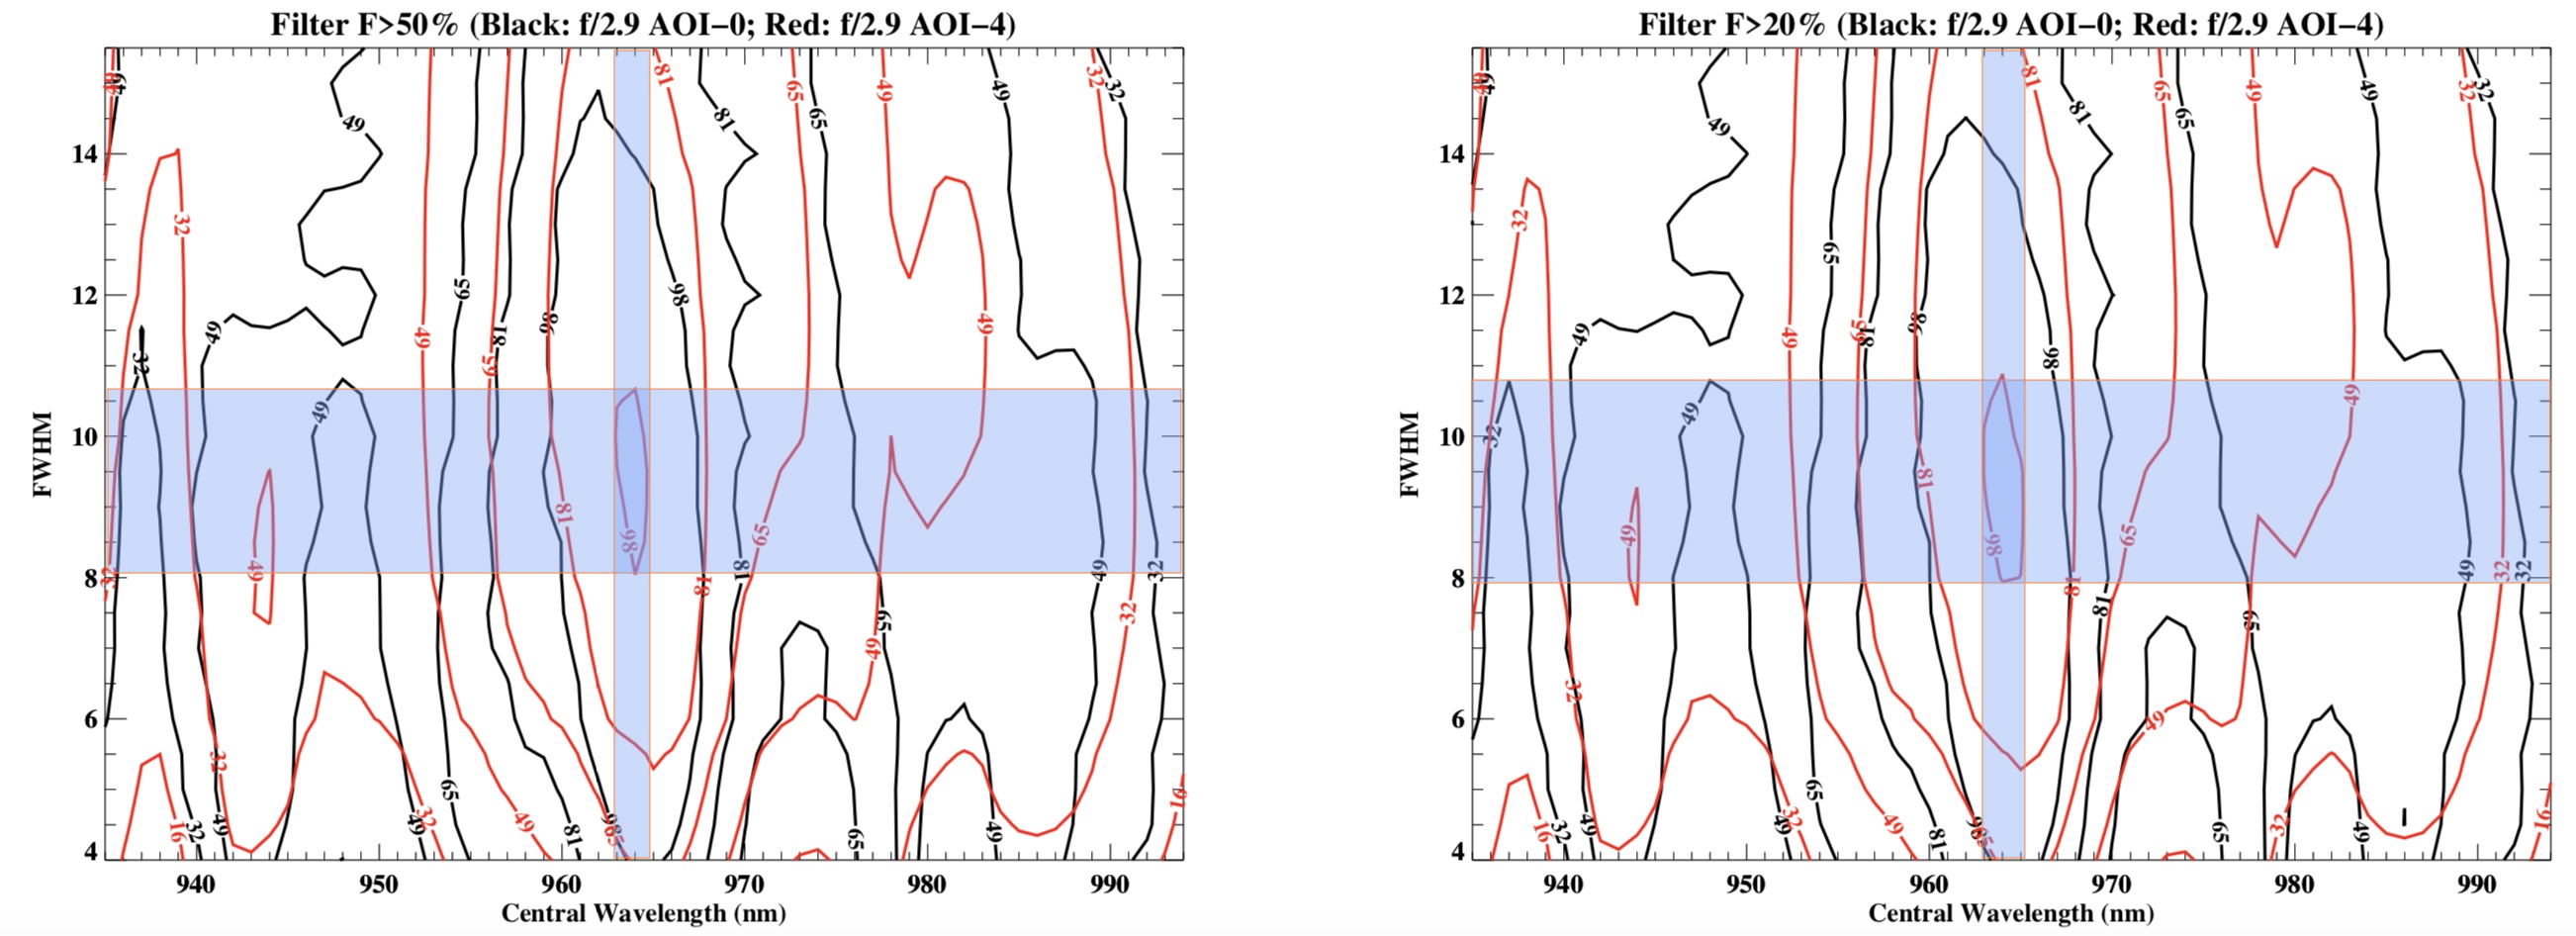
In Fig. 5 we plot the contour of the relative number as a function of filter parameters and FWHM. The integration over the filter profile is applied in the wavelength range where the transmission is 50% and 20% of the peak value, respectively. The contours of the relative number show peak values at central wavelength of 9641 nm and FWHM value of 91 nm. It indicates that with these filter parameters the survey efficiency can be maximized.
3 Manufacture of the DECam Narrowband Filter NB964
3.1 Recent Technological Advances
Thanks to the rapid development in coating technologies, narrow bandpass filters with superior uniformity over a large area have become practical. This provides opportunities for narrowband imaging surveys with large field of views such as large focal planes of DECam and HSC. Optical companies like Materion have built new facilities to manufacture this kind of filters (Mooney et al., 2014). Among different deposition processes, Materion chooses the reactive magnetron sputter deposition because of its low risk, high stability, high precision, and strict uniformity (for details, see chapter 4 of Mooney et al., 2014). In this process, material is sputtered from a cathode in a new coating chamber specially designed for large optics at Materion. This sputtered material bombards the substrate to be coated, where it is deposited. It provides sufficiently accurate control on the thickness of coating layers that bandpass features can be controlled to accuracy or even better for filters with diameters of 600mm.
3.2 Bandpass Specification
We submitted the basic parameters of the NB964 filter as well as technical requirements to Materion in 2014. The technical specifications are summarized as below.
3.2.1 General Specifications of NB964
- Substrate dimensions
-
620 mm diameter circle.
- Substrate material
-
Fused silica.
- Minimum Clear Aperture
-
600mm diameter circle, concentric with substrate diameter.
- Thickness
-
Total 13.0 mm, inclusive of substrates and coatings.
- Surface parallelism
-
30 arc-seconds or better.
- Flatness
-
Transmitted wave front error /4 in 125mm diameter sub-aperture.
- Bubbles and inclusions in substrate
-
Bubble class zero with a requirement of per 100 cm3.
- Striae
-
Grade A with a requirement of 30nm.
- Pinhole limitations
-
- diameter
-
None allowed;
- to diameter
-
1 per 50mm diameter region of the filter;
- diameter
-
In each 10mm diameter within the clear aperture, the area of the total pinholes must be less than the equivalent area of a pinhole.
- Surface finish
-
60-40 Scratch-Dig.
- Durability
-
Mil-C-48479 (moderate abrasion).
- AR coatings and edge sealing
-
Both surfaces must be anti-reflection coated with as hard a coating as possible. The filter edges should be hermetically sealed against moisture penetration. Also, filter edges should be made as black as possible to help mitigate the scattered light from the filter edges.
- Radioisotope limits in filter substrate
-
U 0.8 ppm, Th 2.5 ppm, and K 0.03% (by weight).
- Radioisotope limits in filter coatings
-
U 80 ppm, Th 250 ppm, and K 3% (by weight).
- Index of refraction of coatings
-
We expect to minimize the bandpass shift with the increasing angle of incidence. Since the transmitted wavelength goes as , the effective should be as high as possible.
- Edge masking
-
The out-of-band blocking should apply equally to the part outside of the clear aperture.
- Environmental conditions
-
- Operating range
-
Temperature to C; humidity – (dry nitrogen environment); elevation 2200m (7220 ft), pressure 570 – 590 torr.
- Survival range
-
Temperature -56∘C to C; humidity 0 – 100%; elevation 4500m (15000 ft), pressure 410 – 780 torr.
- Operating focal ratio
-
f/2.9.
- Beam angles of incidence
-
0 to 4∘ for f/2.9 beams (maximum range 0–12∘).
3.2.2 Passband Specifications
-
•
The passband is specified for f/2.9 beam at normal incidence, at operating temperature C.
-
•
Central wavelength: to apply at all locations within the clear aperture (for normal-incidence, f/2.9 beam).
-
•
Average FWHM: (for normal-incidence, f/2.9 beam).
-
•
The minimum allowable peak transmission () of the filter is 80%. This is to apply for all spatial positions within the clear aperture.
-
•
Spatial variations in are to be less than 5.0% of for all positions in the clear aperture.
-
•
The transmission within the wavelength range at 90% of the peak transmission (BW90) should not fall below 85% of the peak transmission.
-
•
The bandwidth at 10% of the peak transmission (BW10) should be no larger than 150% of the FWHM for a normal-incidence, f/2.9 beam.
-
•
Ghost image amplitude: To quantify the brightness of ghost images caused by double reflections within the filter, we define the “fractional ghost flux” as
where and are the transmissivity and reflectivity of the front side of the filter as a function of wavelength, respectively, while and are for the back side of the filter. We require .
-
•
Blocking outside of passband:
300 to 1050 nm: (0.01%) 1050 to 1200 nm: (0.1%)
4 Tests of the DECam Narrowband Filter NB964
Materion finished the manufacture of the narrowband filter NB964 in the summer of 2015. Based on a series of tests, we find that the technical parameters and specifications of NB964 agree well with the design introduced in sections §2 and §3. These tests include the lab tests at Materion, the on-site tests with DECam at CTIO, and on-sky observational tests, which are introduced as below.
4.1 Lab Tests at Materion
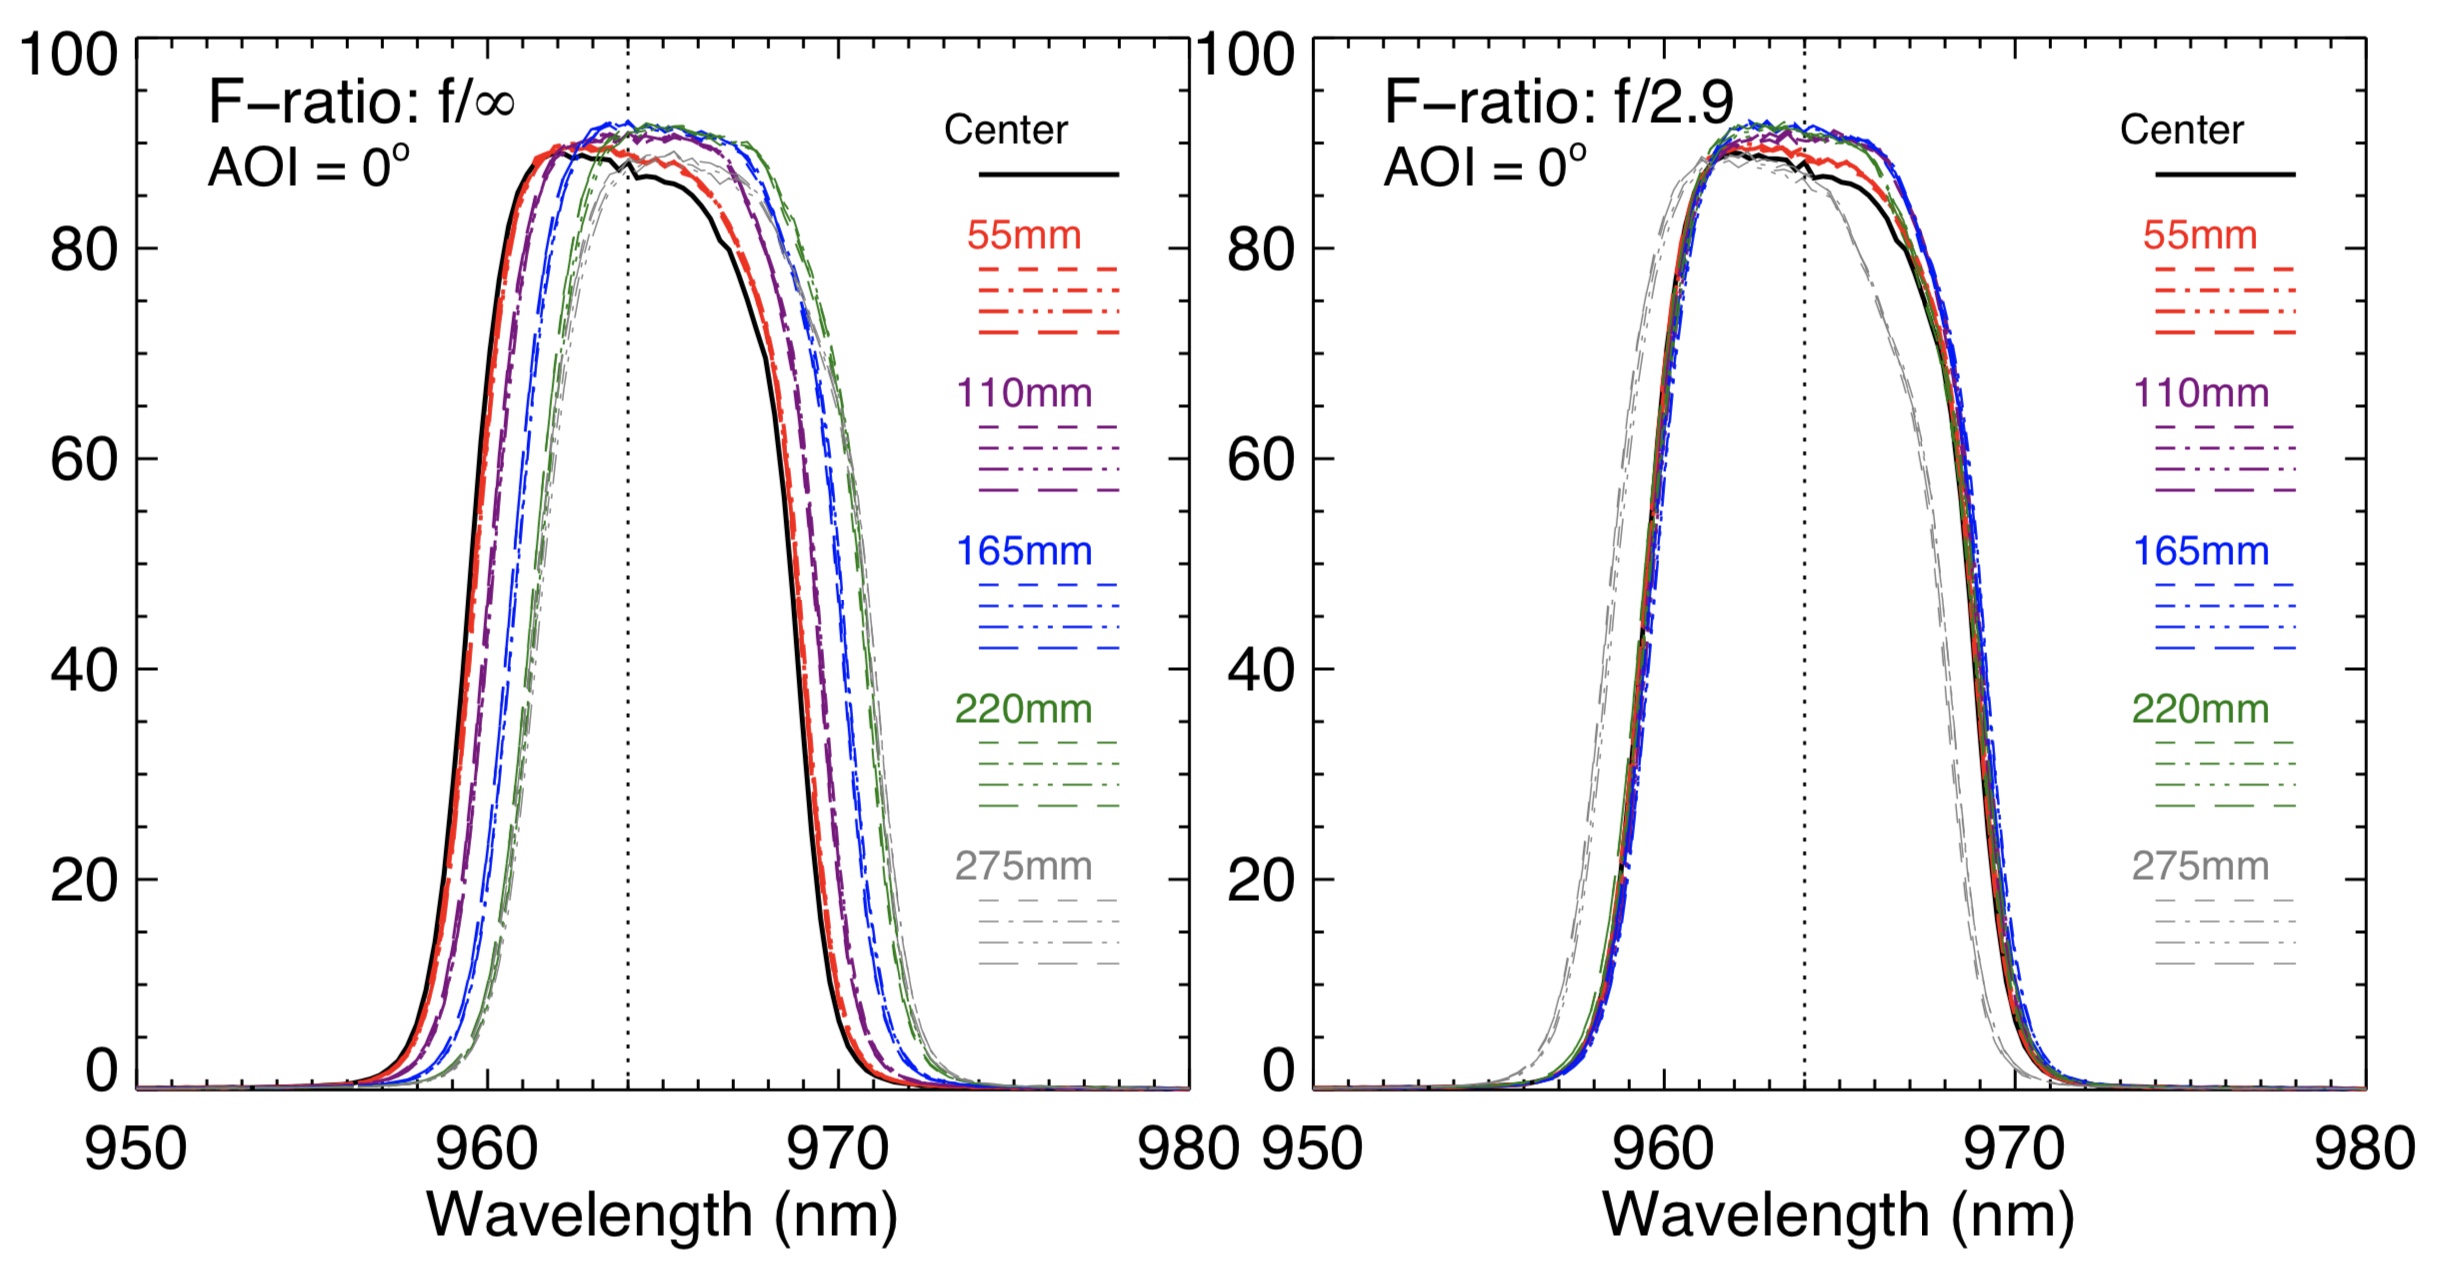
Materion obtained the lab test results of NB964 before the filter was ready to ship to CTIO. The lab tests of NB964 include measurements of the transmission curves, the blocking curves, and the basic filter parameters. The transmission curves at various positions of NB964 were measured by a spectrometer with a light beam at the normal incidence and room temperature of 25 ∘C, which are plotted in the left panel of Fig. 6. The peak transmissions at different positions are 90% on average and show spatial deviation (the maximum difference) of %, which meet the design requirements ( 80% and spatial variation 5%) listed in Sec. 3.2.2. With AOI = 0∘ and F-ratio f/, the transmission curves at different locations of the coated filter NB964 show systematic red-shifts in wavelength as a function of increasing radii. The central wavelength shows slight shifts toward the red side from 964nm to 966nm when moving radially outward from the center. This red-shifts adjustment is made for the purpose of observing with the actual focal ratio, as discussed in the following.
Based on Eq. 2.2.2, we derive the transmission curves of NB964 with AOI = 0∘ and F-ratio f/2.9, which is plotted on the right panel of Fig. 6. This plot shows that the transmission curves with f/2.9 measured at radii of [55, 110, 165, 220] mm in the 4 different directions all match well with each other with wavelength shifts 0.3 nm. Although the transmission curves measured at the radius of mm show a systematic blue-shift by 1 nm, it still meets our requirement of 9642 nm for . The blue-shift at larger radii is caused by the inadequate red-shift under the condition f/ (grey lines on the left panel of Fig. 6). The red-shifts with radii represent the special treatment for the operational focal ratio f/2.9, so that the transmission profile of NB964 when observing with DECam should be consistent at different locations of the filter.
Since the operating temperature of the NB964 filter is 5 ∘C, Materion provided the calculated filter parameters under the condition of 5 ∘C. The resulting central wavelength and FWHM are 964.2 nm and 9.2 nm, respectively.
4.2 On-site Tests with DECam
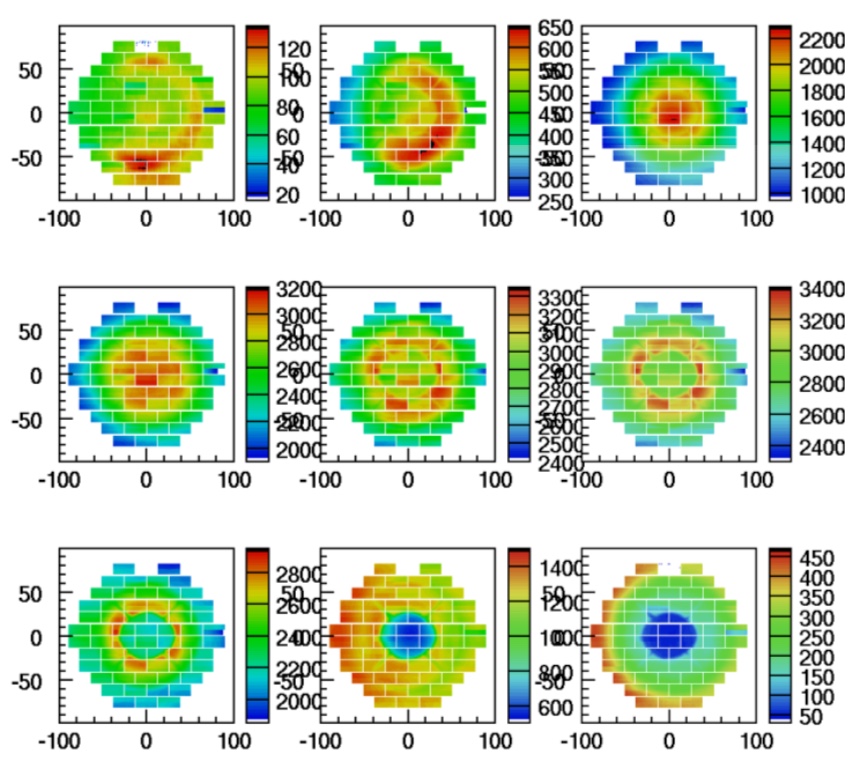
The filter was shipped to CTIO and installed in the DECam filter box in late 2015. The observation with this filter started in December 2015. Later on Oct. 24 2016 NOAO staff A.K. Vivas used DECal444DECal website: http://instrumentation.tamu.edu/DeCal.html(Marshall et al., 2013), a spectrophotometric calibration instrument implemented in the Dark Energy Survey (DES) project, to measure the on-site transmission of NB964 with DECam. DECal uses a 2nm wide tunable source to illuminate the dome flat which allows us to measure the transmission curve of NB964 as a function of wavelength. The 2 dimensional focal plane responses at different wavelength bins are plotted in Fig. 7.
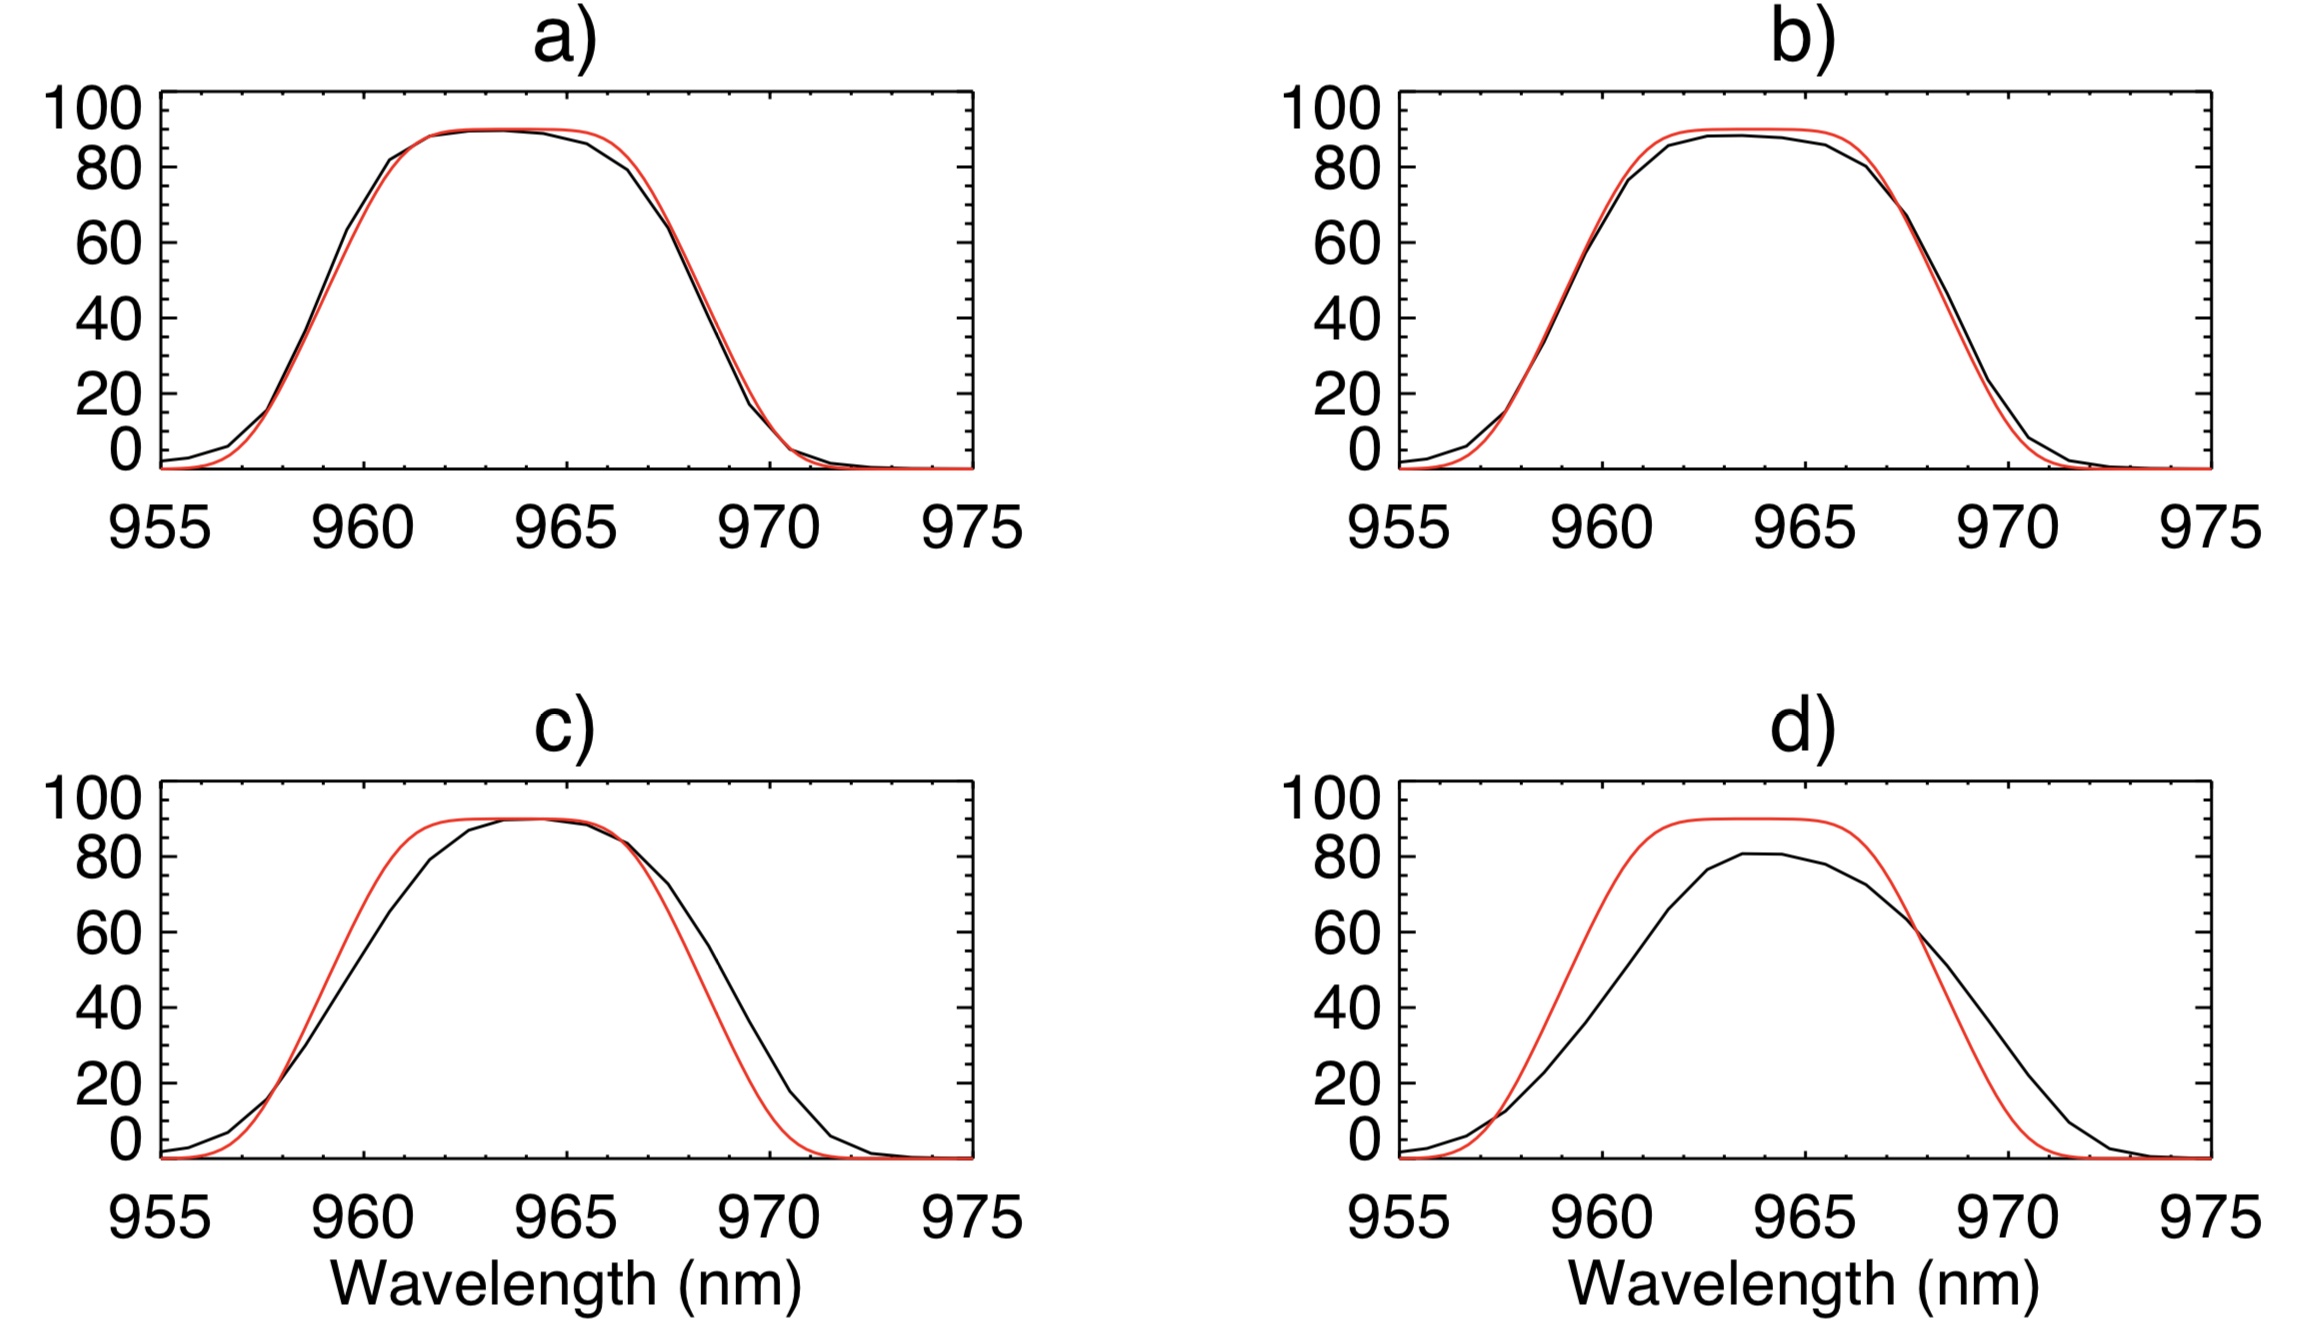
In Fig. 8 we show the transmission curves averaged in different annuli (innermost 2 CCDs, annulus next to the innermost, annulus next to the outermost, and the outermost annulus) of the focal plane. For comparison, we also plot the calculated NB964 filter profile with f/2.9 and AOI=0∘. Obviously, in the inner two annuli the transmission curve (Fig 8-a and 8-b) each matches very well with the modeled filter profile and the Materion test (Fig. 6), while in the outer two annuli the throughputs shift red-ward slightly (by 0.7 nm) and in the meantime become wider. The on-site tests are made through the complete telescope optical system, and we suspect that the difference between that and the measurements made at Materion is due to the properties of the DECam optical corrector (Doel et al., 2008). It could also be due to the non-uniform dome flat on the outside of the focal plane, where AOI 0∘. Therefore we should use a sky/star flat in the data reduction pipeline. Currently we use the z-band star flat.
4.3 On-sky Observations with DECam
The LAGER survey with NB964 on DECam started in Dec. 2015. It is designed to select more than a hundred 7 LAEs over an area of 12 deg2 in four fields (total Volume: 8 cMpc3). Currently, LAGER has collected 123 hrs NB964 narrowband imaging in four fields (CDF-S, COSMOS, WIDE-12 and GAMA-15) taken during 18 nights in 2015-2018, making it the largest narrowband survey for LAEs at 7 so far. The deepest NB964 imaging is done in COSMOS, where we have obtained 47.25 hrs NB964 exposure in a 3 deg2 field. The exposure time per NB964 frame is 900s. Consecutive exposures are dithered by 100′′ so that chip gaps and bad pixels do not lead to blank areas in the final stacks. We also take 0.5-1 hr z-band and -band exposures per field to exclude possible transients. The NB964, DECam z-band and DECam -band data were scientifically reduced by DECam Community Pipeline (Valdes et al., 2014). Here we summarize the observational characteristics of the NB964 filter taken in Feb. 4-9, 2016 .
4.3.1 On-sky Count-rates of NB964
The count-rate values of the sky background in individual frames of NB964 are in the level of 0.5-1.0 ADU/s. The typical GAIN value of DECam is 4 e-/ADU. Therefore, the sky values are 1800-3600 e- in one NB964 exposure of 900s. These values correspond to the NB964 sky brightness of 19.8-19.1 mag, which is typically 1 mag fainter than the sky brightness in z-band with 50 deg to the bright moon (18.2-18.7 mag, extracted from DECam ETC555DECam ETC website: http://www.ctio.noao.edu/noao/content/Exposure-Time-Calculator-ETC-0 ). As noted in the DECam handbook, some amplifiers are non-linear below 1000 e-. While this is corrected in the reduction pipeline, we prefer to operate out of this regime by taking long exposures ( 900s) with N964 so that there is no chance of photometry of very faint objects being compromised.
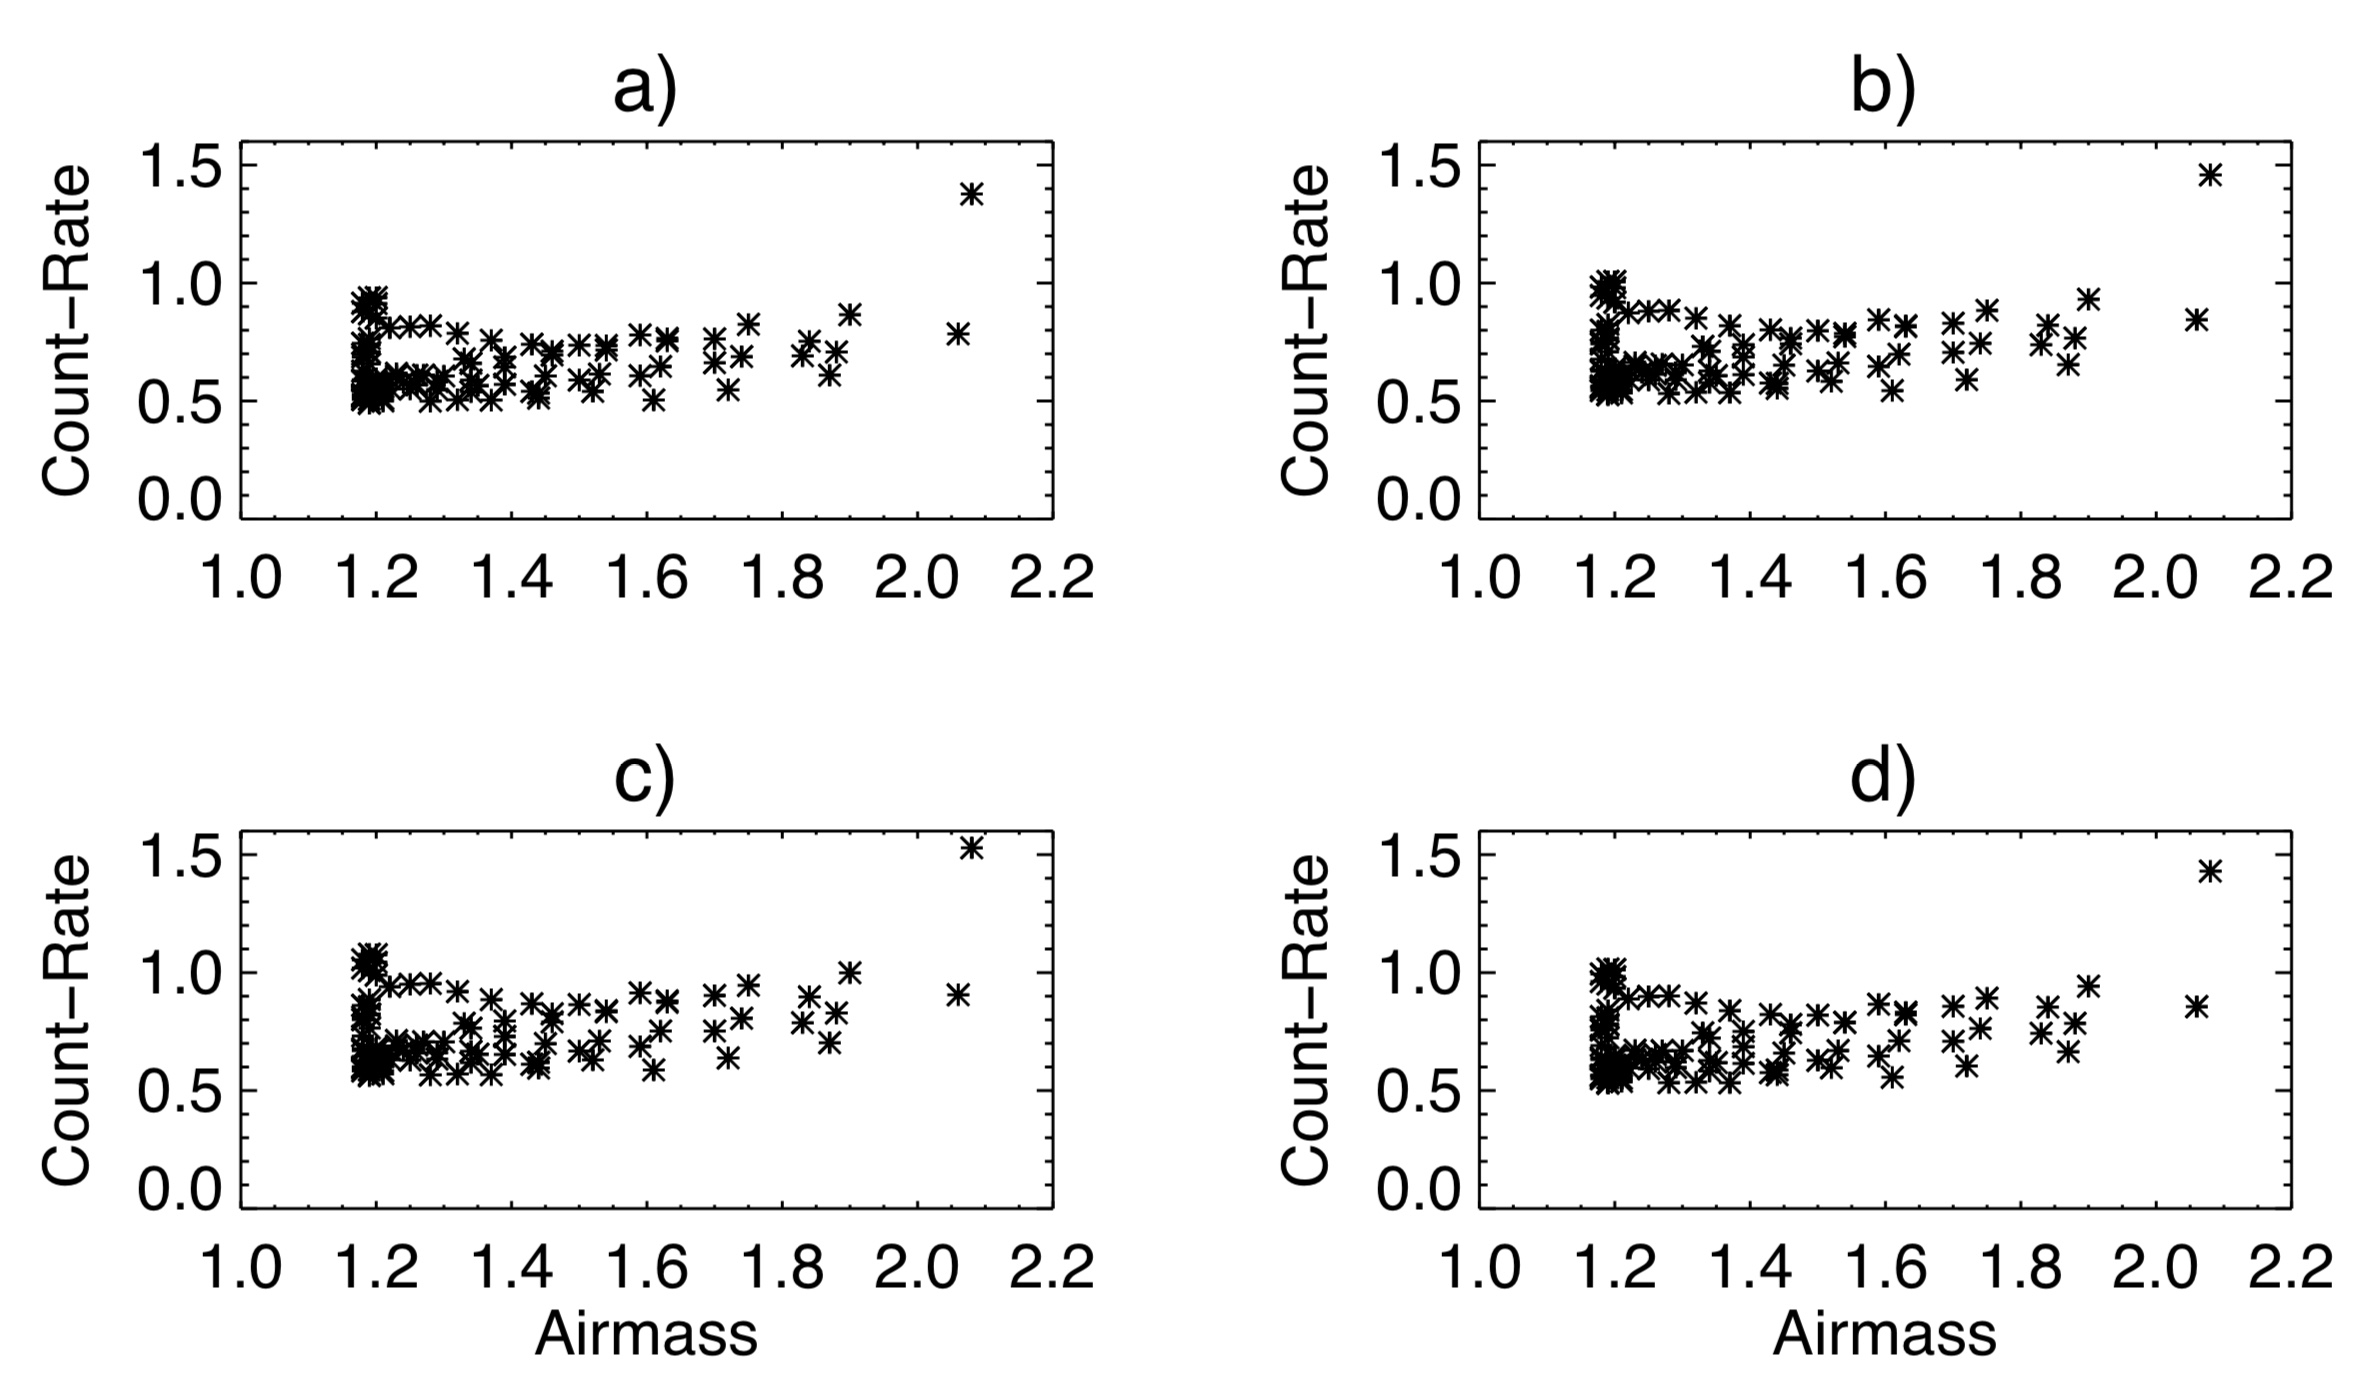
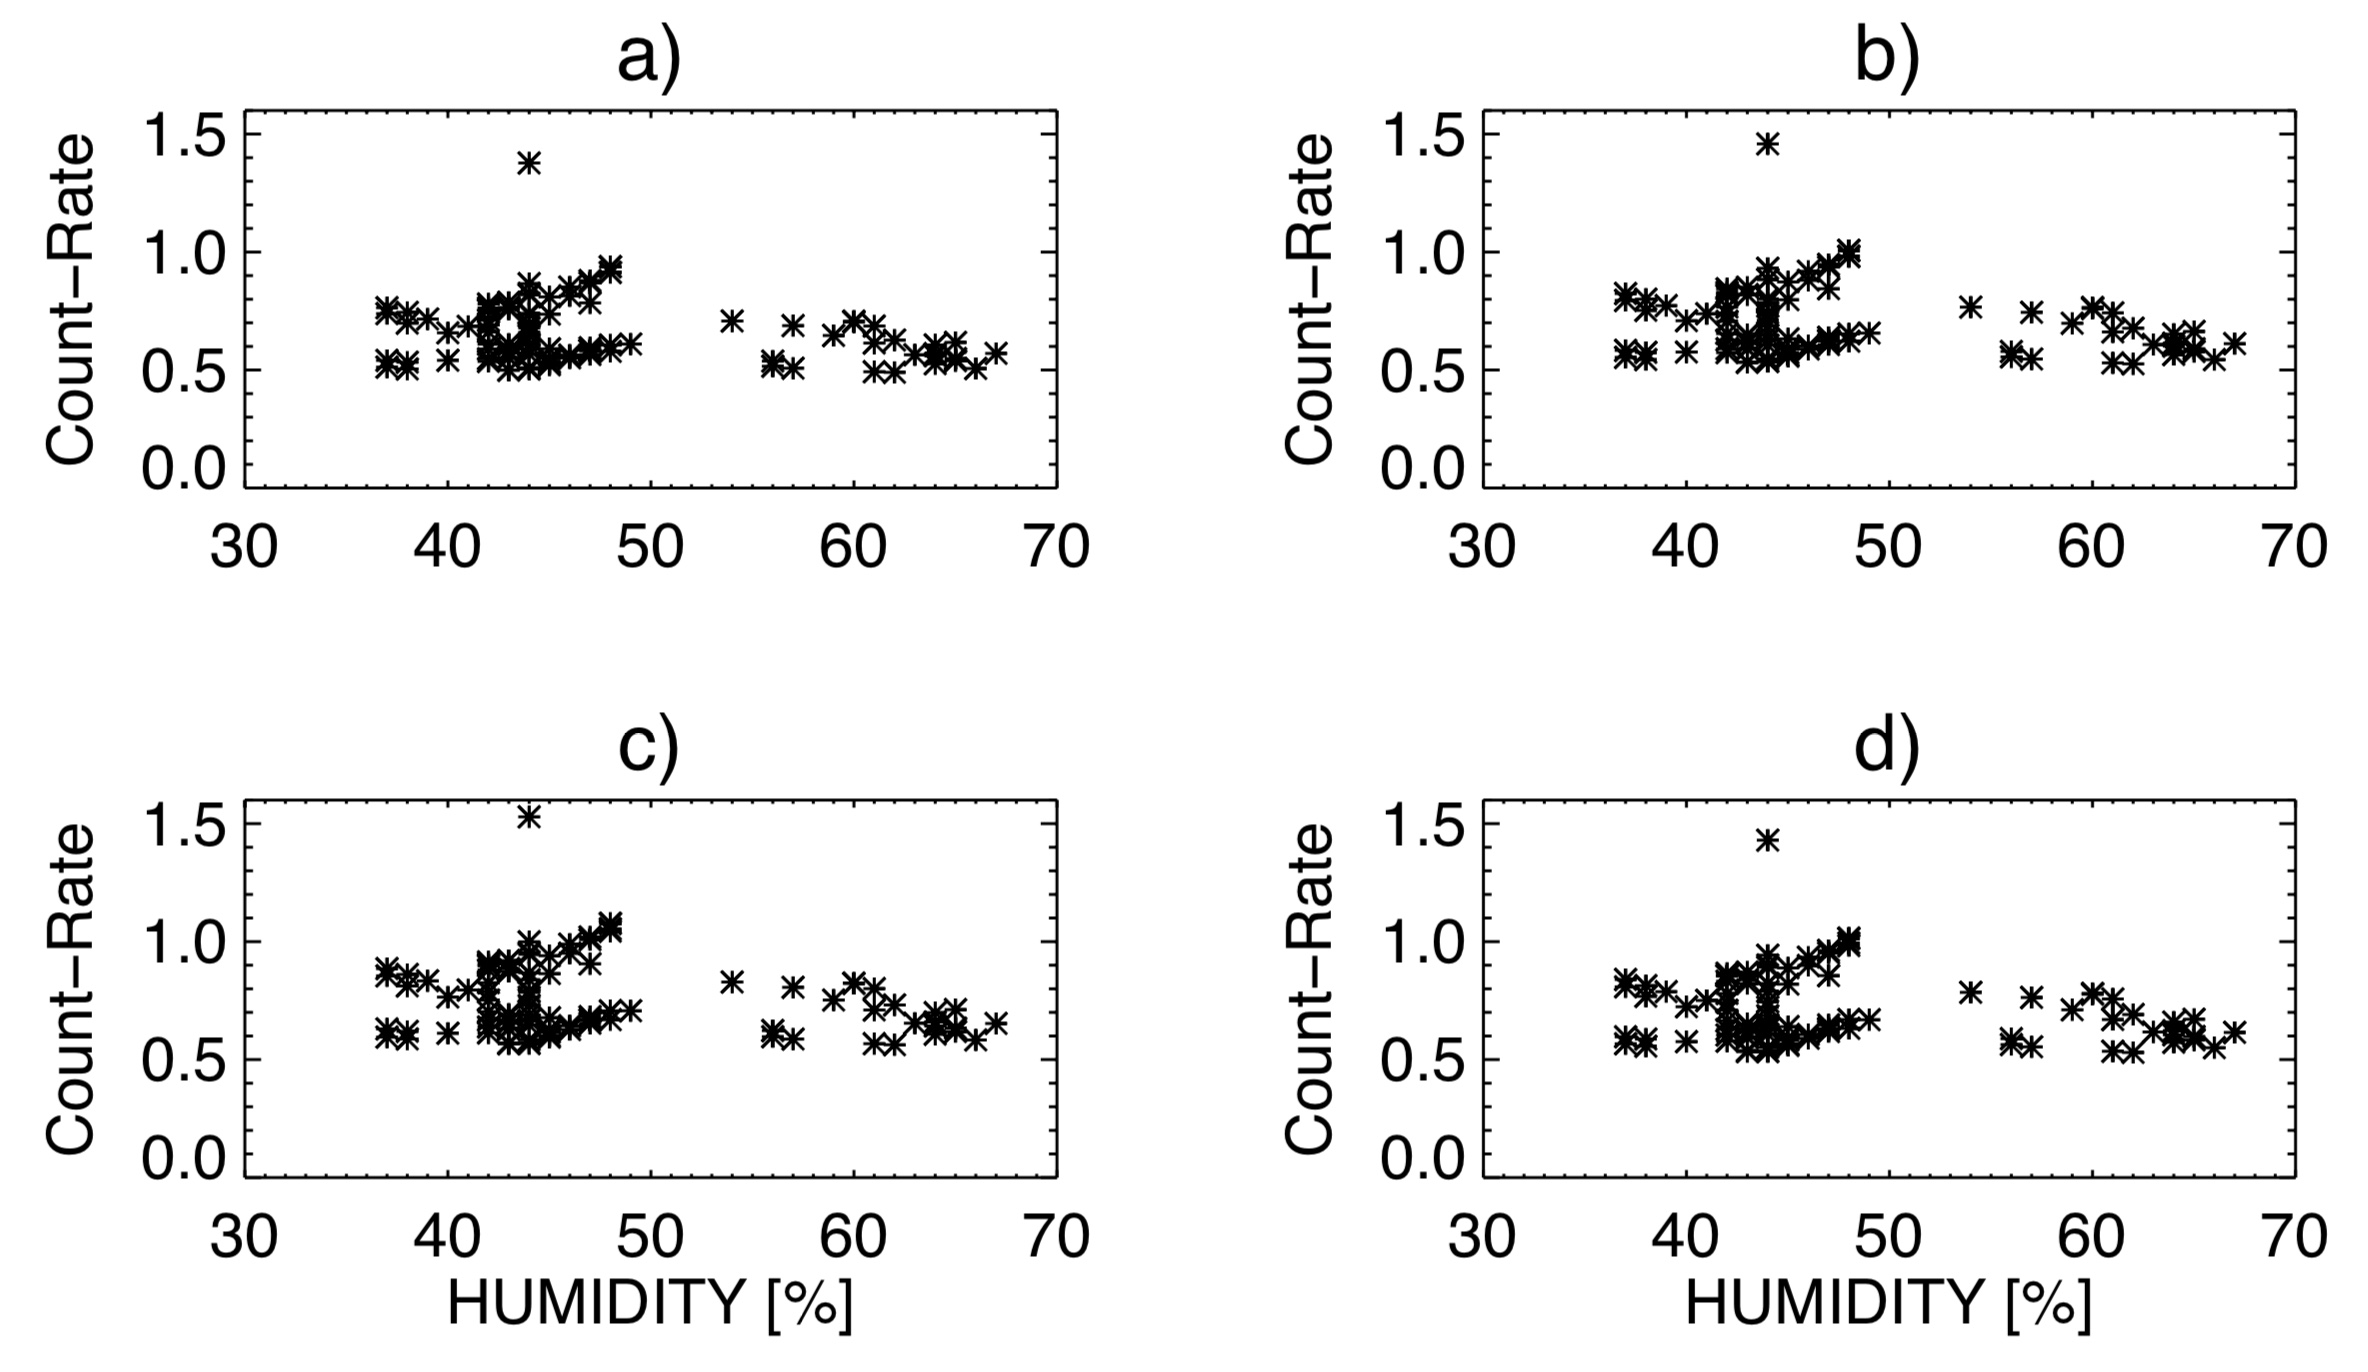
In Table 1 we list simulated count-rate ratios of the sky background between NB964, DECam z-band and DECam Y-band under different sky conditions. The sky background count-rate of NB964 , which is normalized by the value with airmass 1.0 and water vapor 2.3mm, appears to be weakly correlated both with the airmass and with the water vapor. However, we do not see clear correlation signals in the observed data either with the airmass (Fig. 9) or with the humidity ( Fig. 10).
| Water | Airmass | |||
|---|---|---|---|---|
| 2.3 mm | 1.0 | 1.000 | 0.0387 | 0.0617 |
| 2.3 mm | 1.5 | 1.086 | 0.0371 | 0.0511 |
| 2.3 mm | 2.0 | 1.171 | 0.0359 | 0.0446 |
| 10 mm | 1.0 | 0.870 | 0.0363 | 0.0560 |
| 10 mm | 1.5 | 0.913 | 0.0344 | 0.0451 |
| 10 mm | 2.0 | 0.955 | 0.0330 | 0.0383 |
4.3.2 Comparison of the On-sky Performance between NB964 and z-band
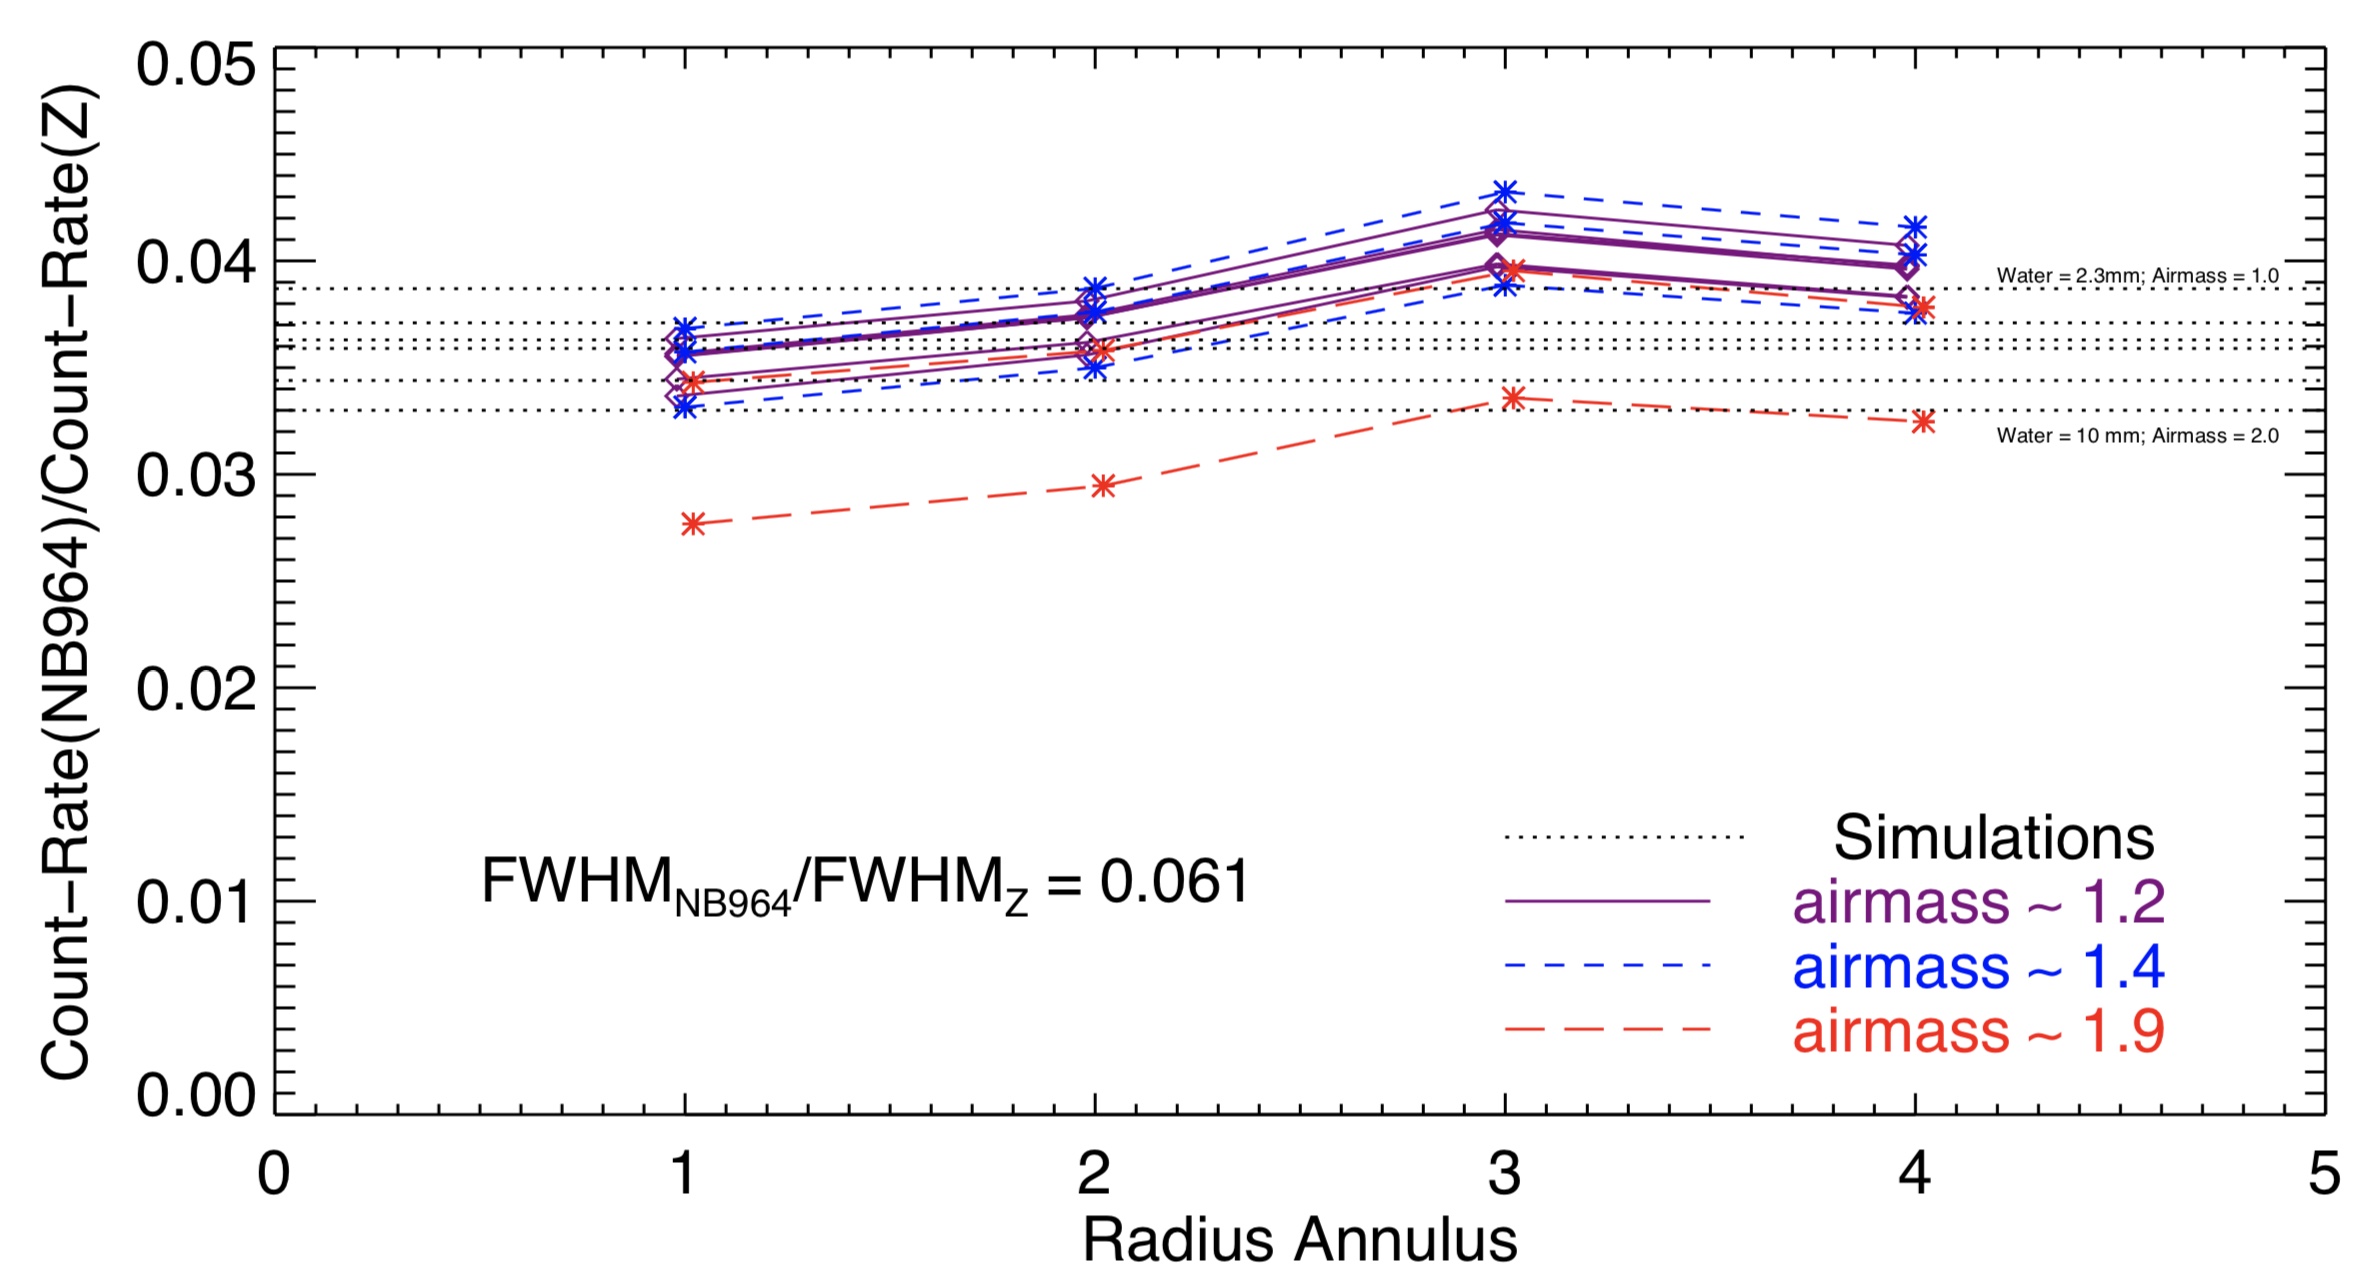
We choose 11 pairs of exposures when NB964 and z-band observations were taken consecutively, and plot the ratio of the sky count-rate in each pair in Fig. 11. While the ratio of the FWHM of NB964 to that of the z-band is 6.1%, the sky photons collected by the NB964 filter to that by the z-band filter is only %. It is in a good agreement with the designed values, which are listed in Table 1.
The variation on the ratio of the observed count-rate of NB964 to that of the z-band can be explained by the joint effect of water-vapor and airmass, as seen from Fig. 11 and Table 1. However, the scattered light from the moon and thin clouds would also affect the background radiation, either by increasing the background continuum or reducing the amount of OH emission to the telescope. Their effects need to be analyzed with good weather records at CTIO, which is difficult to get currently.
4.3.3 Filter Profile Explored with the Low-Redshift Spectroscopic Sample
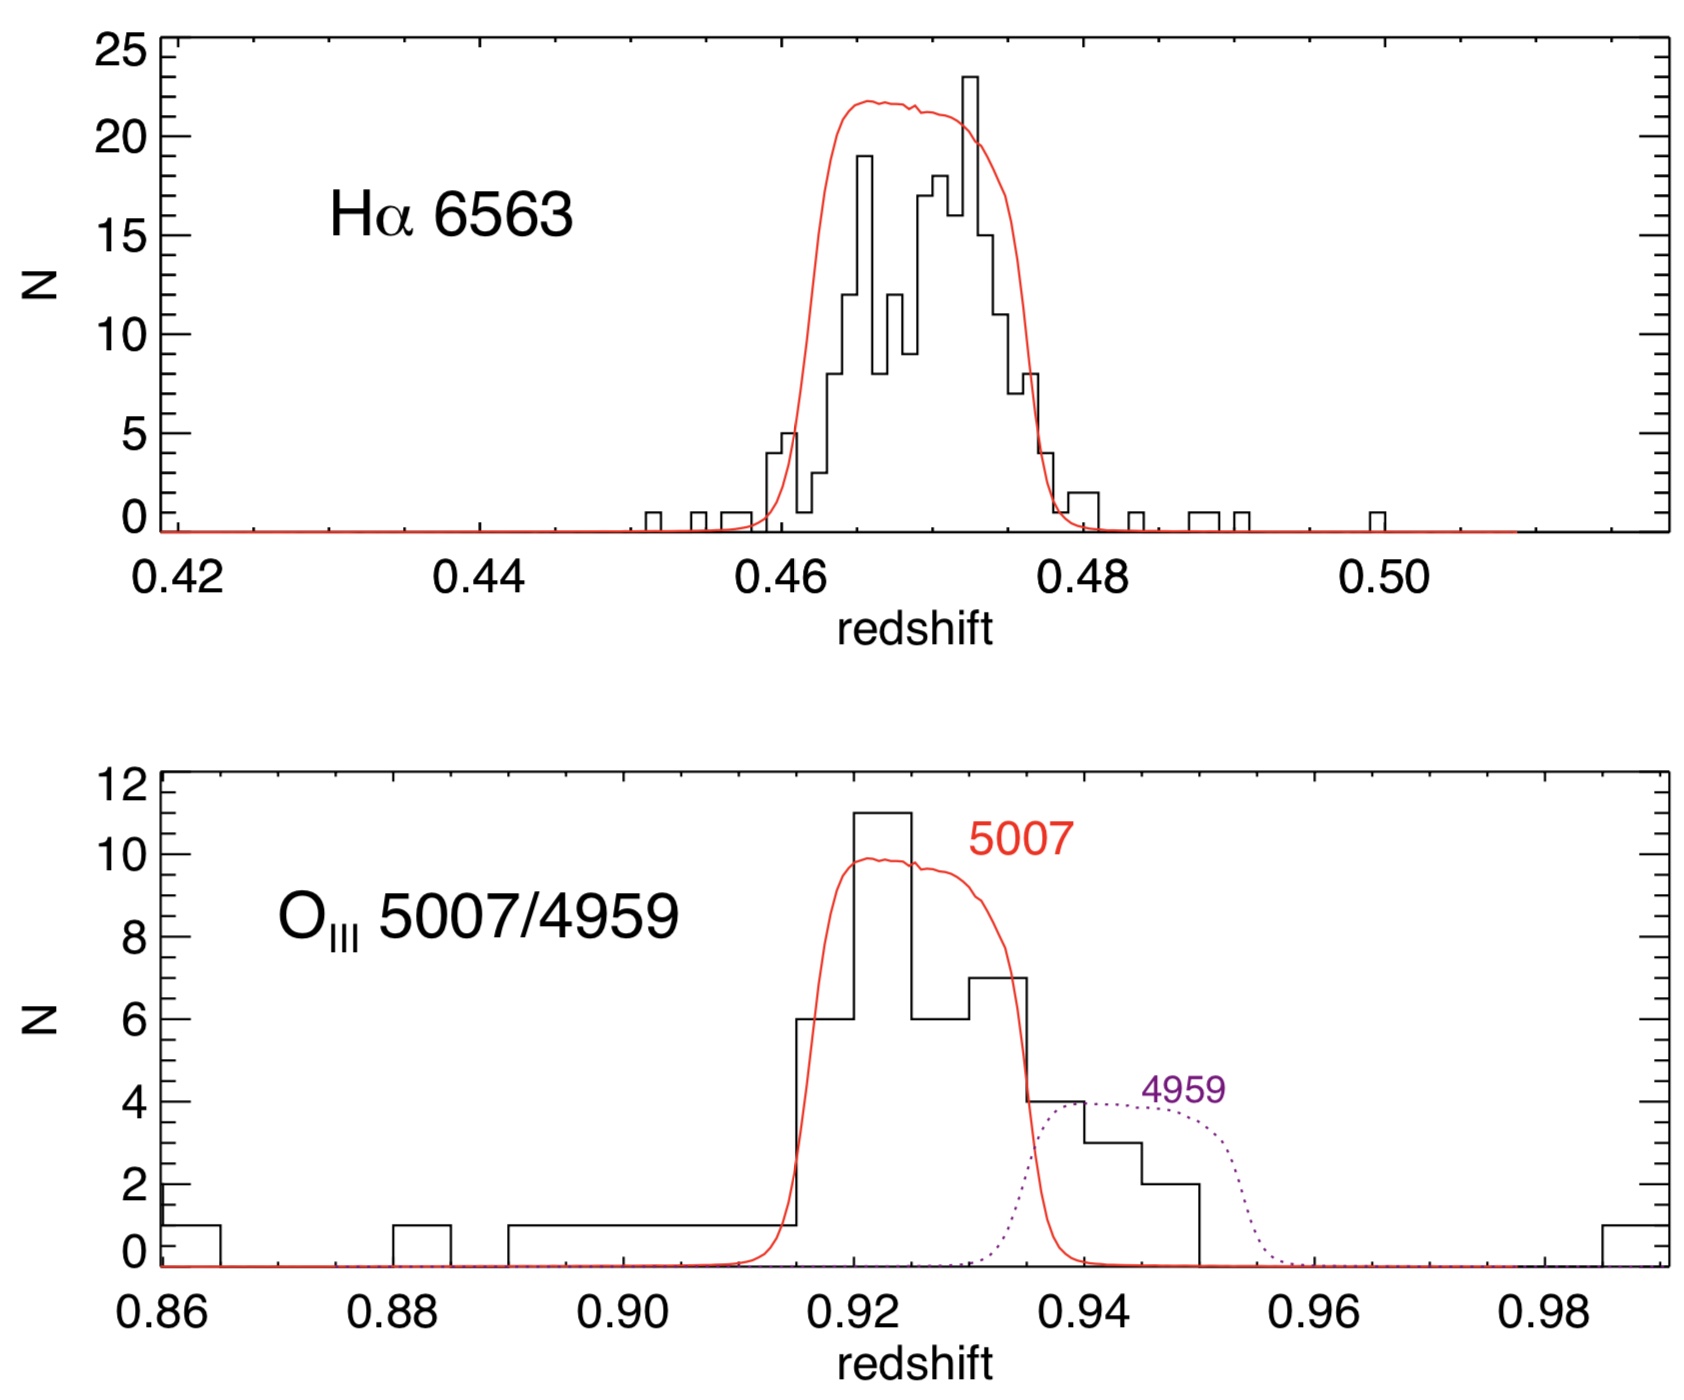
As an independent and first-order check, we explore the NB964 filter profile with the spectroscopic sample of NB964 selected low-redshift emission-line galaxies, such as H and [O iii] emitters. These spectroscopically confirmed low-redshift emission line galaxies are firstly selected with - NB964 0.3 & NB964 25, and then matched with the G10/COSMOS redshift catalogue (Davies et al., 2015; Andrews et al., 2017). About 210 H emitters and 40 [O iii] emitters selected from LAGER have matched counterparts with high resolution spectroscopic redshifts or reliable PRIMUS low resolution spectroscopic redshifts in the G10/COSMOS redshift catalogue.
In Fig. 12 we show the redshift distributions of LAGER H and [O iii] emitters, which match well with the scaled NB964 filter profiles. It is a nice consistency check on the filter profile. However, the size of the current spectroscopic sample is not large enough to give a more detailed information, e.g.,, the spatial variation of the filter profile. Future large spectroscopy surveys such as Subaru/PFS (Prime Focus Spectrograph, Sugai et al., 2012) and VLT/MOONS (Multi Object Optical and Near-infrared Spectrograph, Cirasuolo et al., 2014) will enlarge the spectroscopic sample, which could allow us to check the spatial variation of the filter profile.
4.4 Discussion on the Impact of the Filter Profile
As introduced in Section 2, the profile of the narrowband filter is crucial to the efficiency of the ground-based narrowband imaging survey for LAEs in the EoR. Compared with previous narrowband filters with a close central wavelength, NB964 filter has an excellent band shape more like a square ”boxcar” rather than a gaussian. Narrowband filters with the gaussian shape would systematically underestimate the Ly fluxes when the observed Ly wavelength is located in the filter wings. Although sometimes this effect can be statistically corrected for the sample as a whole, it is not the case for rare objects that only fall into the wing area. For example, the 3 most luminous LAEs in the COSMOS field reported by Zheng et al. (2017) with NB964 were also detected by Itoh et al. (2018) with their narrowband filter NB973 on Subaru/HSC, but the images are much fainter in NB973 than in NB964. Spectroscopic confirmations of these 3 LAEs (Hu et al., 2017) indicate that their Ly lines fall into the wings of NB973 which has a gaussian-like shape. Therefore, the actual Ly luminosity of the 3 bright LAEs can not be obtained from the NB973 image, if without the spectroscopic redshifts. In contrast, such rare objects would be more easily caught with the filter having a square boxcar-like shape. That’s why the bright-end excess of LAEs at 7 in the COSMOS field reported by Zheng et al. (2017) with NB964 was not revealed by Itoh et al. (2018) with NB973.
Another important issue on the filter profile is about the wavelength-shifts at different locations of the filter. If there exist wavelength shifts, nearby sky emission lines can be included so that the survey depth is dependent on the filter positions. In the inner regions of the filter, our tests in Section 4.2 confirm a consistent transmission profile when observing with DECam, while in the outer regions the transmission profiles shift by 0.7nm compared to that in the filter center. The area-weighted mean profile of NB964 shows a red-shift of 0.6 nm when compared to the profile in the center. This is similar to the HSC narrowband filters NB921, NB926, NB973 and NB1010, which have wavelength-shifts of about 1.0, 1.0, 1.5 and -0.3 respectively, when comparing the area-weighted mean profile with that in the filter center666https://www.subarutelescope.org/Observing/Instruments/HSC/sensitivity.html.
5 Conclusion
Large filters with strict uniformity are now technologically feasible. Here we explore in detail the design and tests of a narrow band filter NB964 that optimizes the survey efficiency for 7 Ly galaxies with DECam. To that end, we have taken into account the sky absorption and emission background, the DECam CCD QE, as well as the galaxy number density models. The optimized narrowband filter NB964 has a central wavelength of 964.2 nm and a width of 9.2 nm with f/2.9 and 0∘ AOI. The parameters of the filter have been tested by several methods, which match well with its design.
With the NB964 filter, a DECam narrowband imaging survey named LAGER (Lyman alpha galaxies in the epoch of reionization) has been ongoing. LAGER has helped to discover 22 new LAEs in 2017 (Zheng et al., 2017). A larger sample of 7 LAEs will be released soon (Hu et al., 2019). The excellent performances of the NB964 filter have guaranteed the high efficiency and reliability of LAGER in detecting galaxies in the epoch of reionization. These large numbers of newly detected LAEs are very helpful for us to reveal the nature of patchy reionization at 7.
Acknowledgments
We acknowledge financial support from National Science Foundation of China (grants No. 11421303) and National Program for Support of Top-notch Young Professionals for covering the cost of the NB964 narrowband filter. Z.Y.Z. is sponsored by Shanghai Pujiang Program, the National Science Foundation of China (11773051), and the China-Chile Joint Research Fund (CCJRF No. 1503). Work on this project by JER and SM has been supported in part by grant AST-1518057 from the United States National Science Foundation. J.X.W. thanks support from National Basic Research Program of China (973 program, grant No. 2015CB857005), National Science Foundation of China (NSFC 11890693), and CAS Frontier Science Key Research Program QYCDJ-SSW-SLH006. F. B. thanks support from CONICYT Project BASAL AFB-170002.
We thank Materion company for the manufacture of the NB964 filter, which makes the LAGER project possible. We greatly appreciate the kind support from staffs at NOAO/CTIO to make our observations successful.
Based on observations at Cerro Tololo Inter-American Observatory, National Optical Astronomy Observatory (NOAO PID: 016A-0386, PI: Malhotra, and CNTAC PIDs: 2015B-0603 and 2016A-0610, PI: Infante), which is operated by the Association of Universities for Research in Astronomy (AURA) under a cooperative agreement with the National Science Foundation. Based in part on data collected at the Subaru Telescope and obtained from the Subaru-Mitaka-Okayama-Kiso Archive System (SMOKA), which is operated by the Astronomy Data Center, National Astronomical Observatory of Japan.
This project used data obtained with the Dark Energy Camera (DECam), which was constructed by the Dark Energy Survey (DES) collaboration. Funding for the DES Projects has been provided by the DOE and NSF (USA), MISE (Spain), STFC (UK), HEFCE (UK). NCSA (UIUC), KICP (U. Chicago), CCAPP (Ohio State), MIFPA (Texas A&M), CNPQ, FAPERJ, FINEP (Brazil), MINECO (Spain), DFG (Germany) and the collaborating institutions in the Dark Energy Survey, which are Argonne Lab, UC Santa Cruz, University of Cambridge, CIEMAT-Madrid, University of Chicago, University College London, DES-Brazil Consortium, University of Edinburgh, ETH Zurich, Fermilab, University of Illinois, ICE (IEEC-CSIC), IFAE Barcelona, Lawrence Berkeley Lab, LMU Munchen and the associated Excellence Cluster Universe, University of Michigan, NOAO, University of Nottingham, Ohio State University, University of Pennsylvania, University of Portsmouth, SLAC National Lab, Stanford University, University of Sussex, and Texas A&M University.
The G10/COSMOS redshift catalogue, photometric catalogue and cutout tool uses data acquired as part of the Cosmic Evolution Survey (COSMOS) project and spectra from observations made with ESO Telescopes at the La Silla or Paranal Observatories under programme ID 175.A-0839. The G10 cutout tool is hosted and maintained by funding from the International Centre for Radio Astronomy Research (ICRAR) at the University of Western Australia. Full details of the data, observation and catalogues can be found in Davies et al. (2015) and Andrews et al. (2017), or on the G10/COSMOS website: cutout.icrar.org/G10/dataRelease.php
Facilities: (DECam)
References
- Andrews et al. (2017) Andrews, S. K.; Driver, S. P.; Davies, L. J. M., et al. 2017, MNRAS, 464, 1569
- Cai et al. (2017) Cai, Z., Fan, X., Bian, F., et al. 2017, ApJ, 839, 131
- Cirasuolo et al. (2014) Cirasuolo, M., Afonso, J., Carollo, M., et al. 2014, Proc. SPIE 9147, Ground-based and Airborne Instrumentation for Astronomy V, 91470N
- Cowie & Hu (1998) Cowie, L.L., & Hu, E.M. 1998, AJ, 115, 1319
- Cuby et al. (2007) Cuby, J.-G., Hibon, P., Lidman, C., et al. 2007, A&A, 461, 911
- Davies et al. (2015) Davies, L. J. M.; Driver, S. P.; Robotham, A. S. G, et al. 2015, MNRAS, 447, 1014D
- Doel et al. (2008) Doel, P., et al. 2008, SPIE, 7014, 70141V-1
- Dressler et al. (2015) Dressler, A., Henry, A., Martin, C. L., et al. 2015, ApJ, 806, 19
- Finkelstein et al. (2008) Finkelstein S. L., Rhoads J. E., Malhotra S., Grogin N., Wang J., 2008, ApJ, 678, 655
- Finkelstein et al. (2009) Finkelstein, S. L., Rhoads, J. E., Malhotra, S., & Grogin, N. 2009, ApJ, 691, 465
- Flaugher et al. (2015) Flaugher, et al. 2015, AJ, 150, 150F
- Gawiser et al. (2007) Gawiser, E., Francke, H., Lai, K., et al. 2007, ApJ, 671, 278
- Gronwall et al. (2007) Gronwall C. et al., 2007, ApJ, 667, 79
- Guaita et al. (2010) Guaita, L., Gawiser, E., Padilla, N., et al. 2010, ApJ, 714, 255
- Hibon et al. (2010) Hibon, P., Cuby, J.-G., Willis, J., et al. 2010, A&A, 515, 97
- Hibon et al. (2011) Hibon, P., Malhotra, S., Rhoads, J., Willott, C. 2011, ApJ, 741, 101
- Hibon et al. (2012) Hibon, P., Kashikawa, N., Willott, C., et al. 2012, ApJ, 744, 89
- Hu et al. (1998) Hu, E. M., Cowie, L. L., & McMahon, R. G. 1998, ApJ, 502, L99
- Hu et al. (2010) Hu, E. M., Cowie, L. L., Barger, A. J., et al. 2010, ApJ, 725, 394
- Hu et al. (2017) Hu, W.D., Wang, J., Zheng, Z.-Y., et al. 2017, ApJL, 845, 16
- Hu et al. (2019) Hu, W.D., Wang, J., Zheng, Z.-Y., et al. 2019, submitted to ApJ
- Iye et al. (2006) Iye, M., Ota, K., Kashikawa, N., et al. 2006, Nature, 443, 186
- Itoh et al. (2018) Itoh, R., Ouchi, M., Zhang, H., et al. 2018, ApJ, 867, 461
- Jiang et al. (2017) Jiang, L., Shen, Y., Bian, F., et al. 2017, ApJ, 846, 134
- Jiang et al. (2018) Jiang, L., Wu, J., Bian, F., et al. 2018, Nature Astronomy, 2, 962
- Kashikawa et al. (2011) Kashikawa, N., Shimasaku, K., Matsuda, Y., et al. 2011, ApJ, 734, 119
- Konno et al. (2014) Konno, A., Ouchi, M., Ono, Y., et al. 2014, ApJ, 797, 16
- Krug et al. (2012) Krug, H.B., Veileux, S., Tilvi, V., et al. 2012, ApJ, 745, 122
- Malhotra & Rhoads (2004) Malhotra, S. & Rhoads, J. 2004, ApJ, 617, 5
- Marshall et al. (2013) Marshall, J.L., Rheault, J.P., DePoy, D.L., et al. 2013, arXiv:1302.5720
- Miyazaki et al. (2012) Miyazaki, S., Komiyama, Y., Nakaya, H., et al. 2012, SPIE, 8446, 84460Z
- Mooney et al. (2014) Mooney, T., Pawlewicz, W., Merrill, M., Leclerc, D., & Hurd, K. 2014, SPIE, 9151, 91515L
- Nilsson et al. (2009) Nilsson, K. K., Moller-Nilsson, O., Moller, P., Fynbo, J. P. U., & Shapley, A. E. 2009, MNRAS, 400, 232
- Ota et al. (2008) Ota, K., Iye, M., Kashikawa, N., et al. 2008, ApJ, 677, 12-26
- Ota et al. (2010) Ota, K., Iye, M., Kashikawa, N., et al. 2010, ApJ, 722, 803
- Ouchi et al. (2008) Ouchi, M., Shimasaku, K., Akiyama, M., et al. 2008, ApJS, 176, 301
- Ouchi et al. (2010) Ouchi, M., Shimasaku, K., Furusawa, H., et al. 2010, ApJ, 723, 869
- Ouchi et al. (2018) Ouchi, M., Harikane, Y., Shibuya, T., et al. 2018, PASJ, 70S, 13
- Rhoads et al. (2000) Rhoads, J. E., Malhotra, S., Dey, A., Stern, D., Spinrad, H., & Jannuzi, B. T. 2000, ApJ, 545, L85
- Rhoads et al. (2012) Rhoads, J. E., Hibon, P., Malhotra, S., et al. 2012, ApJ, 752, L28
- Shibuya et al. (2012) Shibuya, T., Kashikawa, N., Ota, K., et al. 2012, ApJ, 752, 114
- Steidel et al. (2000) Steidel, C. C., Adelberger, K. L., Shapley, A. E., et al. 2000, ApJ, 532, 170
- Tilvi et al. (2010) Tilvi, V., Rhoads, J.E., Hibon, P., et al. 2010, ApJ, 721, 1853
- Valdes et al. (2014) Valdes, F., Gruendl, R., & DES Project. 2014, in Astronomical Society of the Pacific Conference Series, Vol. 485, Astronomical Data Analysis Software and Systems XXIII, ed. N. Manset & P. Forshay, 379
- Sugai et al. (2012) Sugai, H., Karoji, H., Takato, N., et al. 2012, Ground-based and Airborne Instrumentation for Astronomy IV, Ian S. McLean, Suzanne K. Ramsay, Hideki Takami, Editors, Proc. SPIE, 8446
- Willis & Courbin (2005) Willis, J. P. & Courbin, F. 2005, MNRAS, 357, 1348
- Zheng et al. (2016) Zheng, Z.-Y., Malhotra, S., Rhoads, J. E., et al. 2016, ApJS, 226, 23
- Zheng et al. (2017) Zheng, Z.-Y., Wang, J., Rhoads, J. E., et al. 2017, ApJL, 842, 22