figurec
Forecasting the Progression of Alzheimer’s Disease Using Neural Networks and a Novel Pre-Processing Algorithm
Abstract
Alzheimer’s disease (AD) is the most common neurodegenerative disease in older people. Despite considerable efforts to find a cure for AD, there is a 99.6% failure rate of clinical trials for AD drugs, likely because AD patients cannot easily be identified at early stages. This project investigated machine learning approaches to predict the clinical state of patients in future years to benefit AD research. Clinical data from 1737 patients was obtained from the Alzheimer’s Disease Neuroimaging Initiative (ADNI) database and was processed using the “All-Pairs” technique, a novel methodology created for this project involving the comparison of all possible pairs of temporal data points for each patient. This data was then used to train various machine learning models. Models were evaluated using 7-fold cross-validation on the training dataset and confirmed using data from a separate testing dataset (110 patients). A neural network model was effective (mAUC = 0.866) at predicting the progression of AD on a month-by-month basis, both in patients who were initially cognitively normal and in patients suffering from mild cognitive impairment. Such a model could be used to identify patients at early stages of AD and who are therefore good candidates for clinical trials for AD therapeutics.
1 Introduction
Alzheimer’s disease (AD) is the most common neuro-degenerative disease in older people. [1, 2] AD takes a significant toll on patients’ daily lives, causing a progressive decline in their cognitive abilities, including memory, language, behavior, and problem solving. [3, 4, 5, 6] Changes to AD patients’ cognitive abilities often start slowly and become more rapid over time. [7, 8] Doctors and other caregivers monitor the progression of AD in patients by evaluating the degree of decline in the patients’ cognitive abilities [9], which are often divided into 3 general categories: cognitively normal (NL), mild cognitive impairment (MCI), and dementia. [5, 10] Patients with MCI and dementia both suffer from reduced cognitive abilities, but MCI has a less severe effect on everyday activities, and patients suffering from dementia often have additional symptoms such as trouble with reasoning or impaired judgment. [11, 12]
Unfortunately, there is no cure for AD at this time, and progress on identifying a cure has been slow. [10] None of the five medications currently approved by the FDA to treat AD have been shown to delay or halt its progression. [9] Instead, they only temporarily improve patients’ symptoms. [9, 13, 14] And, the most recently approved medication is just the combination of two existing drugs for treating AD, donepezil and memantine, which were approved by the FDA 23 and 16 years ago, respectively. [14] Despite considerable efforts to find a cure for AD, there is a 99.6% failure rate of clinical trials for AD drugs. [13, 15] In early 2018 alone, two groups ended their AD clinical trials because their drugs failed to prevent the progression of AD. [16, 17] The difficulty in finding treatments for AD is most likely a combination of uncertainty over the cause of AD and the fact that AD patients cannot easily be identified at early stages. [10, 13, 18] Even the FDA recognizes the importance of identifying patients who are at risk of developing AD but who don’t have any noticeable cognitive impairment. [19] For this reason, AD research would benefit from the ability to use current medical data to predict the mental state of patients in future years in order to identify patients who are good candidates for clinical trials before they become symptomatic. [2, 10, 13, 20, 21]
Several different types of data have been identified that are relevant to assessing the mental state of AD patients and the progression of AD in general. One of the largest genetic risk factors for AD is the presence of 1 or 2 copies of the 4 allele of the APOE gene, which encodes a particular variant of the enzyme Apolipoprotein E. [5] Physical changes to the brain have also been shown to be correlated with the progression of AD. For example, a decline in neurogenesis in the hippocampus is one of the earliest changes to brain physiology seen in AD patients and is thought to underlie cognitive impairments associated with AD. [6] The progression of AD also accelerates the normal atrophy of brain tissue caused by aging, as evidenced by increased enlargement of the ventricles of the brain over time. [22] One study demonstrated a 4-fold difference in the rate of ventricle enlargement in AD patients and normal controls over a six-month interval. [22] Cognitive tests have also been widely used for early detection of AD. [8] Several commonly used tests, such as ADAS11 and ADAS13, are based on the Alzheimer’s Disease Assessment Scale (ADAS), which is a brief cognitive test battery that assesses learning and memory, language production, language comprehension, constructional praxis, ideational praxis, and orientation. [23, 24] ADAS11 scores range from 0 to 70, and ADAS13 scores range from 0 to 85, with higher scores indicating more advanced stages of AD. [24] Similar cognitive tests, such as the Mini-Mental State Examination (MMSE), the Rey Auditory Verbal Learning Test (RAVLT), and the Functional Activities Questionnaire (FAQ) have also been used to assess the progression of AD in individual patients. [25, 26] ADAS has been found to be more precise than the MMSE [27], and the RAVLT only addresses verbal recall [28], thus providing less diagnostic information than either of the other two. Similarly, the FAQ only assesses a patients’ ability to perform certain tasks [29] and therefore is more limited in scope than the MMSE and ADAS.
In recent years, machine learning techniques have been applied to the diagnosis of AD patients with great success. For example, Esmaeilzadeh et al. achieved an accuracy of 94.1% using 3D convolutional neural networks to diagnose AD on a dataset with 841 patients. [30] Similar results were obtained by Long et al., who used a support vector machine to diagnose AD based on an MRI scan dataset (n = 427 patients; mean best accuracy = 96.5%) [31] and Zhang et al., who used MRI scans, FDG-PET scans, and CSF biomarkers to diagnose AD (n = 202 patients; AD vs. NL accuracy = 93.2%, MCI vs. NL accuracy = 76.4%). [32] However, the focus of these earlier studies was to use current medical data to diagnose a patient’s present cognitive state, in effect demonstrating that a computer can replicate a doctor’s clinical decision-making. What is needed is a way to use machine learning to predict future diagnoses of AD patients. [10]
2 Methods
2.1 ADNI Data
Data used in the preparation of this article were obtained from the Alzheimer’s Disease Neuroimaging Initiative (ADNI) database (adni.loni.usc.edu). The ADNI was launched in 2003 as a public-private partnership, led by Principal Investigator Michael W. Weiner, MD. The primary goal of ADNI has been to test whether serial magnetic resonance imaging (MRI), positron emission tomography (PET), other biological markers, and clinical and neuropsychological assessment can be combined to measure the progression of mild cognitive impairment (MCI) and early Alzheimer’s disease (AD).
The ADNI study has been divided into several phases, including ADNI-1, ADNI-GO, and ADNI-2, which started in 2004, 2009, and 2011, respectively. ADNI-1 studied 800 patients, and each subsequent phase included a mixture of new patients and patients from the prior phase who elected to continue to participate in the study. The ADNI patient data was pre-processed to flag missing entries and to convert nonnumeric categories (such as race) into numeric data. Data was sorted into three datasets (LB1, LB2, and LB4) based on criteria established by The Alzheimer’s Disease Prediction Of Longitudinal Evolution (TADPOLE) Challenge (https://tadpole.grand-challenge.org/). [10] The LB2 and LB4 datasets consist of data from 110 patients who participated in ADNI-1, continued to participate in ADNI-GO/ADNI-2, and who were not diagnosed with AD as of the last ADNI-1 time point. Specifically, LB2 contains all observations of these patients from ADNI-1, and LB4 contains all observations of these patients from ADNI-GO/ADNI-2. The LB1 dataset consists of ADNI data for all remaining patients (n = 1737). Generally speaking, LB1 was used as a training and validation dataset, while LB2 and LB4 were later used to test the ability of machine learning models to predict the progression of AD on an independent patient population.
2.2 All-Pairs Technique
Data from LB1 was then further processed using a novel methodology developed for this project called the All-Pairs technique, which can be summarized as follows: Let be the number of patients in the dataset and be the number of biomarkers (or other clinical data) being evaluated as features. For each patient (), the ADNI database includes separate examinations by a physician. Then, , the th examination of the th patient, can be defined as a multidimensional vector as follows:
where is the date of the examination, () are different biomarkers (or other clinical data), and is the clinical state of the patient (normal, MCI, or dementia) as measured during that examination. The All-Pairs technique transforms this examination data to generate a feature array and target array that are used to train the machine learning models. Specifically, for every , where and , a row of and a corresponding cell of are calculated:
This approach can be extended from pairs of examinations () to triplets () as follows:
Individual rows and cells are then assembled to create the and arrays that are used for training of the machine learning model as well as cross-validation studies.
| Category | Feature Name | Description |
| Genetic | APOE4 | The APOE4 biomarker measures the number of copies (0, 1, or 2) of the 4 allele of the gene encoding the enzyme Apolipoprotein E. This allele is the strongest genetic risk factor for AD. [5] |
| Hippocampus | ||
| Physical | Ventricles/ICV | Physical measurements, like the volume of the hippocampus [6] and the ventricles [22], can be used to assess the effect AD has on the brain. |
| ADAS11 | ||
| ADAS13 | ||
| FAQ | ||
| MMSE | ||
| Behavioral | RAVLT (4 types) | Cognitive tests have been widely applied for early detection of AD. [33] |
| Race | ||
| Demographic | Age | Demographic data can be used to account for general trends in a population. |
2.3 Evaluation using LB2 and LB4 Datasets
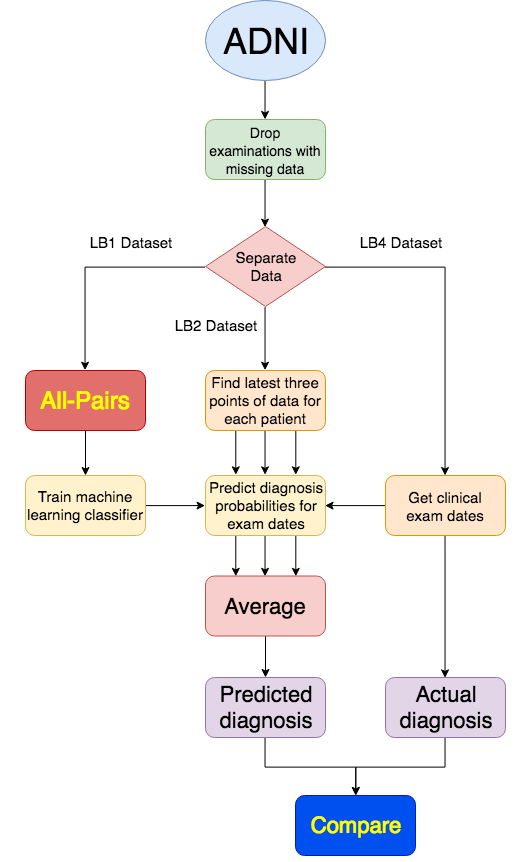
In the case of LB2, each examination can be characterized by the same vector as used for the LB1 dataset. However, because the LB2 data is only used to test the machine learning models and not for training, no comparison between examinations is performed. Instead, is transformed into the input vector by replacing the term with a time variable that represents the number of months into the future that the machine learning model should make a prediction. Specifically, for each patient in LB2, the machine learning algorithm is applied to a series of input vectors of the form:
where is the time variable. Input vectors are generated based on each patient’s last three examinations in LB2, or for all of the examinations if the patient has less than three. The probabilities calculated by the machine learning algorithm based on these examinations are averaged to generate predicted probabilities for patient at time t. When comparing the model’s predictions against the actual diagnoses in LB4, is set to the time difference between the applicable exam in LB2 and the applicable exam in LB4. For the time courses shown in Figures 6 and 7, is set to an integer between 1 and 84, inclusive.
2.4 Features
The features analyzed by the machine learning models consisted of 13 biomarkers or other types of clinical data present in the ADNI dataset, all of which have been cited in published papers as correlating with AD progression. These 13 features are summarized in Table 1 and include genetic biomarkers (APOE4), physical biomarkers (ventricular volume/ICV ratio, hippocampal volume), the results of behavioral tests (ADAS13 and ADAS11 scores, FAQ score, MMSE score, and 4 types of RAVLT scores), and basic demographic information (age and race). As described above, two additional features that were generated during pre-processing of the data using the All-Pairs technique were also included in the models, namely, the clinical diagnosis at the earlier of two examinations and the time difference between examinations.
3 Results
3.1 Model Performance
A flowchart summarizing the overall methodology for training and evaluating machine learning models is shown in Figure 1.
Various machine-learning classifiers, including support vector machines, logistic regression, gradient boosting classifiers, random forests, multilayer perceptron neural networks, and recurrent neural networks, were implemented using the Python libraries Scikit-learn and Keras (backed by TensorFlow). Each classifier was then evaluated on the processed data derived from LB1 using 7-fold cross-validation.
| Variable | Meaning | 8-feature training group | 11-feature training group | 15-feature training group |
|---|---|---|---|---|
| DX | Earlier Diagnosis | X | X | X |
| ADAS13 | 13-item Alzheimer’s Disease Assessment Scale | X | X | X |
| Ventricles | Ventricular Volume | X | X | X |
| AGE | Age | X | X | X |
| FAQ | Functional Activities Questionnaire | X | X | |
| PTRACCAT | Race | X | X | X |
| Hippocampus | Hippocampal Volume | X | X | X |
| APOE4 | # of APOE4 Alleles | X | X | X |
| MMSE | Mini-mental state examination | X | X | |
| ADAS11 | 11-item Alzheimer’s Disease Assessment Scale | X | X | |
| RAVLT_immediate | Rey Auditory Verbal Learning Test — Total number of words memorized over 5 trials | X | ||
| RAVLT_learning | Rey Auditory Verbal Learning Test — Number of words learned between trial 1 and trial 5 | X | ||
| RAVLT_forgetting | Rey Auditory Verbal Learning Test — Number of words forgotten between trial 5 and trial 6 | X | ||
| RAVLT_perc_forgetting | Rey Auditory Verbal Learning Test — Percentage of words forgotten between trial 5 and trial 6 | X | ||
| N/A | Time Difference | X | X | X |
![[Uncaptioned image]](/html/1903.07510/assets/media/image2.png)
The effectiveness of each classifier was measured using a specialized version of an ROC-AUC (Receiver Operating Characteristic Area Under the Curve) score for multiclass classification (“mAUC score”), as previously described by Hand and Till. [34] The ROC-AUC score is a balanced metric for classifiers that considers both the true positive rate (percentage of actual positives that are called correctly) and the false positive rate (percentage of actual negatives that are called incorrectly). The mAUC variant of this score takes all ordered pairs of categories , measures the probability that a randomly selected element from category would have a higher estimated chance of being classified as category than a randomly selected element from category , and averages all of these probabilities. A classifier that works perfectly would have an mAUC score of 1; a classifier that guessed randomly would result in an mAUC score of 0.5.
In the end, two classifiers, a multilayer perceptron implemented in Scikit-learn (“MLP”) and a recurrent neural network implemented in Keras (“RNN”) were found to have the best performance in the cross-validation studies. Both of these classifiers are types of neural networks. An MLP consists of a layer of input nodes, a layer of output nodes, and one or more hidden layers between the input and output layers. Each input vector is fed into the input nodes, and the value of each node in every other layer is dependent on the values of the nodes in the previous layer. Like an MLP, an RNN consists of multiple nodes organized into layers, but the outputs of some of the hidden layers are fed back into the same layer so that earlier input vectors can influence the outputs for later input vectors. This allows the RNN to “remember” earlier inputs, which has been shown to be particularly useful when analyzing data consisting of multiple observations taken at different time points. [35, 36]
To further investigate the MLP and the RNN and see if the performance of the MLP and RNN could be further improved by optimizing the training protocol, six variants of each of the neural networks were generated to examine the effects of changing the number of features being examined (8, 11, and 15) and whether the All-Pairs technique was applied to pairs of patients’ doctors’ visits or triplets of visits. Table 2 details which features were included in the 8, 11, and 15-feature training groups. The columns in Table 2 labelled “Variable” and “Meaning” provide the name of each feature as it appears in the ADNI dataset as well as the corresponding description for each feature, respectively.
Table 3 shows the resulting mAUC scores after training and testing the 12 models on LB1-derived data using 7-fold cross-validation, as well as the standard deviations for the testing mAUC scores. The best performing model was the MLP trained on 8 features and triplets of time points, as it had the highest testing mAUC score. This model is highlighted in blue in Table 3. However, the differences among all of these models are quite small and in many cases well within 1 standard deviation (s.d.), suggesting that some of the variability between the scores might be due to random chance rather than actual differences in predictive performance. Additionally, because the training and testing of neural networks, as well as the cross-validation process, relies to some extent on algorithms that utilize random numbers, the scores in the table will change slightly each time that the models are subjected to cross-validation.
| Model | Train mAUC | Test mAUC | Test S.D. |
|---|---|---|---|
| 8 Features, RNN, pairs | |||
| 11 Features, RNN, pairs | |||
| 15 Features, RNN, pairs | |||
| 8 Features, MLP, pairs | |||
| 11 Features, MLP, pairs | |||
| 15 Features, MLP, pairs | |||
| 8 Features, RNN, triplets | |||
| 11 Features, RNN, triplets | |||
| 15 Features, RNN, triplets | |||
| 8 Features, MLP, triplets | |||
| 11 Features, MLP, triplets | |||
| 15 Features, MLP, triplets |
In order to assess the performance of these models in a more rigorous manner, each of the 12 models was also evaluated on a series of random splits of the preprocessed LB1 dataset. For each model, the preprocessed LB1 dataset was randomly separated into a training dataset and testing dataset using a 70:30 ratio, and this was repeated to create 100 pairs of training and testing datasets that were then used to train and test the model. The use of a large number of randomly generated splits produces a distribution of mAUC scores that better reflects the overall performance of the model and minimizes the effects of outliers. The results are shown as box-and-whisker plots in Figure 2. Using this more rigorous approach, the model with the highest average mAUC score was an MLP trained on data with 15 features and with triplets of patients’ examinations, which had an average mAUC score of 0.967 and a standard deviation of 0.0016. This model is highlighted in blue in Figure 2.
3.2 Prediction of Alzheimer’s Disease Progression
In order to assess real-world performance, select models were also trained on the entire LB1 dataset (after processing with the All-Pairs technique) and then evaluated on data derived from LB2 and compared to actual diagnoses in LB4, asking whether early biomarkers and other early clinical data for the 110 patients in LB2 can predict their later diagnoses. The actual examination dates in LB4 vary from patient to patient, but they generally cover the 7-year period of ADNI-GO/ADNI-2. LB4 contains a total of 417 examinations, or an average of 3.79 examinations per patient. As in the cross-validation studies, the performance of each model was assessed based on mAUC scores. Out of the 12 previously discussed models, the 4 models that used 15 features were selected for testing against LB2/LB4, namely:
1. MLP trained using pairs of examinations,
2. MLP trained using triplets of examinations,
3. RNN trained using pairs of examinations, and
4. RNN trained using triplets of examinations.
Hyper-parameter optimization was conducted for each of these models, and each model was tested 5 times for each set of parameters to minimize the impact of random variation inherent in the neural network training process. In total, 27 different sets of parameters were tested for each model, consisting of 3 possible values for the alpha parameter, 3 possible values for the learning rate, and 3 possible values for the size of the hidden layers. Figure 3 shows the results from the highest performing version of each of the 4 models listed above.

The model and parameters with the best average mAUC score was the MLP trained on 15 features using pairs of examinations, which achieved an average score of 0.866 on the 110-patient test dataset. This model is shown with a blue box in Figure 3. This result represents an improvement over previously published work using the ADNI dataset. In particular, Moore et al. [8] achieved an mAUC score of 0.82 with a random forest classifier; Ghazi et al. [35] achieved an mAUC score of 0.7596 with an RNN; and Nguyen et al. [36] achieved an average mAUC score of 0.86 with an RNN together with forward-filling data imputation.
Figure 4 depicts a confusion matrix for this best performing model, which provides a visual indication of how well the diagnoses predicted by the model line up with the actual diagnoses. The confusion matrix reveals two types of mistakes occasionally made by the machine learning model: predicting a cognitively normal diagnosis when a patient is actually diagnosed with MCI and predicting an MCI diagnosis when a patient is actually diagnosed with dementia. These mistakes may both simply be the result of a small error in how the time variable is applied by the algorithm, which creates a lag in the diagnosis predictions.
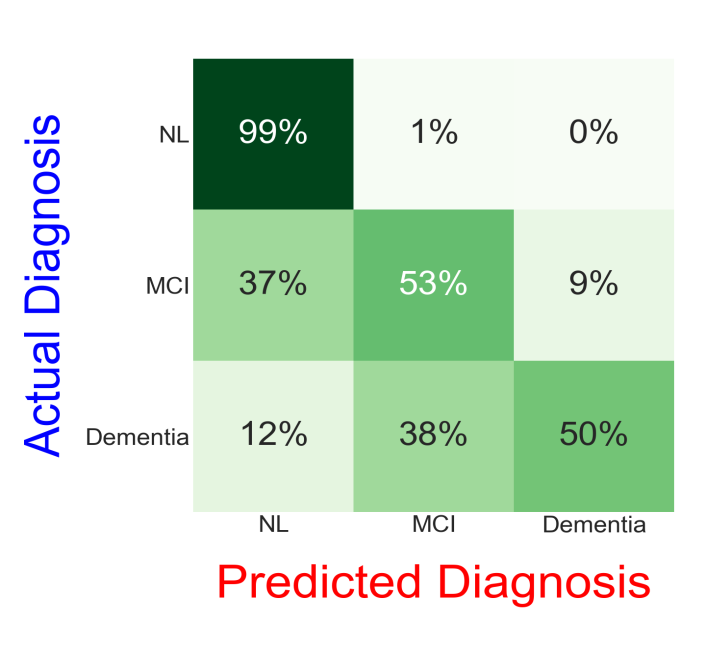
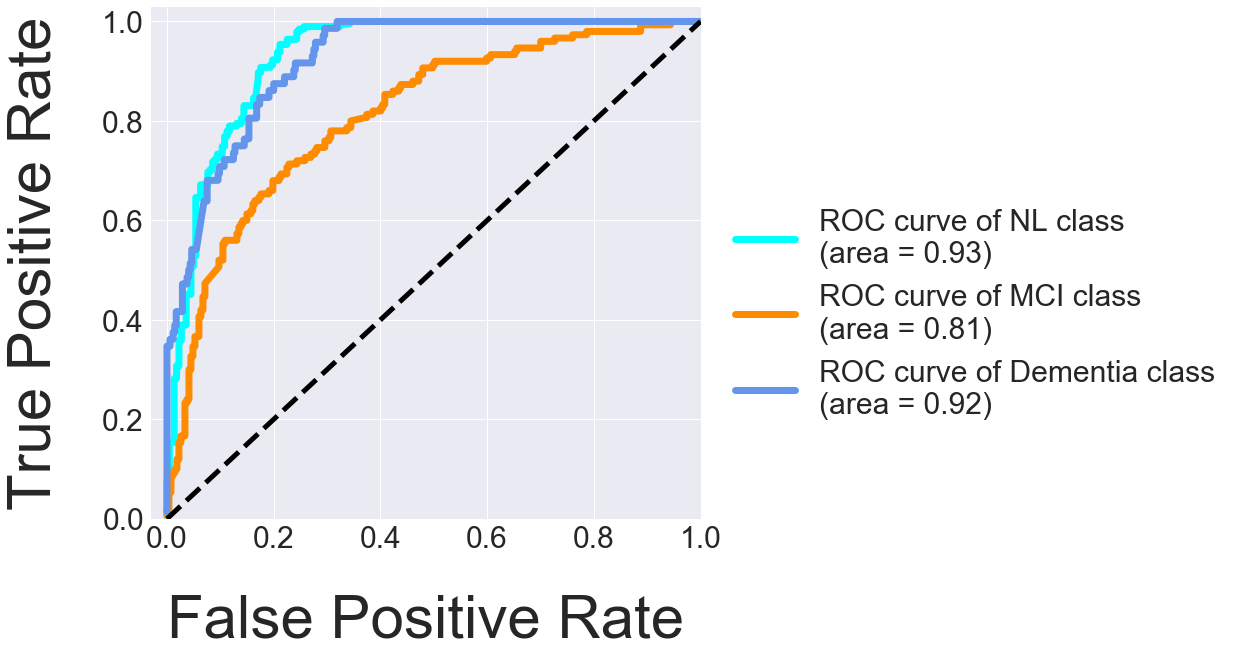
Figure 5 shows a group of Receiver Operating Characteristic (ROC) curves based on the output of the best performing model, which measure how well the model can separate two groups: patients with a particular diagnosis and patients with one of the other diagnoses. Interestingly, the ROC score for the MCI class is lower than the other two ROC scores, suggesting that the model is having more difficulty separating patients with MCI from the other two groups. Based on these individual ROC scores, the model’s average mAUC score (0.866) could be dramatically increased if the model’s ability to separate MCI patients from non-MCI patients was improved.
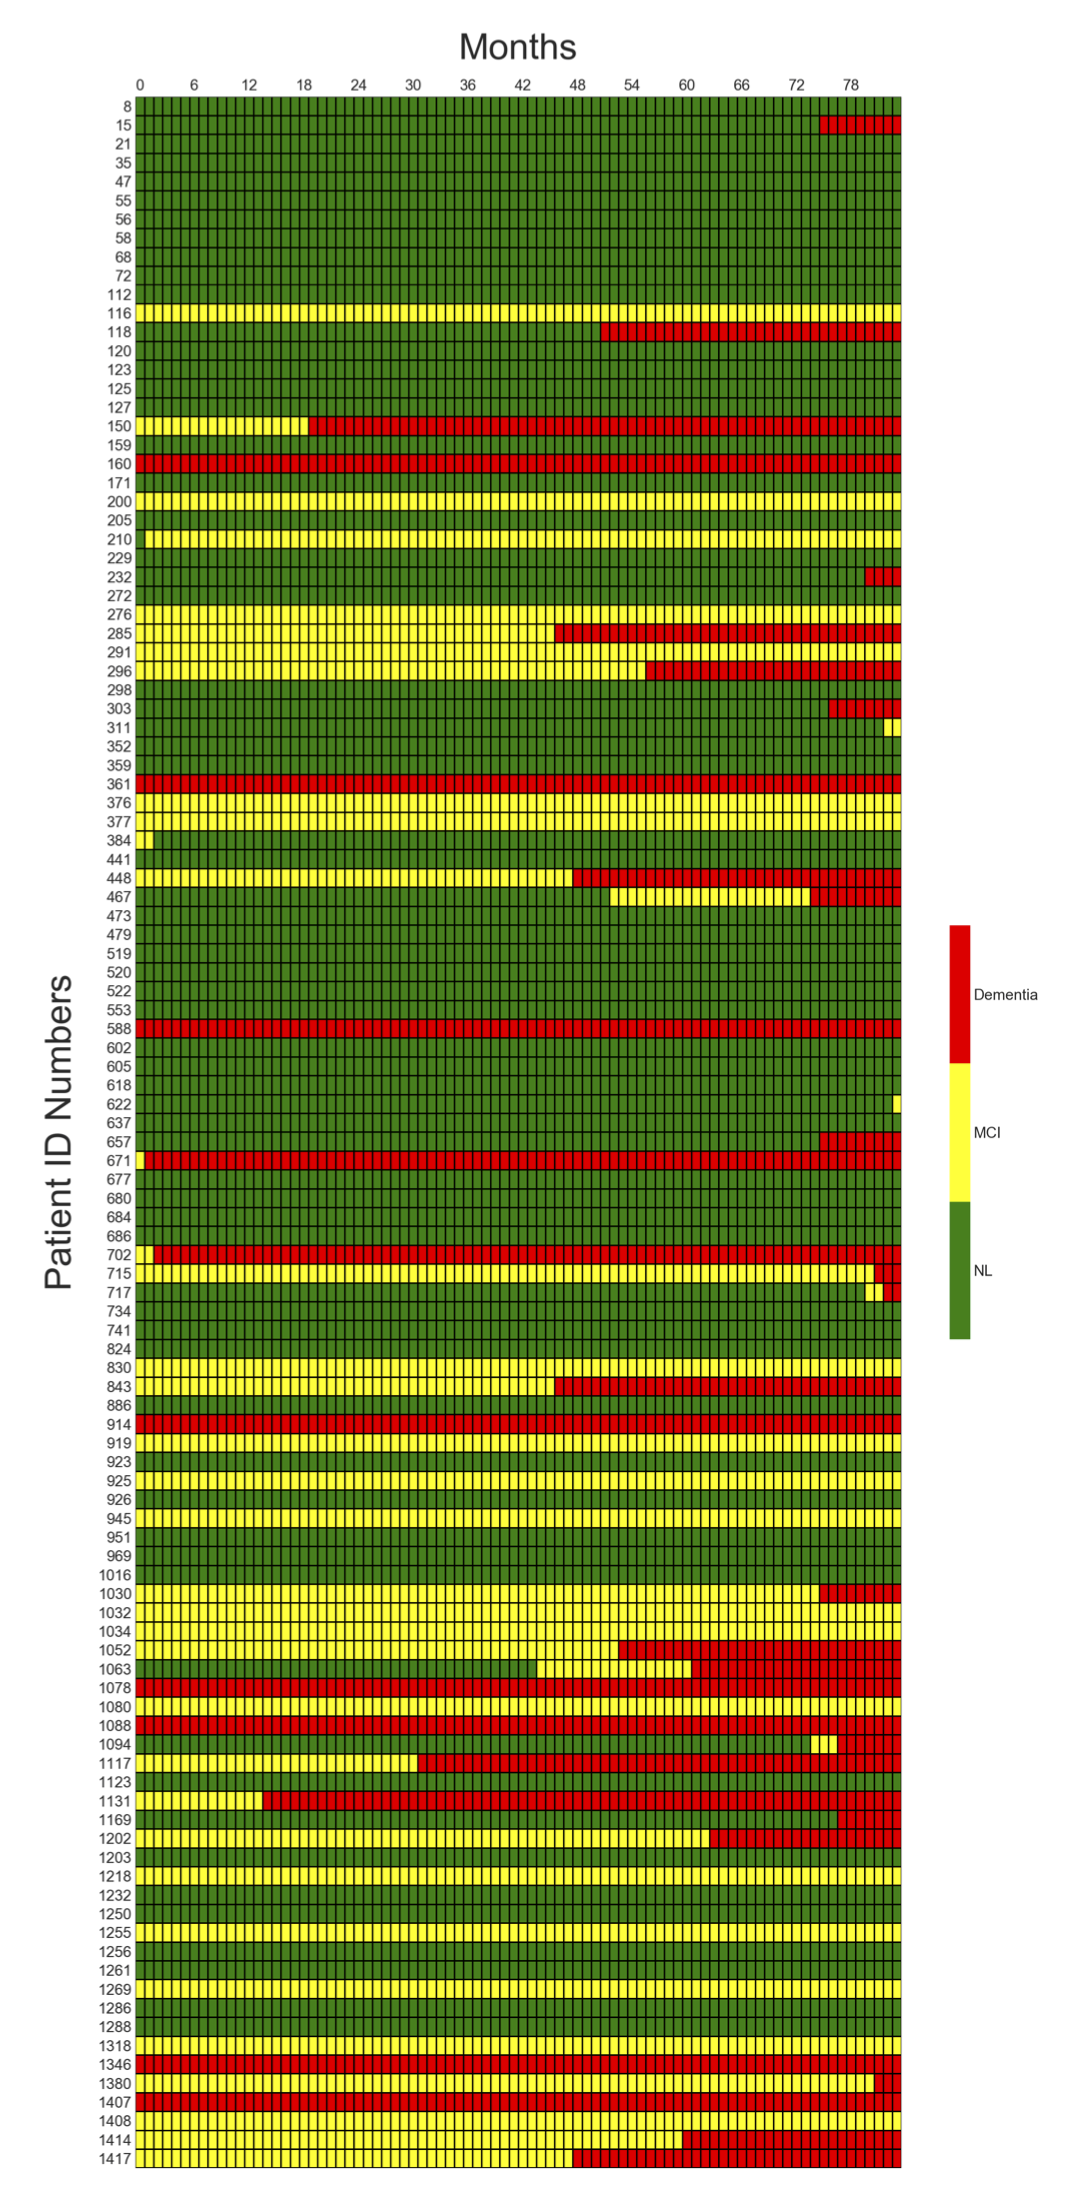
The best performing model was also used to predict the future diagnosis of normal, MCI, or dementia for all 110 patients in the LB2/LB4 datasets on a month-to-month basis over an 84-month (7-year) period, as shown in Figure 6. The model predicted that some patients would remain normal over the entire 7-year period, while others would progress from normal to MCI to dementia.
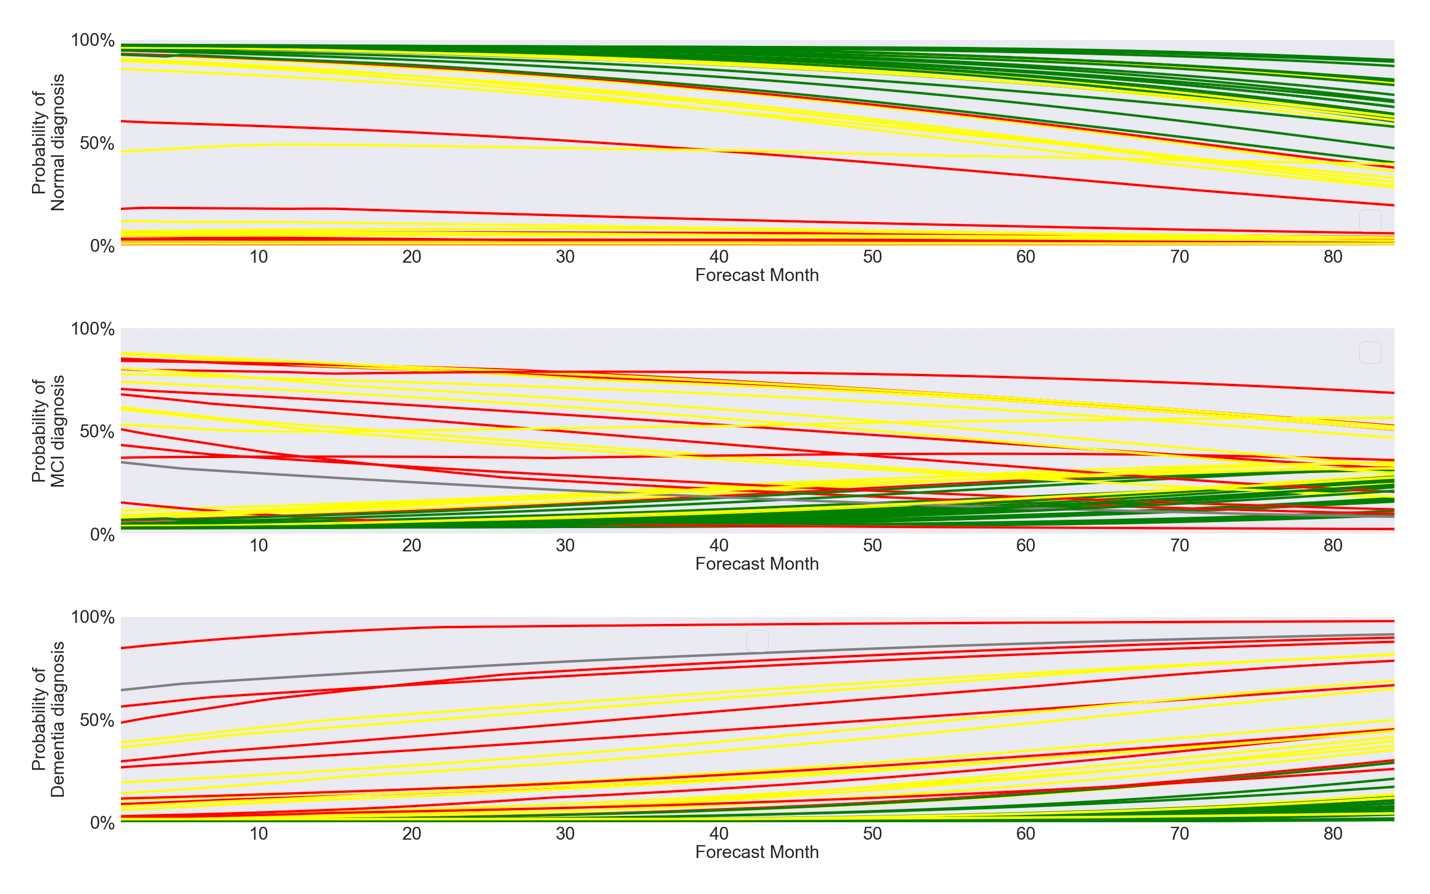
Time courses were also generated for a random subset of these patients (n=50) showing how the likelihood of normal, MCI, or dementia diagnoses is forecast to vary over the 84 months, as shown in Figure 7. The color of each curve (green, yellow, or red) indicates the most severe diagnosis actually received by the patient (normal, MCI, or dementia, respectively) during the 7-year period. As can be seen in Figure 7, patients who remained normal over the entire 84-month period generally received very low predicted probabilities of MCI or dementia diagnoses from the model. Similarly, patients who were diagnosed with dementia at some point during this period generally received high predicted probabilities of dementia from the model.
4 Conclusion
Previous work published by others has shown that machine learning algorithms can accurately classify a patient’s current cognitive state (normal, MCI, or dementia) using contemporaneous clinical data. [30, 31, 32] This project has extended this previous work by looking at how past and present clinical data can be used to predict a patient’s future cognitive state and by developing machine learning models that can correlate clinical data obtained from patients at one time point with the progression of AD in the future. Several of the machine-learning models used in this project were effective at predicting the progression of AD, both in cognitively normal patients and patients suffering from MCI. Additionally, a novel All-Pairs technique was developed to compare all possible pairs of temporal data points for each patient to generate the training dataset. By comparing data points at different points in time, the All-Pairs technique adds time as a variable and therefore does not require fixed time intervals, which are unlikely to occur in “real-life” data. [37] These techniques could be used to identify patients having high AD risk before they are diagnosed with MCI or dementia and who would therefore make good candidates for clinical trials for AD therapeutics. Since the inability to identify AD patients at early stages is believed to be one of the primary reasons for the frequent failure of AD clinical trials, these techniques may help increase the chances of finding a treatment for AD.
Acknowledgements
Thank you to Jen Selby, Rachel Dragos, Ted Theodosopoulos, Daphne Koller, and Michael Weiner for reviewing this manuscript and providing me with valuable feedback, suggestions, and advice.
Data collection and sharing for this project was funded by the Alzheimer’s Disease Neuroimaging Initiative (ADNI) (National Institutes of Health Grant U01 AG024904) and DOD ADNI (Department of Defense award number W81XWH-12-2-0012). ADNI is funded by the National Institute on Aging, the National Institute of Biomedical Imaging and Bioengineering, and through generous contributions from the following: AbbVie, Alzheimer’s Association; Alzheimer’s Drug Discovery Foundation; Araclon Biotech; BioClinica, Inc.; Biogen; Bristol-Myers Squibb Company; CereSpir, Inc.; Cogstate; Eisai Inc.; Elan Pharmaceuticals, Inc.; Eli Lilly and Company; EuroImmun; F. Hoffmann-La Roche Ltd and its affiliated company Genentech, Inc.; Fujirebio; GE Healthcare; IXICO Ltd.; Janssen Alzheimer Immunotherapy Research & Development, LLC.; Johnson & Johnson Pharmaceutical Research & Development LLC.; Lumosity; Lundbeck; Merck & Co., Inc.; Meso Scale Diagnostics, LLC.; NeuroRx Research; Neurotrack Technologies; Novartis Pharmaceuticals Corporation; Pfizer Inc.; Piramal Imaging; Servier; Takeda Pharmaceutical Company; and Transition Therapeutics. The Canadian Institutes of Health Research is providing funds to support ADNI clinical sites in Canada. Private sector contributions are facilitated by the Foundation for the National Institutes of Health (www.fnih.org). The grantee organization is the Northern California Institute for Research and Education, and the study is coordinated by the Alzheimer’s Therapeutic Research Institute at the University of Southern California. ADNI data are disseminated by the Laboratory for Neuro Imaging at the University of Southern California.
References
- [1] Dennis J Selkoe and Peter J Lansbury Jr. “Alzheimer’s Disease Is the Most Common Neurodegenerative Disorder” In Basic Neurochemistry: Molecular, Cellular and Medical Aspects Lippincott-Raven, 1999
- [2] Sulantha Mathotaarachchi et al. “Identifying incipient dementia individuals using machine learning and amyloid imaging” In Neurobiology of Aging 59 Elsevier, 2017, pp. 80–90 DOI: 10.1016/j.neurobiolaging.2017.06.027
- [3] Barry Reisberg, Betty Gordon, Martin McCarthy and Steven H. Ferris “Clinical Symptoms Accompanying Progressive Cognitive Decline and Alzheimer’s Disease” In Alzheimer’s Dementia Totowa, NJ: Humana Press, 1985, pp. 19–39 DOI: 10.1007/978-1-4612-5174-3{\_}3
- [4] Christian Humpel “Identifying and validating biomarkers for Alzheimer’s disease” In Trends in Biotechnology 29.1 Elsevier, 2011, pp. 26–32
- [5] Chia-Chen Liu, Takahisa Kanekiyo, Huaxi Xu and Guojun Bu “Apolipoprotein E and Alzheimer disease: risk, mechanisms and therapy” In Nature Reviews Neurology 9.2 Nature Publishing Group, 2013, pp. 106
- [6] Yangling Mu and Fred H Gage “Adult hippocampal neurogenesis and its role in Alzheimer’s disease” In Molecular neurodegeneration 6.1 BioMed Central, 2011, pp. 85
- [7] L. Teri et al. “Cognitive Decline in Alzheimer’s Disease: A Longitudinal Investigation of Risk Factors for Accelerated Decline” In The Journals of Gerontology Series A: Biological Sciences and Medical Sciences 50A.1 Oxford University Press, 1995, pp. M49–M55 DOI: 10.1093/gerona/50A.1.M49
- [8] PJ Moore, TJ Lyons, John Gallacher and Alzheimer’s Disease Neuroimaging Initiative “Random forest prediction of Alzheimer’s disease using pairwise selection from time series data” In PLOS ONE 14.2 Public Library of Science, 2019, pp. e0211558
- [9] Judith Neugroschl and Sophia Wang “Alzheimer’s disease: diagnosis and treatment across the spectrum of disease severity.” In The Mount Sinai journal of medicine, New York 78.4 NIH Public Access, 2011, pp. 596–612 DOI: 10.1002/msj.20279
- [10] Razvan V. Marinescu et al. “TADPOLE Challenge: Prediction of Longitudinal Evolution in Alzheimer’s Disease”, 2018 arXiv: http://arxiv.org/abs/1805.03909
- [11] Asha Singanamalli, Haibo Wang and Anant Madabhushi “Cascaded Multi-view Canonical Correlation (CaMCCo) for Early Diagnosis of Alzheimer’s Disease via Fusion of Clinical, Imaging and Omic Features” In Scientific Reports 7.1 Nature Publishing Group, 2017, pp. 8137
- [12] Dragan Gamberger et al. “Identification of clusters of rapid and slow decliners among subjects at risk for Alzheimer’s disease” In Scientific reports 7.1 Nature Publishing Group, 2017, pp. 6763
- [13] “The Need for Early Detection and Treatment in Alzheimer’s Disease” In EBioMedicine 9 Elsevier, 2016, pp. 1–2 DOI: 10.1016/j.ebiom.2016.07.001
- [14] Alzheimer’s Association “What We Know Today About Alzheimer’s Disease”, 2010 URL: https://www.actionalz.org/research/science/alzheimers_disease_treatments.asp
- [15] Jeffrey L Cummings, Travis Morstorf and Kate Zhong “Alzheimer’s disease drug-development pipeline: few candidates, frequent failures” In Alzheimer’s research & therapy 6.4 BioMed Central, 2014, pp. 37
- [16] Iqra Mumal “Poor Results Prompt Takeda and Zinfandel to End Phase 3 Alzheimer’s Therapy Trial Early”, 2018 URL: https://alzheimersnewstoday.com/2018/01/31/takeda-and-zinfandel-bring-early-end-to-phase-3-trial-of-alzheimers-therapy-pioglitazone/
- [17] Michelle Cortez “Merck Will End Alzheimer’s Trial as Alternative Approach Fails”, 2018 URL: https://www.bloomberg.com/news/articles/2018-02-13/merck-will-end-alzheimer-s-trial-as-alternative-approach-fails
- [18] “U.S. Food and Drug Administration”, 2018 URL: https://www.fda.gov/downloads/Drugs/GuidanceComplianceRegulatoryInformation/Guidances/UCM596728.pdf
- [19] Scott Gottlieb “Statement from FDA Commissioner Scott Gottlieb, M.D. on advancing the development of novel treatments for neurological conditions; part of broader effort on modernizing FDA’s new drug review programs”, 2018 URL: https://www.fda.gov/NewsEvents/Newsroom/PressAnnouncements/ucm596897.htm
- [20] Stefan Teipel et al. “Multimodal imaging in Alzheimer’s disease: Validity and usefulness for early detection” In The Lancet Neurology 14.10 Elsevier, 2015, pp. 1037–1053 DOI: 10.1016/S1474-4422(15)00093-9
- [21] Neil P Oxtoby and Daniel C Alexander “Imaging plus X: Multimodal models of neurodegenerative disease” In Current Opinion in Neurology 30.4 Wolters Kluwer Health, 2017, pp. 371–379 DOI: 10.1097/WCO.0000000000000460
- [22] Sean M Nestor et al. “Ventricular enlargement as a possible measure of Alzheimer’s disease progression validated using the Alzheimer’s disease neuroimaging initiative database” In Brain 131.9 Oxford University Press, 2008, pp. 2443–2454 DOI: 10.1093/brain/awn146
- [23] ADNI Staff “ADNI General Procedures Manual”, 2010 URL: https://adni.loni.usc.edu/wp-content/uploads/2010/09/ADNI_GeneralProceduresManual.pdf
- [24] Jacqueline K Kueper, Mark Speechley and Manuel Montero-Odasso “The Alzheimer’s Disease Assessment Scale-Cognitive Subscale (ADAS-Cog): Modifications and Responsiveness in Pre-Dementia Populations. A Narrative Review.” In Journal of Alzheimer’s disease : JAD 63.2 IOS Press, 2018, pp. 423–444 DOI: 10.3233/JAD-170991
- [25] Jing Wan et al. “Identifying the Neuroanatomical Basis of Cognitive Impairment in Alzheimer’s Disease by Correlation-and Nonlinearity-Aware Sparse Bayesian Learning NIH Public Access” In IEEE Trans Med Imaging 33.7, 2014, pp. 1475–1487 DOI: 10.1109/TMI.2014.2314712
- [26] Sibel Tekin et al. “Activities of Daily Living in Alzheimer’s Disease: Neuropsychiatric, Cognitive, and Medical Illness Influences” In The American Journal of Geriatric Psychiatry 9.1 Elsevier, 2001, pp. 81–86 DOI: 10.1097/00019442-200102000-00013
- [27] Steve Balsis et al. “How Do Scores on the ADAS-Cog, MMSE, and CDR-SOB Correspond?” In The Clinical Neuropsychologist 29.7, 2015, pp. 1002–1009 DOI: 10.1080/13854046.2015.1119312
- [28] Kyle Brauer Boone, Po Lu and Johnny Wen “Comparison of various RAVLT scores in the detection of noncredible memory performance” In Archives of Clinical Neuropsychology 20.3 Oxford University Press, 2005, pp. 301–319 DOI: 10.1016/j.acn.2004.08.001
- [29] R I Pfeffer et al. “Measurement of functional activities in older adults in the community.” In Journal of gerontology 37.3, 1982, pp. 323–9 URL: http://www.ncbi.nlm.nih.gov/pubmed/7069156
- [30] Soheil Esmaeilzadeh, Dimitrios Ioannis Belivanis, Kilian M. Pohl and Ehsan Adeli “End-To-End Alzheimer’s Disease Diagnosis and Biomarker Identification”, 2018 arXiv: http://arxiv.org/abs/1810.00523
- [31] Xiaojing Long, Lifang Chen, Chunxiang Jiang and Lijuan Zhang “Prediction and classification of Alzheimer disease based on quantification of MRI deformation” In PLoS ONE 12.3, 2017, pp. 1–19 DOI: 10.1371/journal.pone.0173372
- [32] Daoqiang Zhang et al. “Multimodal classification of Alzheimer’s disease and mild cognitive impairment.” In NeuroImage 55.3 NIH Public Access, 2011, pp. 856–67 DOI: 10.1016/j.neuroimage.2011.01.008
- [33] Guido Gainotti, Davide Quaranta, Maria Gabriella Vita and Camillo Marra “Neuropsychological Predictors of Conversion from Mild Cognitive Impairment to Alzheimer’s Disease” In Journal of Alzheimer’s Disease 38.3 IOS Press, 2013, pp. 481–495 DOI: 10.3233/JAD-130881
- [34] David J Hand and Robert J Till “A simple generalisation of the area under the ROC curve for multiple class classification problems” In Machine learning 45.2 Springer, 2001, pp. 171–186
- [35] Mostafa Mehdipour Ghazi et al. “Robust training of recurrent neural networks to handle missing data for disease progression modeling”, 2018 arXiv: https://arxiv.org/abs/1808.05500
- [36] Minh Nguyen et al. “Modeling Alzheimer’s disease progression using deep recurrent neural networks” In 2018 International Workshop on Pattern Recognition in Neuroimaging (PRNI) IEEE, 2018, pp. 1–4 DOI: 10.1109/PRNI.2018.8423955
- [37] Jorge L Bernal-Rusiel et al. “Statistical Analysis of Longitudinal Neuroimage Data with Linear Mixed Effects Models” In Neuroimage 0, 2013, pp. 249–260 DOI: 10.1016/j.neuroimage.2012.10.065