Charge and nematic orders in AFe2As2 (A= Rb,Cs) superconductors
Abstract
We discuss the results of 75As Nuclear Quadrupole Resonance (NQR) and muon spin relaxation measurements in AFe2As2 (A= Cs, Rb) iron-based superconductors. We demonstrate that the crossover detected in the nuclear spin-lattice relaxation rate (around 150 K in RbFe2As2 and around 75 K in CsFe2As2 ), from a high temperature nearly localized to a low temperature delocalized behaviour, is associated with the onset of an inhomogeneous local charge distribution causing the broadening or even the splitting of the NQR spectra as well as an increase in the muon spin relaxation rate. We argue that this crossover, occurring at temperatures well above the phase transition to the nematic long-range order, is associated with a charge disproportionation at the Fe sites induced by competing Hund’s and Coulomb couplings. In RbFe2As2 around 35 K, far below that crossover temperature, we observe a peak in the NQR which is possibly associated with the critical slowing down of electronic nematic fluctuations on approaching the transition to the nematic long-range order.
pacs:
74.70.Xa, 76.60.-k, 71.27.+a,74.20.MnI Introduction
The high temperature superconducting cuprates are paradigmatic examples of strongly correlated electron systems close to a Mott-Hubbard transition,MHub where the large electron Coulomb repulsion competes with the tendency of the electrons to delocalize. Electronic correlations remain sizeable even at hole doping levels leading to high temperature superconductivity and the competition between different energy scales gives rise to several crossovers and phases, the most debated one being the charge density wave (CDW), which progressively fades away as the doping increases Marc ; Tranquada ; Ghiringhelli ; Hucker . The effect of electronic correlations in iron-based superconductors (IBS)IBS is more subtle. At variance with the cuprates, in IBS the Fermi level typically crosses five bands associated with the Fe 3 orbitals, leading to a rich phenomenology in the normal as well as in the superconducting state.bands ; Johnston The most relevant phenomena emerging from the electronic structure of the IBS are the electronic nematic ordernema1 , developing over a wide portion of IBS phase diagrams, and the presence of an orbital selective behaviour,orbsel1 which can eventually lead to orbital selective Mott transitions.orbselMott
While the nematic fluctuations are detected over a broad charge doping range,nemNMR ; Gallais the orbital selective behaviour becomes relevant only upon approaching half filling (5 e-/Fe), where the effect of electronic correlations gets more sizeable.orbsel1 In particular, in the hole-doped AFe2As2 (A=Cs, K or Rb) IBS, with 5.5 e-/Fe, it has been theoretically pointed out since almost 10 years agoorbsel1 that while electrons in dxy bands are close to localization, the other bands remain metallic with much lower effective masses. This phenomenology, driven by the Hund’s coupling , which tends to decouple charge excitations in the different orbitals, has so far been evidenced by many experiments.orbselexp1 ; mass1 ; mass2 More interestingly, the proximity to localization for certain bands and the competition between and could eventually lead to a inhomogeneous charge distribution among the Fe ions.Isidori Namely to a charge order, as in the cuprates, even if driven by a different mechanism. In fact, the large Hund’s coupling promotes the electron transfer to generate high spin (HS) configurations and accordingly to a modulation of the charge distribution on the Fe ions.Isidori
In this manuscript we report on 75As nuclear quadrupolar resonance (NQR) measurements in RbFe2As2 and CsFe2As2 single crystals, complementing our previous results on RbFe2As2 powders.civardi NQR has the great advantage of allowing to probe the equilibrium properties of the system without needing to perturb its electronic state and the lattice by applying an external magnetic field, strain or by inducing electronic transitions. As for the powders, we found also in the crystals a broadening of the NQR line below a characteristic temperature , the same temperature where a crossover in 75As to a low temperature power law behaviour is detected. The observed NQR line broadening cannot be associated with a static nematic order but rather signals the onset of a charge order, possibly described within the framework of the charge disproportionation model. The changes in the electronic structure taking place at T∗ are observed to affect also the muon spin relaxation rate. Finally, we show that 75As NQR shows a clear anomaly at T K, evidencing the slowing down of nematic fluctuations on approaching the Ising nematic order recently detected by elastoresistivity measurements.XYnematic
II Experimental methods and results
The measurements presented in this work were performed both on powders, for RbFe2As2 , and on single crystals of (Cs,Rb)Fe2As2. The powders were grown following the procedure described in Ref.Bukowski, while the single crystals were grown by use of the self-flux technique, as described in Ref.xtal, . Owing to their air sensitivity care was taken to avoid exposure to air.
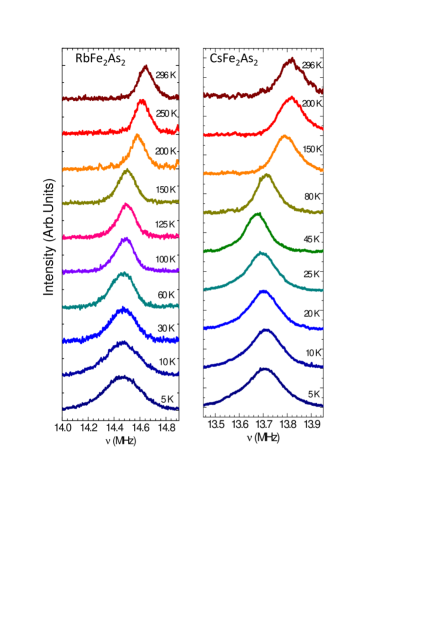
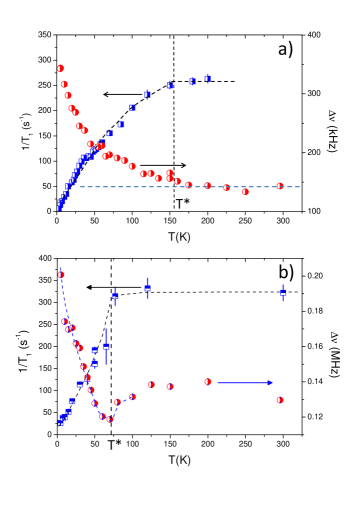
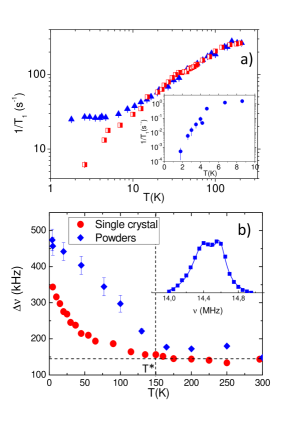
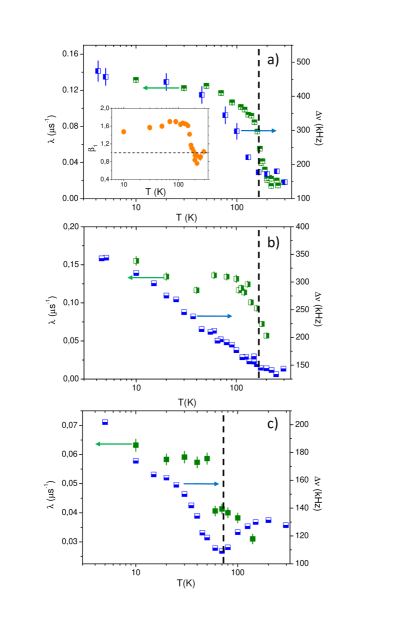
75As NQR spectra were obtained by recording the amplitude of the Fourier transform of half of the echo, detected after a pulse sequence, as a function of the irradiation frequency. The delay was kept much lower than the transverse decay time civardi in order to avoid an unwanted reduction of the echo signal intensity. The NQR spectra for the CsFe2As2 and RbFe2As2 single crystals are reported in Fig.1. One observes in both cases a broadening of the NQR line below a temperature K for RbFe2As2 and K for CsFe2As2 (see Fig. 2).Tstar In the RbFe2As2 powder sample one observes a more pronounced broadening with respect to RbFe2As2 single crystal (see Fig. 3) and, as it was pointed out by Civardi et al. civardi , at low temperature two bumps in the NQR spectrum are detected, which indicates a modulation of the local charge distribution across the lattice.
75As nuclear spin-lattice relaxation rate was measured by recording the recovery of the nuclear magnetization after a saturation recovery pulse sequence. In the single crystals the recovery of the nuclear magnetization could be fit with a single componentsuppl
| (1) |
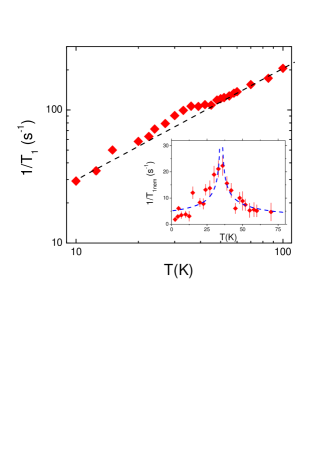
with , a factor accounting for a non-perfect saturation, and a stretching exponent close to unity. This is different from the low temperature results for RbFe2As2 powder samples where two exponential components were detected below 15 Kcivardi : a slow relaxing one and a fast relaxing one. The temperature dependence of 75As NQR is shown in Fig.2. While above 75As is almost constant, below one observes a power law decrease, in agreement with previous reports.Khune ; civardi ; Wu The behaviour in the RbFe2As2 single crystals and powders is quite similar down to about 10 K (see Fig.3). Below that temperature the spin-lattice relaxation rate measured in the powder, associated with the fast component tends to flatten, while the for the slow component decreases faster.civardi Namely, below 10 K the behaviour found in the single crystals is in between that found for the two components in the powders. As it will be emphasized in the following, in the RbFe2As2 single crystal a clear bump in temperature dependence emerges around 35 K (see Fig.4). On the other hand, in CsFe2As2 we do not observe that anomaly.
The changes occurring at seem to affect also the zero field muon spin relaxation (ZFSR). ZFSR measurements on RbFe2As2 powders were performed at ISIS facility on EMU beam line, while the ones on RbFe2As2 and CsFe2As2 crystals were carried out at the Paul Scherrer Institute on GPS beam line. The powder sample was mounted in an air tight sample holder inside a glove box in order to avoid exposure to air. The crystals were also mounted on a sample holder inside a glove box. They were first wrapped with a 20 silver foil, then sealed inside a 100 kapton adhesive tape, mounted on the sample holder and then transferred in an air tight bottle to the beam line. Once at the beam line the sample holder was exposed to air only for the time needed to mount it on the stick and insert in the cryostat (about 2-3 minutes). Notice that during that time the crystal was in anyway protected from air exposure by the kapton tape. The crystals were mounted with the axis along the initial muon polarization. A mosaic of 2 and 3 platelike crystals were used to cover a sufficiently large surface (about 1 cm2). Since their thickness was of a few hundreds of microns we used kapton foil degraders to increase the muon stopping fraction inside the sample.
In all cases the decay of the muon polarization could be fit with a stretched exponential behavioursuppl
| (2) |
with a temperature dependent exponent . is the ZFSR relaxation rate, the initial asymmetry and a constant background due to the sample environment, mainly due to silver for the measurements on RbFe2As2 powders. We point out that during the measurements at GPS, the initial asymmetry was reduced due to muonium formation in the kapton foil degraders.suppl
The temperature dependence of in RbFe2As2 powders and in RbFe2As2 and CsFe2As2 crystals is shown in Fig. 5. In the RbFe2As2 powders and crystals there is a clear increase in the relaxation on cooling at a temperature slightly higher than while in CsFe2As2 crystals the increase is more modest and seems to take place slightly below . It is interesting to notice that in the powders when increases there is also a neat increase of (Fig.4), from values slightly below 1 to about 1.8.
III Discussion
For a nuclear spin , as it is the case of 75As, the NQR spectrum is characterized by a single line, associated with the transition, at a frequencyAbragam
| (3) |
with the nuclear electric quadrupole moment, the main component of the electric field gradient (EFG) tensor and its asymmetry . Hence the NQR spectrum probes the EFG at the nuclei induced by the local charge distribution. As we have already pointed out,civardi although DFT calculations provide a reasonable estimate of the NQR frequency they cannot account for many details of the physics of these systems as the NQR line broadening. The broadening of the NQR line indicates a modulation of the local charge distribution across the lattice, as it is typically observed in the cuprates when a charge order develops.WuQ The different magnitude of the broadening observed in the RbFe2As2 crystal and in the powders could tentatively be associated with the higher degree of disorder in the latter ones.
The experimental observation that both in CsFe2As2 and in RbFe2As2 the broadening of the NQR spectrum occurs at the same temperature where starts to drop, suggests that at a change in the electronic configuration is taking place. In particular, while the nearly temperature independent behaviour of at high temperature is typical of a strongly correlated electron system with nearly localized electrons,NMRT1 the power law behaviour observed below indicates a more metallic behaviour. This phenomenology is typically observed in Heavy Fermion (HF) compounds, as CeCu6 for example,HFT1 with corresponding to the coherence temperature below which the heavy electrons delocalize into the Fermi sea. In CsFe2As2 and RbFe2As2 orbital selectivity gives rise to bands with significantly different effective massesorbsel1 and accordingly a phenomenology of similar to that observed in HF can be expected. However, there is an important difference: in HF compounds usually there is not a change in the NQR spectra across the coherence temperature, except when charge fluctuations are involved.HFcharge Here we observe a broadening of the spectra in the powders and crystals and, as it was remarked in Ref.civardi, , the two bumps which emerge in RbFe2As2 powders at low temperature indicate the breaking of the lattice translational symmetry, namely that there are at least two inequivalent charge configurations around 75As nuclei.
On the basis of 75As NMR measurements Li et al.LiNMR have pointed out that the broadening of the NMR spectra for could be due to the onset of a nematic order breaking the rotational symmetry.Kasahara In the NMR experiments this gives rise to different possible orientations of the external magnetic field with respect to the EFG tensor principal axis (see Fig.6a) and accordingly to a broadening or a splitting of the NMR spectra.LiNMR ; Iye However, in NQR, where there is no applied magnetic field, the breaking of the tetragonal symmetry should not give rise to a broadening or a splitting of the spectra. It causes a drop of LaFeAsO and an increase of the asymmetry parameter at Kitagawa ; Ok ; Zheng , and the different signs of the change of and of counteract in Eq. 3, leading at most to a slight shift in the NQR peak frequency.
One can expect a formation of domains characterized by a rotation of the X and Y axes, as is depicted in Fig. 6a. This formation of domains is characteristic for all iron pnictides and chalcogenides Kitagawa ; Ok ; Zheng ; BaekOrb ; LaFeAsO , however, it does not affect nor and hence, according to Eq. 3, just one NQR line should be detected. In fact, in BaFe2As2 and in LaFeAsO, where a nematic order develops, there is no evidence for a distribution of quadrupolar frequencies and the zero-field 75As NMR lines remain rather narrow down to low temperature.LaFeAsO ; LaMn Hence, the nematic order cannot justify the broadening or splitting of the NQR spectra starting at T∗.
On the other hand, in RbFe2As2 crystals a nematic order has been recently detected by elastoresitivity measurements at K.XYnematic This nematic order has a symmetry resulting in a divergence of the nematic susceptibility when the strain is applied along the [100] direction. Around Tnem a critical slowing down of the nematic fluctuations is expected to enhance the low-frequency spectral density probed by . Remarkably, in RbFe2As2 crystal we observe a clear anomaly in the temperature dependence of around 35 K (Fig.4), very close to where elastoresistivity measurements detect a divergence in the nematic susceptibility.XYnematic It is noticed that this anomaly is absent in the NMR experiments on the same crystal, which suggests either an effect of the external magnetic field on the nematic fluctuations or a marked frequency dependence of the fluctuations. By subtracting from the raw data the power law behaviour describing the contribution of the correlated spin dynamics to for , we derived , the contribution of nematic fluctuations to 75As spin-lattice relaxation rate (Fig. 4). A clear peak in is detected at , as expected for the critical slowing down of the fluctuations, which causes in two dimensions a divergence of , with a dynamic scaling exponent and the correlation length critical exponent.critical ; carretta1997 Given the error bars in data we cannot draw any clear cut conclusion on the critical exponents, still we observe that the data are consistent with a mean-field exponent and .criticaldue
Hence, although from NQR measurements alone one cannot conclude what is generating the peak in , the observation of a peak in the nematic susceptibility in the same temperature range suggests that it is probably driven by electronic nematic fluctuations. We remark that in BaFe2As2 and in LaFeAsO pnictides, owing to the proximity to the magnetic order, it is not straightforward to separate the contribution of nematic fluctuations to from the one of the correlated spin dynamics. In FeSe, where there is no magnetic order, no anomaly in 77Se has been reported at Tnem.FeSeNMR In CsFe2As2 we have no evidence of such an anomaly in the spin-lattice relaxation data. This is consistent with elastoresitivity findingsXYnematic which suggest that T in this compound. It is important to notice, as it has been pointed out in Ref.XYnematic, , that XY nematic fluctuations developing at higher temperature could also promote a charge order and explain the observed broadening of the NQR spectra.
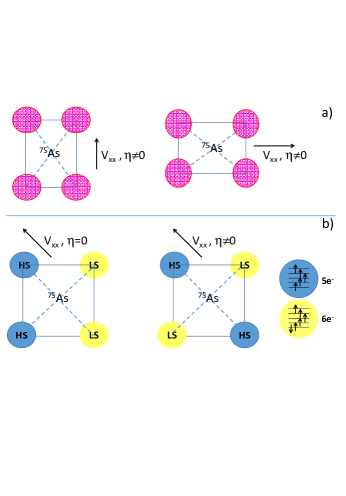
A more sound explanation for the NQR line broadening is based on the realization of a charge disproportionation across the lattice, recently proposed by Isidori et al.Isidori . The Hund’s coupling favours the electron transfer among the Fe ions, in order to realize high spin (HS) configurations, which competes with the on-site Coulomb repulsion . When is sufficiently large configurations with coexisting HS and low spin (LS) Fe would be favoured, leading to a modulation of the local charge on the four Fe around the 75As nuclei.Isidori Since more than one configuration with charge disproportionation can be realized one can expect a distribution of EFG and accordingly a broadening of the NQR line, as we observe, as well of the NMR lines, as detected by Li et al..LiNMR
To better illustrate the effect of charge disproportionation we consider its effect on the basis of a simple point charge model on a cluster formed by 4 Fe ions. In Fig.6b we show two possible arrangements of the charge distribution in the four Fe ions around the 75As nuclei. Based on the point charge model, it is easy to show that the two charge configurations are characterized by the same value for but by quite different values for the EFG asymmetry . Accordingly, from Eq. 3 the NQR frequency for the two configurations would differ by a few percent, namely by few hundreds of kHz, which is of the order of magnitude of the observed broadening or splitting of the NQR lines in RbFe2As2 and CsFe2As2 .
Finally we turn to the discussion of the SR results. As it was pointed out above, close to the SR relaxation rate starts to grow. If the growth of was not at all related to the modification of the electronic structure taking place at , one would expect to find a similar behaviour both for RbFe2As2 and for CsFe2As2 , at variance with the experimental findings. The significant increase in around suggests that the changes in the electronic configuration affect the amplitude and/or the frequency of the fluctuations of the dipolar field generated by the nuclear spins at the muon site. The fact that the exponent characterizing the decay of the muon polarization is varying between about 1 (exponential decay) for to values approaching 2 (Gaussian decay) for , suggests a slowing down of the fluctuations at ,muon a situation typically observed when muons stop diffusing through the lattice. Hence, we argue that the growth of for indicates a slowing down of the muon diffusion, induced by the changes in the lattice potential taking place around .
IV Conclusions
In conclusion, we have shown that in RbFe2As2 and CsFe2As2 superconductors a reorganization of the electronic structure takes place at a temperature , below which not only a change in the spin-lattice relaxation but also an increase in the linewidth of 75As NQR spectra are detected. That broadening suggests the presence of a inhomogeneous charge distribution in the lattice which could be driven by the competition between Hund’s coupling and the Hubbard repulsion. The changes in the lattice potential at possibly affect also the muon diffusion and explain the growth in the muon relaxation detected around that temperature. At TT∗ a nematic order develops in RbFe2As2 and the critical slowing down of the fluctuations can naturally explain the peak observed in . These results point out for the coexistence of electronic nematic and charge orders in RbFe2As2 , with a mechanism driving the charge modulation different from that driving the CDW phase in the cuprates.
acknowledgments
The authors wish to thank L.Fanfarillo and M.Capone for useful discussions. P. Biswas and H.Luetkens are acknowledged for their help during the measurements at ISIS and at PSI, respectively. The authors thank S. Müller- Litvanyi, for support with SEM-EDX measurements. SA thanks the DFG for funding (AS 523/4-1 and 523/3-1). The work at IFW was supported by the Deutsche Forschungsgemeinschaft (DFG) through the Priority Programme SPP1458. The activity in Pavia was supported by MIUR-PRIN2015 Project No. 2015C5SEJJ.
References
- (1) N. F. Mott, Proc. Phys. Soc. London, Sect. A 62, 416 (1949).
- (2) T. Wu, H.Mayaffre, S. Krämer,M. Horvatić, C. Berthier, W.N. Hardy, R. Liang, D.A. Bonn, and M.-H. Julien, Nature (London) 477, 191 (2011).
- (3) J.M. Tranquada, B.J. Sternlieb, J.D. Axe, Y. Nakamura and S. Uchida, Nature 375, 561(1995).
- (4) G. Ghiringhelli, M. Le Tacon, M. Minola, S. Blanco-Canosa, C. Mazzoli, N.B. Brookes, G.M. De Luca, A. Frano, D.G. Hawthorn, F. He, T. Loew, M. Moretti Sala, D.C. Peets, M. Salluzzo, E. Schierle, R. Sutarto, G.A. Sawatzky, E. Weschke, B. Keimer and L. Braicovich, Science 337, 821 (2012).
- (5) M. Hücker, N.B. Christensen, A.T. Holmes, E. Blackburn, E.M. Forgan, R. Liang, D.A. Bonn, W.N. Hardy, O. Gutowski, M. v. Zimmermann, S.M. Hayden and J. Chang, Phys. Rev. B 90, 054514 (2014).
- (6) Y. Kamihara, T. Watanabe, M. Hirano, and H. Hosono, J. Am. Chem. Soc. 130, 3296 (2008).
- (7) D.C. Johnston, Adv. Phys. 59, 803 (2010).
- (8) I. I. Mazin, D. J. Singh, M. D. Johannes, and M. H. Du, Phys. Rev. Lett. 101, 057003 (2008); K. Kuroki, S. Onari, R. Arita, H. Usui, Y. Tanaka, H. Kontani, and H. Aoki, Phys.Rev.Lett. 101, 087004 (2008).
- (9) R.M. Fernandes, A.V. Chubukov, and J. Schmalian, Nat. Phys. 10, 97 (2014).
- (10) L. de’ Medici, S.R. Hassan, M. Capone and X. Dai, Phys.Rev.Lett. 102, 126401 (2009)
- (11) L. de’ Medici, G. Giovannetti and M. Capone, Phys.Rev.Lett. 112, 177001 (2014)
- (12) L. Bossoni, M. Moroni, M. H. Julien, H. Mayaffre, P. C. Canfield, A. Reyes, W. P. Halperin, and P. Carretta, Phys. Rev. B 93, 224517 (2016)
- (13) Y. Gallais, R. M. Fernandes, I. Paul, L. Chauvière, Y.-X. Yang, M.-A. Méasson, M. Cazayous, A. Sacuto, D. Colson, and A. Forget, Phys. Rev. Lett. 111, 267001 (2013).
- (14) D. Zhao, S. J. Li, N. Z. Wang, J. Li, D. W. Song, L. X. Zheng, L. P. Nie, X. G. Luo, T. Wu, and X. H. Chen, Phys. Rev. B 97, 045118 (2018).
- (15) A. K. Pramanik, M. Abdel-Hafiez, S. Aswartham, A. U. B. Wolter, S. Wurmehl, V. Kataev, and B. Büchner, Phys. Rev. B 84, 064525 (2011).
- (16) G. Li, W. Z. Hu, J. Dong, Z. Li, P. Zheng, G. F. Chen, J. L. Luo, and N. L. Wang, Phys. Rev. Lett. 101, 107004 (2008); M. Yi, D. H. Lu, J. G. Analytis, J.-H. Chu, S.-K. Mo, R.-H. He, R. G. Moore, X. J. Zhou, G. F. Chen, J. L. Luo, N. L. Wang, Z. Hussain, D. J. Singh, I. R. Fisher, and Z.-X. Shen, Phys. Rev. B 80, 024515 (2009).
- (17) A. Isidori, M. Berovic, L. Fanfarillo, L. de’ Medici, M. Fabrizio, M. Capone, arXiv:1810.01899
- (18) A. E. Bohmer, T. Arai, F. Hardy, T. Hattori, T. Iye, T. Wolf, H. v. Löhneysen, K. Ishida, and C. Meingast, Phys. Rev. Lett. 114, 027001 (2015).
- (19) S. Nandi, M. G. Kim, A. Kreyssig, R. M. Fernandes, D. K. Pratt, A. Thaler, N. Ni, S. L. Bud?ko, P. C. Canfield, J. Schmalian, R. J. McQueeney, and A. I. Goldman, Phys. Rev. Lett. 104, 057006 (2010).
- (20) C. Fang, H. Yao, W.-F. Tsai, J. Hu, and S. A. Kivelson Phys. Rev. B 77, 224509 (2008)
- (21) K. Ishida, . M. Tsujii, S. Hosoi, Y. Mizukami, S. Ishida, A. Iyo, H. Eisaki, T. Wolf, K. Grube, H. v. Löhneysen, R. M. Fernandes, and T. Shibauchi, arXiv:1812.05267
- (22) E. Civardi, M. Moroni, M. Babij, Z. Bukowski, and P. Carretta, Phy. Rev. Lett. 117, 217001 (2016)
- (23) Z. Bukowski, S. Weyeneth, R. Puzniak, J. Karpinski and B. Batlogg, Physica C 470, S328 (2010).
- (24) S. Khim, S.Aswartham,V.Grinenko, D. Efremov, C. G. F. Blum, F. Steckel, D. Gruner, A. U. B.Wolter, S.-L. Drechsler, C. Hess, S.Wurmehl, and B.Büchner, Phys. Status Solidi B 254, 1600208 (2017).
- (25) There is an uncertainty of K in the estimate of either from the temperature at which the linewidth starts to increase montonously down to low temperatures or from the temperature at which crosses from being nearly constant to a power law behaviour.
- (26) See the Supplemental Material for more details on the NQR recovery laws and on the SR asymmetry decays.
- (27) Z. T. Zhang, D. Dmytriieva, S. Molatta, J. Wosnitza, S. Khim, S. Gass, A. U. B. Wolter, S. Wurmehl, H.-J. Grafe, and H. Kühne, Phys.Rev.B 97, 115110 (2018)
-
(28)
Y. P. Wu, D. Zhao, A. F. Wang, N. Z. Wang, Z. J. Xiang, X. G. Luo, T. Wu, and X. H. Chen, Phys.Rev.Lett. 116, 147001 (2016); see also the
corresponding Supplemental Material at
http://journals.aps.org/prl/supplemental/
10.1103/PhysRevLett.116.147001 - (29) A. Abragam, in Principles of Nuclear Magnetism, Oxford University Press (1983).
- (30) T. Wu, H. Mayaffre, S. Krämer, M. Horvatic, C. Berthier, W.N. Hardy, R. Liang, D.A. Bonn, M.H. Julien, Nature Comm. 6, 6438 (2015)
- (31) A.Rigamonti, F. Borsa and P. Carretta, Rep. Prog. Phys. 61, 1367 (1998)
- (32) P. Carretta, M. Giovannini, M. Horvatić, N. Papinutto, and A. Rigamonti Phys. Rev. B 68, 220404(R) (2003)
- (33) H. Kotegawa, H. Hidaka, T. C. Kobayashi, D. Kikuchi, H. Sugawara, and H. Sato, Phys. Rev. Lett. 99, 156408 (2007)
- (34) J. Li, D. Zhao, Y. P. Wu, S. J. Li, D. W. Song, L. X. Zheng, N. Z. Wang, X. G. Luo, Z. Sun, T. Wu, X. H. Chen, arXiv:1611.04694
- (35) S. Kasahara, H. J. Shi, K. Hashimoto, S. Tonegawa, Y. Mizukami, T. Shibauchi, K. Sugimoto, T. Fukuda, T. Terashima, Andriy H. Nevidomskyy and Y. Matsuda, Nature 486, 382 (2012)
- (36) T. Iye, M.-H. Julien, H. Mayaffre, M. Horvatić, C. Berthier, K. Ishida, H. Ikeda, S. Kasahara, T. Shibauchi and Y. Matsuda, J. Phys. Soc. Jpn. 84, 043705 (2015)
- (37) K. Kitagawa, N. Katayama, K. Ohgushi, M. Yoshida and M. Takigawa, J. Phys. Soc. Jpn. 77, 114709 (2008)
- (38) J. M. Ok, S.-H. Baek, D. V. Efremov, R. Kappenberger, S. Aswartham, J. S. Kim, Jeroen van den Brink, and B. Büchner, Phys. Rev. B 97, 180405(R) (2018)
- (39) R. Zhou, L. Y. Xing, X. C. Wang, C. Q. Jin, and Guo-qing Zheng, Phys. Rev. B 93, 060502(R) (2016)
- (40) S-H. Baek, D.V.Efremov, J.M. Ok, J.S. Kim, J. van der Brink and B. Büchner, Nature Mater. 14, 210 (2015)
- (41) M. Fu, D. A. Torchetti, T. Imai, F. L. Ning, J.-Q. Yan, and A. S. Sefat, Phys. Rev. Lett. 109, 247001 (2012).
- (42) M. Moroni, P. Carretta, G. Allodi, R. De Renzi, M. N. Gastiasoro, B. M. Andersen, P. Materne, H.-H. Klauss, Y. Kobayashi, M. Sato, and S. Sanna, Phys. Rev. B 95 180501(R) (2017)
- (43) P. C. Hohenberg and B. I. Halperin, Rev. Mod. Phys. 49, 435 (1977)
- (44) P. Carretta, A. Rigamonti, and R. Sala, Phys. Rev. B 55, 3734 (1997)
- (45) H. E. Stanley in Introduction to Phase Transitions and Critical Phenomena, Oxford University Press (1971)
- (46) S.-H. Baek, D. V. Efremov, J. M. Ok, J. S. Kim, Jeroen van den Brink,and B. Büchner, Phys. Rev. B 93, 180502(R) (2016)
- (47) S.J. Blundell, Contemp. Phys. 40, 175 (1999)