A New, Larger Sample of Supernova Remnants in NGC 6946
Abstract
The relatively nearby spiral galaxy NGC 6946 is one of the most actively star forming galaxies in the local Universe. Ten supernovae (SNe) have been observed since 1917, and hence NGC 6946 surely contains a large number of supernova remnants (SNRs). Here we report a new optical search for these SNRs using narrow-band images obtained with the WIYN telescope. We identify 147 emission nebulae as likely SNRs, based on elevated [S II]:H ratios compared to H II regions. We have obtained spectra of 102 of these nebulae with Gemini North–GMOS; of these, 89 have [S II]:H ratios greater than 0.4, the canonical optical criterion for identifying SNRs. There is very little overlap between our sample and the SNR candidates identified by Lacey et al. (2001) from radio data. Also, very few of our SNR candidates are known X-ray sources, unlike the situation in some other galaxies such as M33 and M83. The emission line ratios, e.g., [N II]:H, of the candidates in NGC 6946 are typical of those observed in SNR samples from other galaxies with comparable metallicity. None of the candidates observed in our low-resolution spectra show evidence of anomalous abundances or significant velocity broadening. A search for emission at the sites of all the historical SNe in NGC 6946 resulted in detections for only two: SN 1980K and SN 2004et. Spectra of both show very broad, asymmetric line profiles, consistent with the interaction between SN ejecta and the progenitor star’s circumstellar material, as seen in late spectra from other core-collapse SNe of similar age.
1 Introduction
NGC 6946 is a nearby ( Mpc, Tikhonov, 2014), nearly face-on (, de Blok et al., 2008) galaxy with four flocculent spiral arms. The galaxy is currently undergoing a major starburst, and as a result it has been the site of ten historical supernovae (SNe) since 1917, the most of any known galaxy. According to Jarrett et al. (2013) the total star formation rate is , a high rate that is thought to be bar-driven. A total of 121 bubbles, probably created by stellar winds and multiple SNe at the star-formation sites, have been identified in H I gas that extends well outside the bright portions of the optical galaxy (Boomsma et al., 2008). Given these properties, one expects that a large number of supernova remnants (SNRs) should be present in NGC 6946, since SNRs tend to remain visible for thousands of years.
Optically, SNRs are usually identified on the basis of high [S II]:H ratios compared to H II regions. In bright H II regions, most sulfur is found in the form of S++ (or above, e.g., Pagel, 1978; Levenson et al., 1995), and as a result the [S II]:H ratios are typically 0.1 or smaller. In SNRs, where emission is driven by impulsive heating from shock waves, S+ is found in an extended recombination and cooling zone behind the shock, and the [S II]:H ratios are typically .111There are SNRs, including Tycho’s SNR and SN1006, that have optical spectra dominated by Balmer line emission and with little if any [S II], but they are rare (see, e.g. Heng, 2010). All are thought to be the products of SN Ia explosions. All are young SNRs expanding into a tenuous ISM with shock velocities that are so high that a recombination zone has not had time to develop. Such SNRs would be missed in the type of survey we describe here. As such objects age, they should become detectable. The diagnostic can become less deterministic as one pushes to lower surface brightness, as recently discussed by Long et al. (2018) for the case of M33.
The first optical search for SNRs in NGC 6946 was made by Matonick & Fesen (1997), hereafter MF97, who used interference filter imagery to identify 27 emission nebulae with [S II]:H ratios 0.45 as SNRs. One of these sources, MF-16, was later associated with the ultraluminous black hole X-ray binary NGC 6946 X-1 (Roberts & Colbert, 2003). Though very rare, such ultra-luminous X-ray sources (ULXs) have hard X-ray spectra that produce line ratios in the surrounding circumstellar ISM that resemble those expected from SNRs. To our knowledge, no other optical searches for SNRs in NGC 6946 exist, nor have spectra of the remaining MF97 objects ever been reported.
Here we discuss a new, more sensitive optical search for SNRs in NGC 6946 in which we identify a total of 147 SNR candidates using interference filter imagery. We also discuss spectroscopic observations of 102 of these candidates, which we use to verify the ratios obtained from the imaging and to characterize other characteristics of our new optical sample. The paper is organized as follows: Section 2 describes both our imaging and spectroscopy observations, presents our significantly expanded catalog of optical SNR candidates, and the results of our spectroscopy. Section 3 discusses these results in the context of both NGC 6946 and other spiral galaxies, and Section 4 presents our detection and late-time spectra of two of the historical SNe in NGC 6946. Finally, Section 5 provides a brief summary of our results.
2 Observations and Data Reduction
2.1 Imaging and Catalog of SNR Candidates
We carried out narrow-band imaging observations of NGC 6946 from the 3.5m WIYN telescope and MiniMosaic imager on Kitt Peak on the nights of 2011 June 26-28 (UT).222The WIYN Observatory is a joint facility of the University of Wisconsin-Madison, Indiana University, the National Optical Astronomy Observatory and the University of Missouri. The so-called “Minimo” was mounted at the f/6.3 Nasmyth port and consisted of a pair of SITe chips, with a field 96 square at a scale of 014 pixel-1. We used interference filters that pass lines of H, [S II] 6716,6731, and [O III]5007, plus red and green narrow-band continuum filters so we could subtract the stars and produce pure emission-line images. Frames in each filter were dithered to enable automatic removal of cosmic rays and bad pixels. Further observational details are given in Table 1.
It is noteworthy that the H filter was quite narrow in bandwidth, 27 Å FWHM. Its transmission is 69% at the rest wavelength of H, but only 11% at 6548 Å and 16% at 6583 Å; hence, the [N II] lines are greatly attenuated relative to H.333The recessional velocity of NGC 6946 is only , so the lines are redshifted by Å. Also, lab measurements of the filters confirm only small shifts in centroids due to the f/6.3 beam. This facilitates identification of SNRs based on their image-derived [S II]:H ratios. Seeing throughout this run was about pc at the distance of NGC 6946. While sufficient for identifying SNRs in all but the most crowded regions, this resolution was insufficient for obtaining properties such as diameter or morphology.
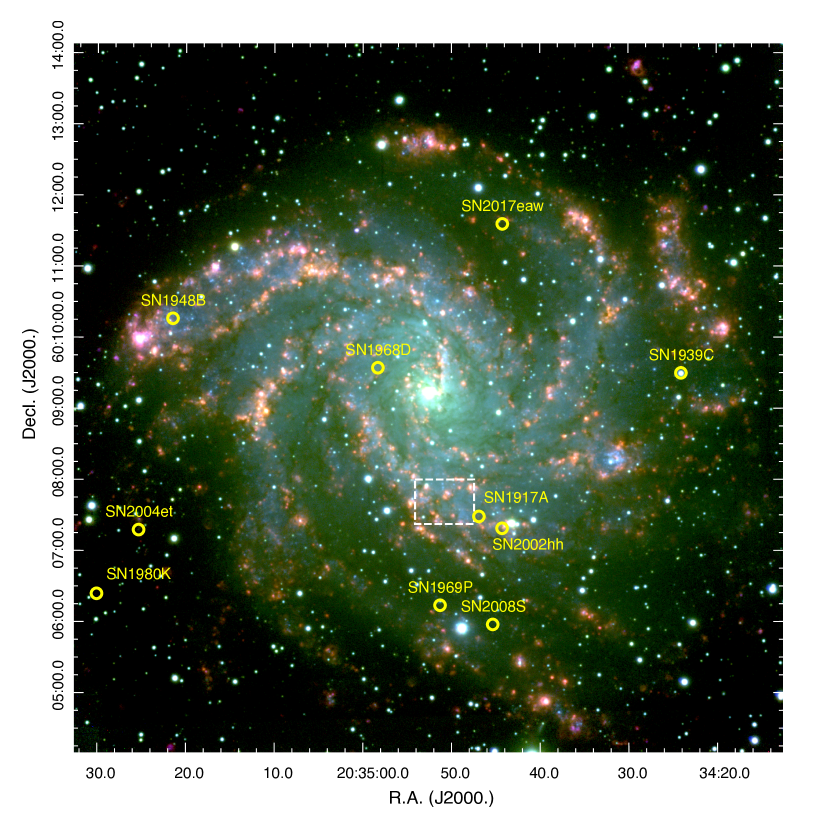
We used standard IRAF444IRAF is distributed by the National Optical Astronomy Observatory, which is operated by the Association of Universities for Research in Astronomy, Inc., under cooperative agreement with the National Science Foundation. techniques for processing the images, including overscan correction, bias subtraction, and flat-fielding using dome flats. Procedures in the IRAF mscred package were then used to combine the data from the individual chips into a mosaic image for each frame, assigned a WCS for each using stars from the USNOB1 catalog (Monet et al., 2003). We then stacked all the images by filter onto an arbitrary standard coordinate system with a scale of 020 pixel-1 and scaled and subtracted the continuum images from the emission-line ones (red from H and [S II]; green from [O III]) to give pure emission-line images with most of the stars and galaxy background light removed. Finally, we used observations of seven different spectrophotometric standard stars—all selected for their weak H absorption lines—from the catalog of Massey et al. (1988) to flux calibrate the emission-line images. Figure 1 shows a color version of the final images (R = H, G = [S II], B = [O III]), with the positions of historical SNe in NGC 6946 also indicated.
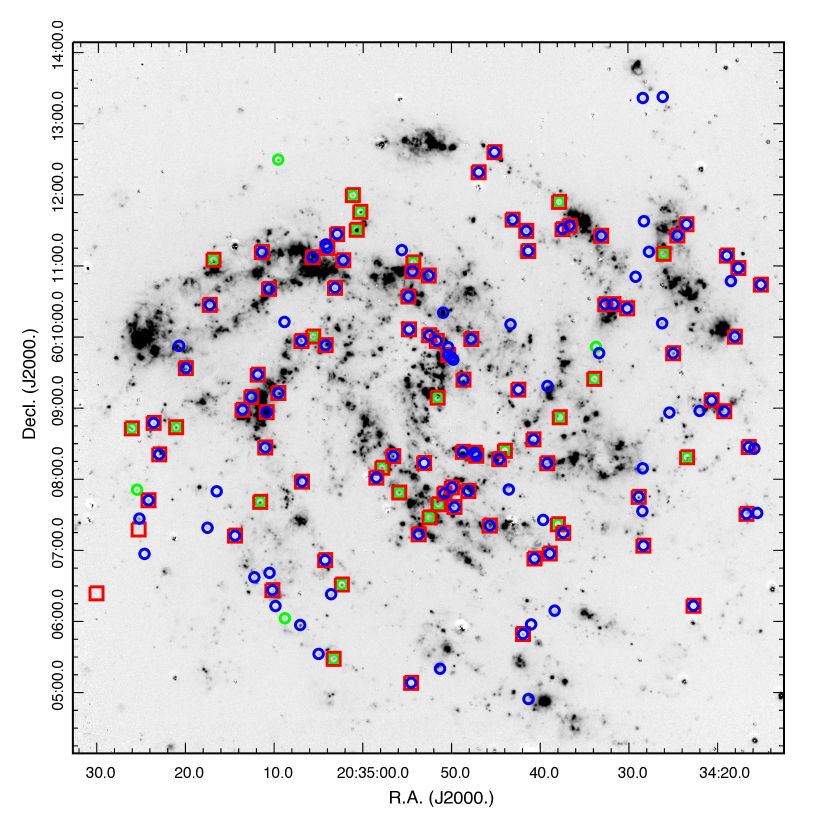
To select SNR candidates, we used the DS9 display program to show the continuum-subtracted WIYN images in all three emission lines as well as a [S II]:H ratio image and a continuum image (to discriminate stars or stellar subtraction residuals from point-like nebulae). We then visually inspected these to select SNR candidates based on a high [S II]:H ratio. The initial inspection was carried out by Middlebury undergraduate Marc DeLaney; subsequently two of us (WPB and PFW) compiled independent candidate lists; we then conferred to agree on a consensus list of 147 candidates, including the 27 from MF97. The positions of all 147 candidates are shown in Figure 2. The vast majority of the SNR candidates appear within the spiral arms or clustered on the outskirts of large complexes of H II emission and star formation.
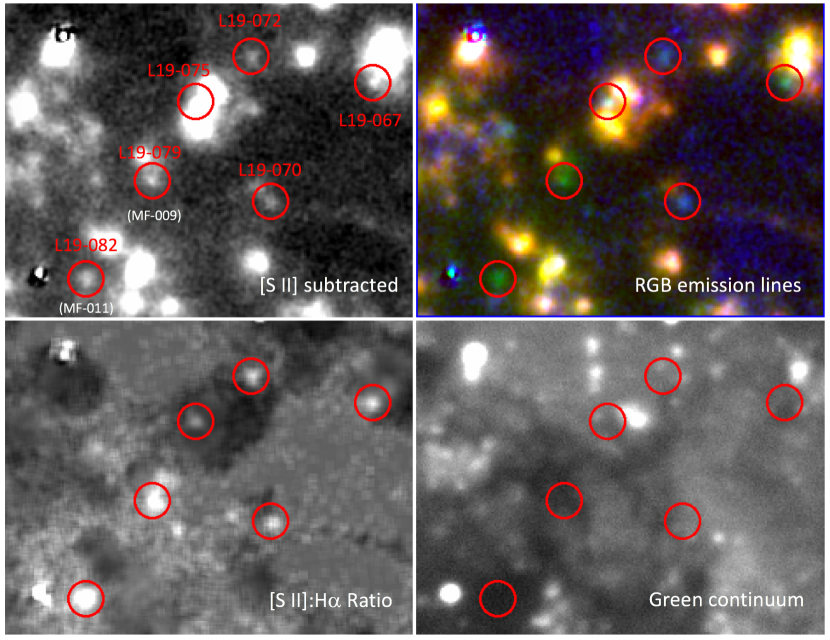
Figure 3 shows an example for a small region 1.5′ south of the nucleus (see Fig. 1) containing two of the MF97 objects and several new SNR candidates. In this example we have combined the three continuum-subtracted emission line images into a single color panel that shows how the stronger [S II] and/or [O III] emission from the SNR candidates makes them stand out. The [S II]:H ratio image was a key diagnostic for drawing our eyes to potential objects of interest. Then an assessment of the integrity of the candidate as an emission object was made by inspection of the actual images. This was done to separate candidates from stellar residuals or false regions of higher ratio in the ratio map that were due to moise.
Having performed similar SNR searches in other galaxies such as M33 and M83, it is worth noting some differences for NGC 6946. M33 is of course much closer, and the nebulae of interest are almost always resolved. M83 is much more distant (4.6 Mpc) than M33, but our search there was aided by the exceptional 0.5″ seeing conditions we obtained at the Magellan telescope (Blair et al., 2012). Many objects were resolved, but others extended down to the limits of what even HST could resolve (1-2 pc) (Blair et al., 2014). Our WIYN survey of NGC 6946 did not have exceptional seeing, and the distance is some 50% larger than for M83. Hence, relatively few of the nebulae of interest are resolved, and with variations in the complex galaxy background, it is much more difficult to perform a systematic search. The use of the [S II]:H ratio image was particularly helpful for NGC 6946, which is the most distant galaxy for which we have performed this kind of ground-based SNR survey. Nonetheless, while we have expanded the SNR candidate list very substantially, clearly completeness has not been achieved. Our list of 147 SNR candidates falls far short of M83 for example (with 300+), even though the SN rate is larger in NGC 6946. Higher resolution data (better seeing and/or HST imaging) would no doubt help substantially, but the greater distance for NGC 6946 is still a limiting factor.
In addition, we initially selected 51 emission nebulae with relatively high [O III]:H ratios (using an [O III]:H ratio image in the display). Most of these nebulae were expected to be H II regions but we hoped that one or more might be a young, ejecta-dominated SNR, simlar to Cas A in our Galaxy. With ten SNe in the last century and a high incidence of massive stars, one might expect a number of young, ejecta-dominated SNRs to be present. Though none of the O-selected candidates had ratios as extreme as seen for Cas A or 1E0102-72.3 in the Small Magellanic Cloud, we nevertheless selected some of them for follow-up spectroscopy. None of these nebulae for which we obtained spectra have any indication of ejecta in their spectra or the broad lines would expect from a very young SNR. All are H II regions with somewhat enhanced ionization state, and so these form the bulk of the H II sample we use for comparison with the SNR candidates sample below. Finally, we inspected the positions of the nine555As of the 2011 observations there were nine SNe; a tenth SN was recorded in 2017. historical SNe in NGC 6946 for evidence of nebular emission; we only detected line emission at the positions of SN1980K and SN2004et, both of which we targeted for follow-up spectroscopy. (See section 3.4 below.)
The SNR candidates are listed in Right Ascension order in Table 2. For each candidate, we provide (1) a source name, (2,3) the position (J2000), (4) the deprojected galactocentric distance (GCD), (5) the H flux as derived from the emission line images, (6) the [S II]:H ratio measured from the images, (7) the spectrum we used to confirm the imaging ratios (see below), (8) whether or not the object has a spectroscopic confirmation that the [S II]:H ratio is 0.4 (see below) and (9) other names for the source.
2.2 Spectroscopy; Emission-Line Fluxes
We used the Gemini Multi-Object Spectrograph (GMOS) on the 8.2m Gemini-North telescope to obtain all the spectra reported here, during queue-scheduled programs in semesters 2014B (program GN-2014B-Q-83) and 2015B (program GN-2015B-Q-91). For the 2014B program, we designed six custom masks, each with 20-30 slitlets targeting SNR candidates whose positions we determined from our 2011 WIYN images, together with short -band pre-images of several NGC 6946 fields taken with GMOS earlier in 2014 as part of the spectroscopy preparation program. We used two additional masks (which we refer to as masks 7 and 8 for simplicity) for the 2015B program. Slitlets in one or more of our eight masks were placed on 102 distinct SNR candidates, including ones with a range of sizes, GCDs, and ISM environments (locations in arms and in inter-arm regions). In addition to the SNR candidates, we also placed a number of slitlets on H II regions for comparison purposes in both 2014 and 2015.
We used the 600 line mm-1 grating designated G5307 and a GG455 cut-off filter to block second-order spectra. The detector in both years was a mosaic of three e2v deep-depletion CCD chips, binned by 2 in the spatial direction (for a scale of 0146 pixel-1) and by 4 in the dispersion direction. The dispersion was 1.84 Å pixel-1 (binned), resulting in coverage of the spectral range from at least H through [S II] 6716, 6731 for virtually all the objects.666The detailed wavelength coverage for individual objects naturally varied with slitlet position on the mask in the dispersion direction. Our masks had slitlet widths from 125 to 175, with wider slits used for the larger objects, and lengths of 6″ or longer to permit local background and sky subtraction.
With each mask, we took spectra at three or four slightly different grating tilts, to cover wavelength gaps between chips and to gain somewhat more total spectral range.777An exception was mask 6, done late in the 2014B semester, for which our full set of planned observations were never completed. At each wavelength setting, we obtained two or more identical exposures to minimize the effects of cosmic rays. For calibration, we programmed quartz flats and CuAr arc frames immediately before or after the science exposures with each mask and grating setting. A journal of all the science observations from both 2014 and 2015 appears in Table 3. The SNR candidates for which we obtained spectra are indicated by the small red boxes in Fig. 2.
The data were processed using standard procedures from the gemini package in IRAF for bias subtraction, flat-fielding, wavelength calibration, and combination of spectra with different grating tilts to provide the final results. Flux calibration was based on baseline GMOS observations of a few spectrophotometric standard stars, carried out in the same semester as part of standard GMOS operations.
During the processing, the 2-D spectra from different slitlets were separated to give individual 2-D spectra from each slitlet. We examined each of these individually and selected the object region, as well as one or more sky background regions, stripped out 1-D spectra of each, and then subtracted the sky spectrum from the corresponding object to obtain the final background-subtracted object spectra. Many of the objects are located in regions with bright surrounding galactic background (both continuum and emission lines) from NGC 6946, so the selection of a representative local background was done on a best-effort basis. In addition to the targeted SNR candidates and H II regions, we extracted spectra from other H II regions which appeared by chance in the slits when this was possible. This allowed us to increase our sample of H II regions from 24 to 65. We then performed fits to obtain emission line fluxes from the spectra, assuming Gaussian profiles, for the following lines and line complexes: H alone, the [O III] doublet, the [O I] doublet, the H-[N II] region, and the [S II] doublet. For the fits, we assumed that the background varied linearly with wavelength around each line, and that the FWHM of all lines in each complex was the same.
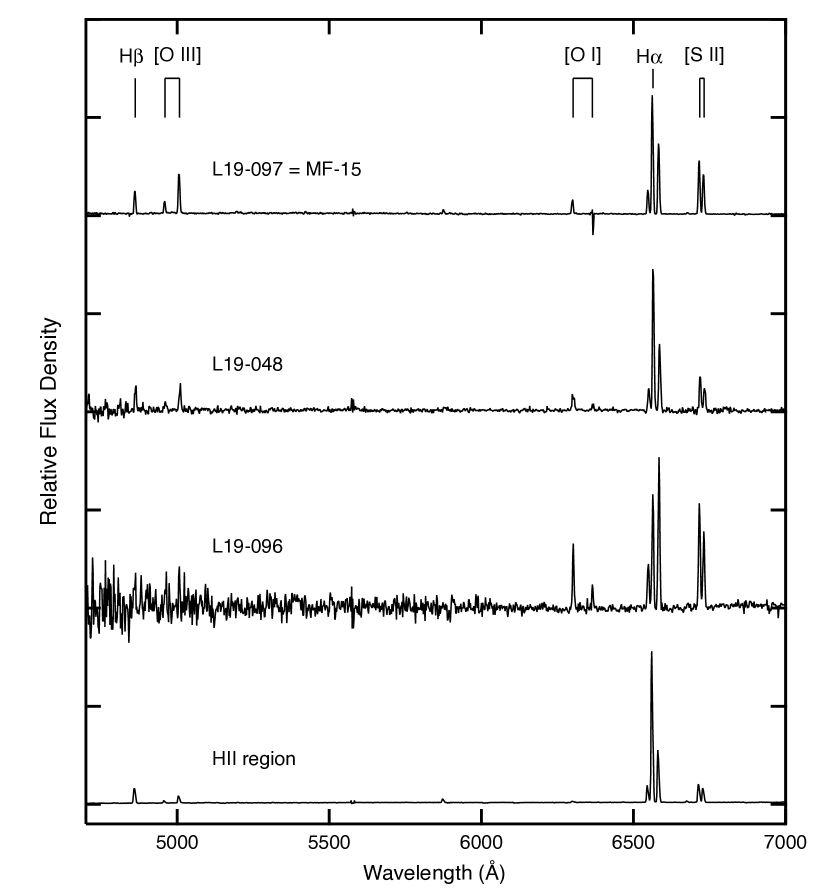
Representative examples of the spectra that were obtained are shown in Fig. 4. The three SNRs were selected primarily to show how the quality of the spectra changes as a function of brightness. The spectroscopically obtained [S II]:H ratio for L19-048 was 0.45, just above the value for spectroscopic confirmation, while those for the previously known bright object L19-097=MF-15 and the faint candidate L19-096 are higher. All three SNR candidates show evidence of emission from [O I], which is another indicator that the emission we see arises from shock-heated gas.
Table 4 lists the information we obtained for the SNR candidates for which we obtained spectra. Specifically we list (1) the source name, (2) the extracted H flux, (3-9) ratios of various emission lines to H [taken to be 300], (10) the total [S II]:H ratio and (11) the measured FWHM of the lines in the H-[N II] complex. For doublets, where the line ratio is constrained by atomic physics, that is [O III], [O I], and [N II], we have listed only the stronger line. We visually inspected all of the spectra and the fits to them; values which we judge to be more uncertain are indicated with tildes in the Table. No allowance has been made for additional errors associated with difficulties in background subtraction. A number of the objects were observed with more than one mask, sometimes with different slit orientations. In these cases, we used the spectrum which we judged to be the most accurate and report it for reference in the ‘Spectrum’ column in Table 2, where (for example) 05.18 should be interpreted as ‘mask 5 slitlet number 18.’
3 Analysis and Discussion
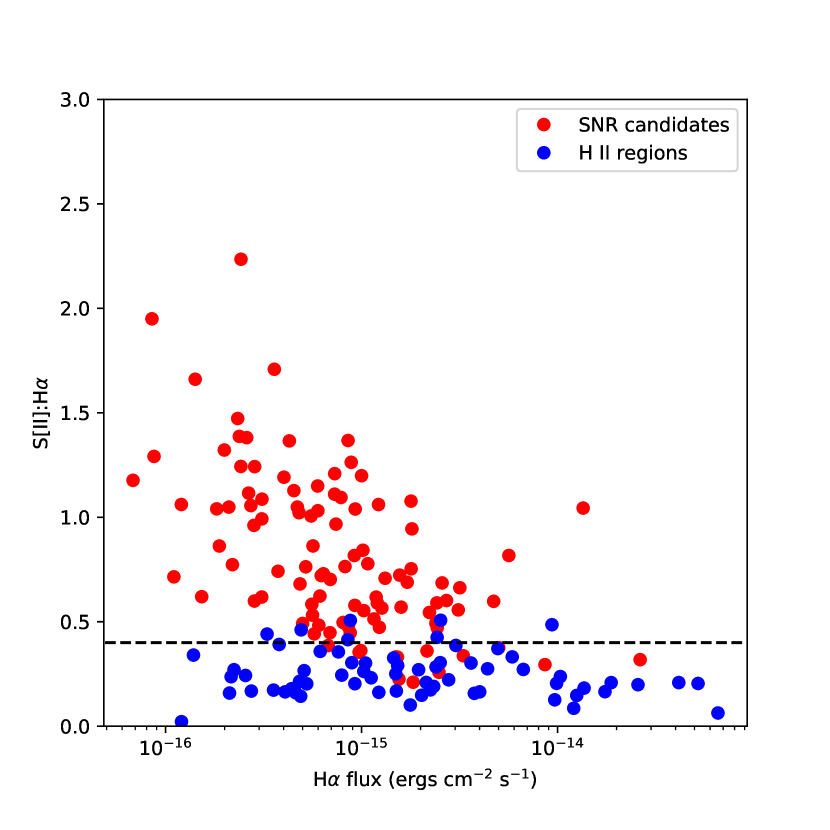
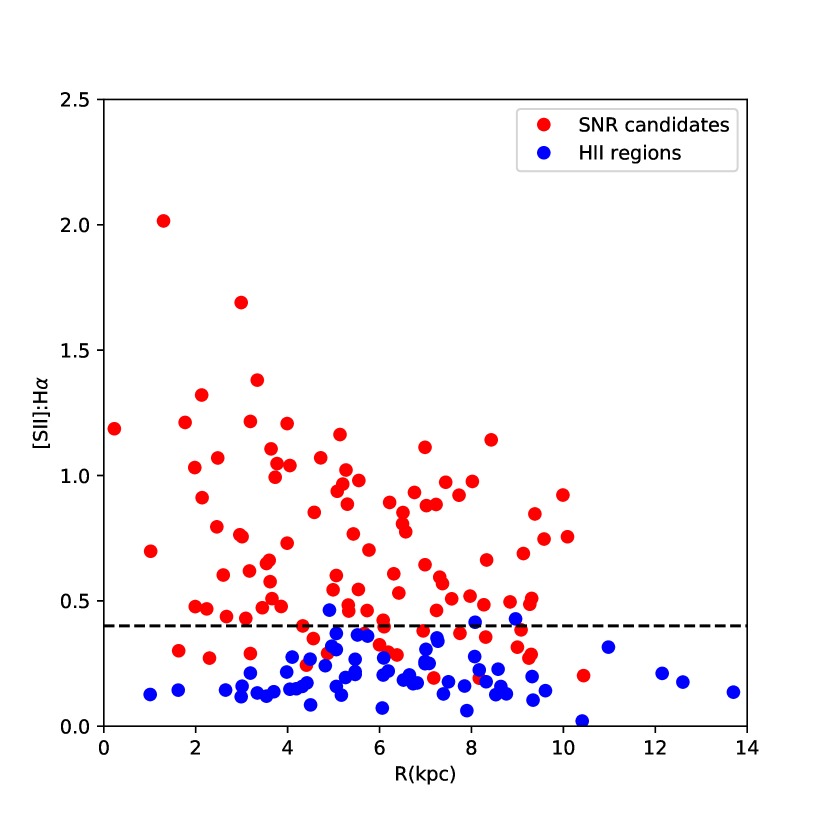
Of the 147 candidate SNRs from the WIYN interference images, we obtained spectra of 102. The spectra were needed to improve our confidence that the [S II]:H ratios of the emission nebulae were indeed high and to begin to characterize the SNRs using accurate line ratios. The spectroscopic ratios are shown as a function of H flux in the left panel of Fig. 5. H II regions, including both those selected for their [O III] emission and those that appeared serendipitously along spectral slits, are shown in blue, while nominal [S II]:H candidates from imaging are shown in red. Conventionally, emission nebulae are identified as SNRs optically if the [S II]:H ratio exceeds 0.4; 89 of the 102 SNRs with spectra satisfy this criterion, and so we regard these as confirmed SNRs (and they have been listed as such in Table 2).
Clearly, given uncertainties in derived line ratios for faint emission line objects, a dividing line of 0.4 is somewhat arbitrary, and objects just above (or just below) this ratio should be judged with more context. For example, slightly under-subtracting contaminating H emission in the spectra could readily explain why some candidates ended up below the threshold in the spectroscopic analysis. We have inspected the objects listed with imaging ratios above the threshold and spectral ratios below, and indeed, many of them are located in regions of H II contamination. Likewise, a slight over-subtraction of H could enhance the [S II]:H ratio derived, potentially pushing some objects above the threshold. This is likely the reason why some of the faint H II regions observed spectroscopically actually lie above the 0.4 threshold. The observed tendency to see higher [S II]:H ratios closer to the nucleus is likely to be at least partly an abundance effect; similar trends are seen in M33 (Long et al., 2018) and in M83 (Winkler et al., 2017).
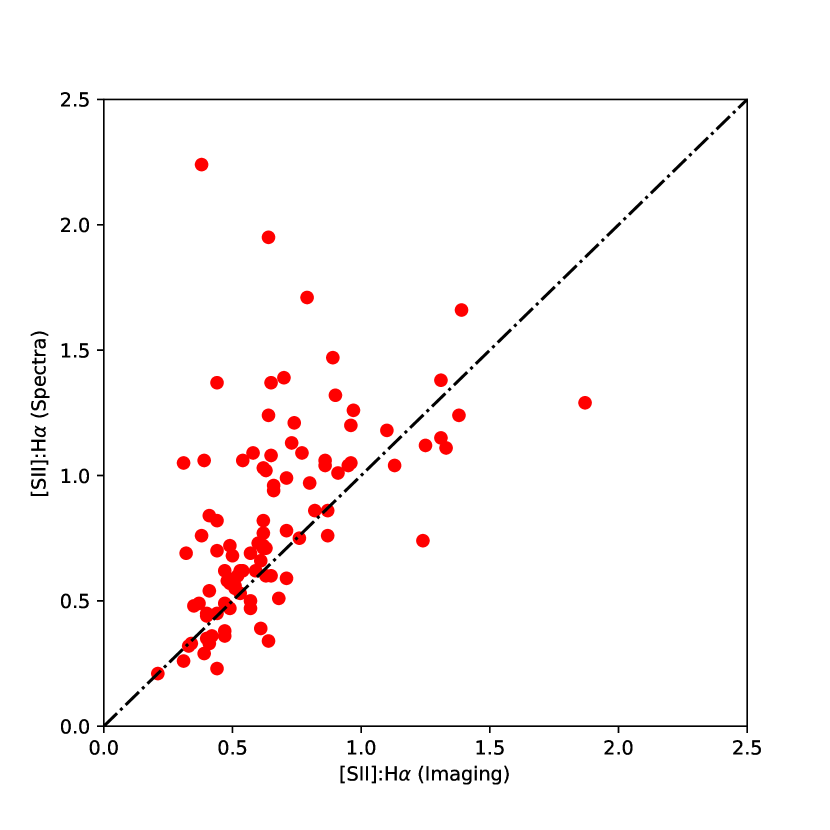
There are 45 objects without spectra, so which of these are actually SNRs is uncertain. Given the generally good agreement between imaging and spectral ratios, those objects with imaging ratios well in excess of 0.4 are likely to be good candidates. As shown in the right panel of Fig. 5, if anything the spectroscopically-determined ratios tend to be higher than the ratios determined from narrow band imaging, and so most of the objects without spectra are likely to be SNRs. The somewhat higher spectroscopic ratios are to be expected, since even with our relatively narrow H filter, some emission from [N II] was also passed.
3.1 Comparison to MF97
MF97 identified 27 SNR candidates in NGC 6946. All of these objects have [S II]:H ratios in our WIYN images that exceed 0.4. MF97 obtained spectra of six of their candidates. We have obtained spectra of 23 of the MF97 objects, including new spectra of four objects for which MF97 had spectra – MF-03, MF-21, MF-22, and MF-26. All of these indeed have measured spectroscopic ratios that exceed 0.4. We note that MF97 used a relatively conservative value of [S II]:H 0.45 to establish their catalog (to avoid the issue of errors in the determined ratio affecting objects just above or below the normal 0.4 criterion). Hence, it is perhaps not surprising that the previous objects are strongly confirmed here. MF97 report “typical 1.5″ seeing” for their work. (MF97 looked at a number of galaxies and they do not give a specific value of seeing for NGC 6946.) Hence, it is also clear that MF97 were only able to find a combination of objects that were relatively bright (so not smeared out by seeing) and/or were relatively isolated from contaminating emission. They estimated that at least four times as many SNRs were likely present in NGC 6946, and our current survey has far surpassed that estimate.
Even though we have identified many more candidates than MF97, it is clear that with its better seeing and higher sensitivity, our survey is still limited and likely to be significantly incomplete. For example, Fig. 3 shows two objects, L19-067 and L19-075, both in close proximity to H II contamination, that we were able to identify as candidates while MF97 could not. However, it is not hard to imagine any number of additional objects in the many even more confused emission regions that our survey would have missed.
The object MF-16, listed here as L19-098, deserves separate mention as it is far and away the brightest object in our catalog. Originally thought to be a possible example of an exceedingly bright (and possibly multiple) SNR (Blair & Fesen, 1994; Blair et al., 2001), similar to the extraordinary SNR in NGC 4449 (Blair et al., 1983; Milisavljevic & Fesen, 2008), X-ray variability was subsequently established that clearly indicates the presence of an accreting black hole binary within the nebular complex (Roberts & Colbert, 2003; Fridriksson et al., 2008; Rao et al., 2010). Most recent analyses (Kaaret et al., 2010; Berghea & Dudik, 2012) model the system based on the ULX binary only, but clearly the system involves some combination of shock-heated and X-ray photoionized emission. Dunne et al. (2000) show resolved line profiles on the bright emission lines indicating kinematic motions of order 250 – 400 , and while Roberts & Colbert (2003) show the bulk of the X-ray emission is likely due to the ULX, they estimate the SNR component could be as bright as in X-ray, which is quite substantial for a SNR. Although jets are often invoked for accreting ULX binaries, the HST images of the nebula (Blair et al., 2001) are not obviously consistent with this idea; the morphology shows a multiple loop structure, and the likely optical counterpart of the ULX is not centered in the smallest, brightest loop. Hence, the idea that the complex involves something more complicated than a single SN that created the ULX binary may still be relevant to consider in understanding the overall characteristics of this intriguing object.
3.2 Global Spectroscopic Properties of the SNR Candidates
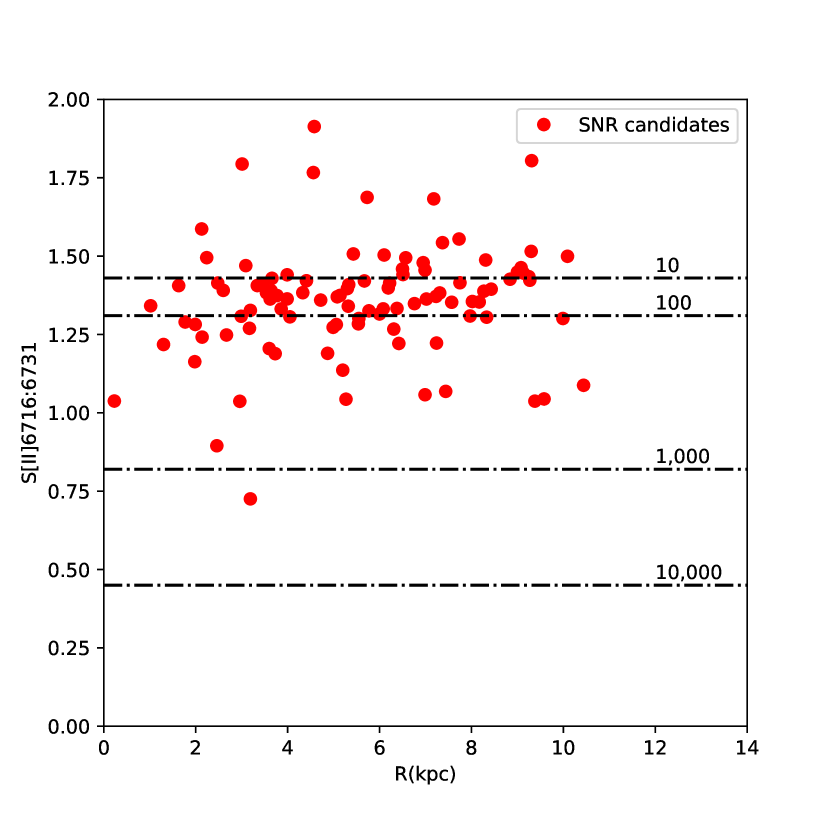
As shown in Fig. 6, the density-sensitive [S II] ratio 6716:6731 clusters around the low-density limit of 1.4 for the SNR candidates, and the fact that about as many objects have non-physical ratios above 1.4 as below suggests that a) the ratios for some faint objects have significant errors (not unexpected), and b) likely almost all the objects are close to this limit. This is in contrast to the situation in M83 (Winkler et al., 2017) and to a lesser extent in M33 (L18) where a significant number of the SNRs show evidence of high densities, especially for smaller diameter objects. In the absence of good SNR diameters here, we cannot search for trends with diameter, but upcoming Hubble Space Telescope observations should provide accurate diameter information for many of these objects. These HST images could also reveal the presence of very small SNR candidates, perhaps with high densities, which eluded detection in our ground-based images.
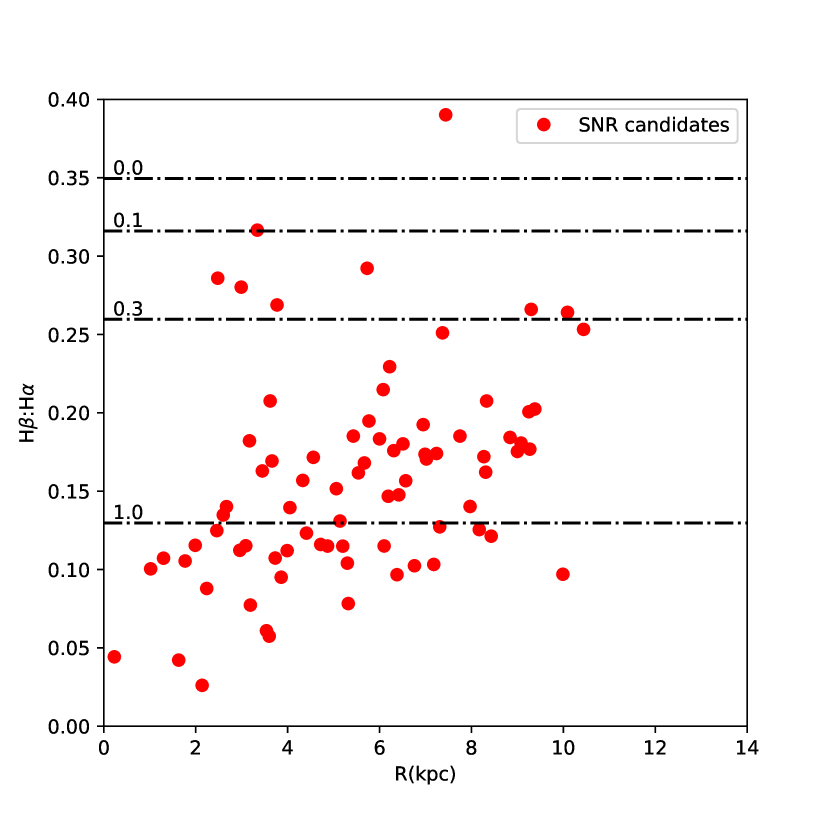
Fig. 7 shows the observed H:H ratios of the SNR candidates with spectra as a function of GCD. Nearly all of the SNRs show significant reddening, as one would expect since, at 12° from the Galactic plane, foreground reddening from within our Galaxy along the line of sight is expected to be (Schlafly & Finkbeiner, 2011). There is clearly substantial internal and differential reddening within NGC 6946 as well, as there is a very evident trend for objects near the center of NGC 6946 to be more reddened than those more distant from the nucleus.
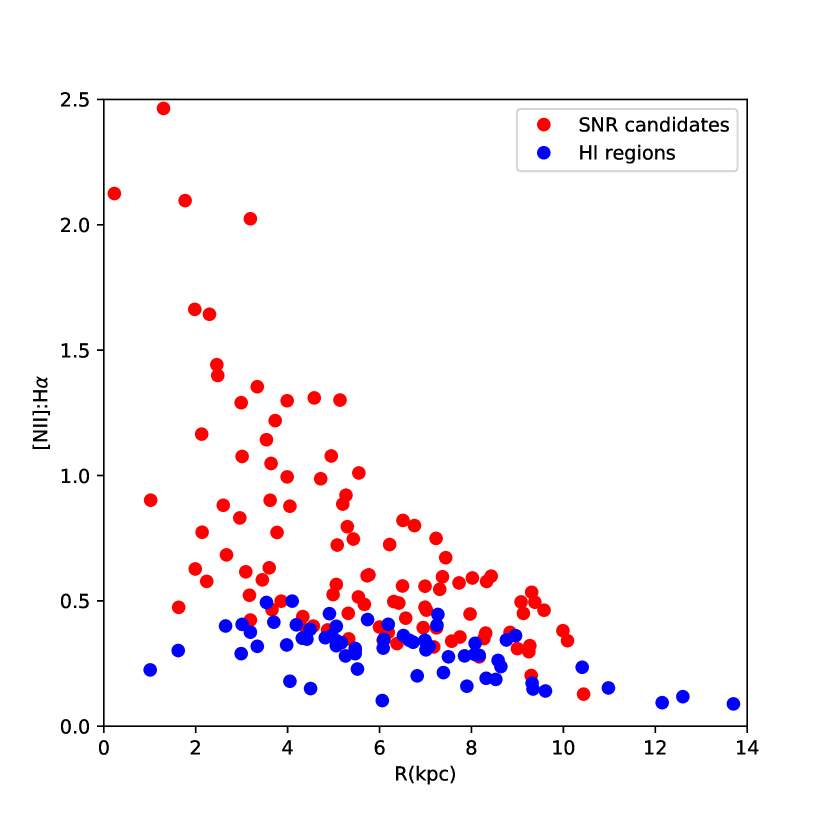
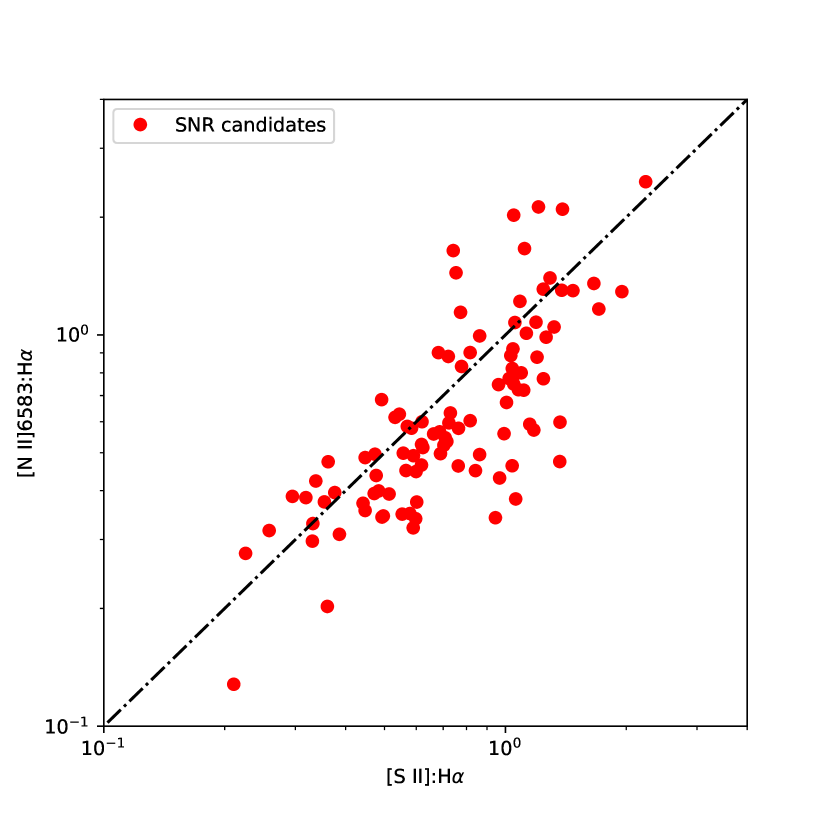
Our SNR line ratios show a general decrease with increasing GCD as seen in Fig. 8, although the dispersion at any particular GCD distance is large. The trend could well be indicative of abundance gradients in nitrogen and sulfur, with the dispersion being due to varying shock conditions and/or or local abundance variations. However, the trend stands in contrast to SNRs in M33, where both the [N II]:H and [S II]:H ratios have a large range and do not decrease systematically with increasing GCD (although the line ratios in the H II region sample appear well behaved—see L18 Fig. 8). There is a good correlation between the [N II]:H and [S II]:H ratios of the various objects, as shown in Fig. 9, as also seen in other galaxy samples (cf. Winkler et al. 2017, Fig. 9).
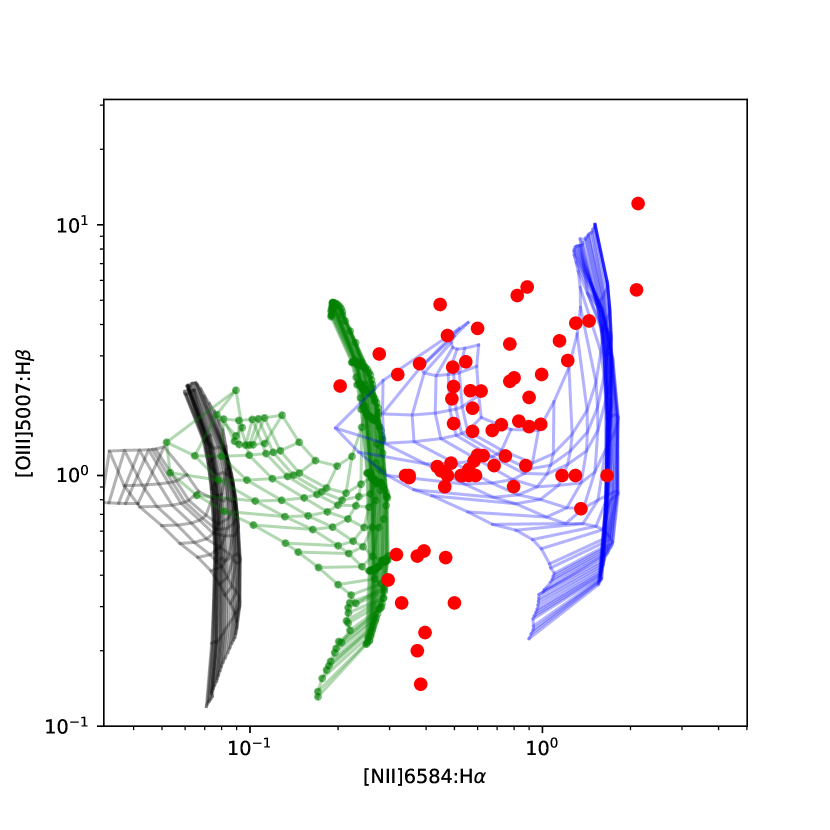
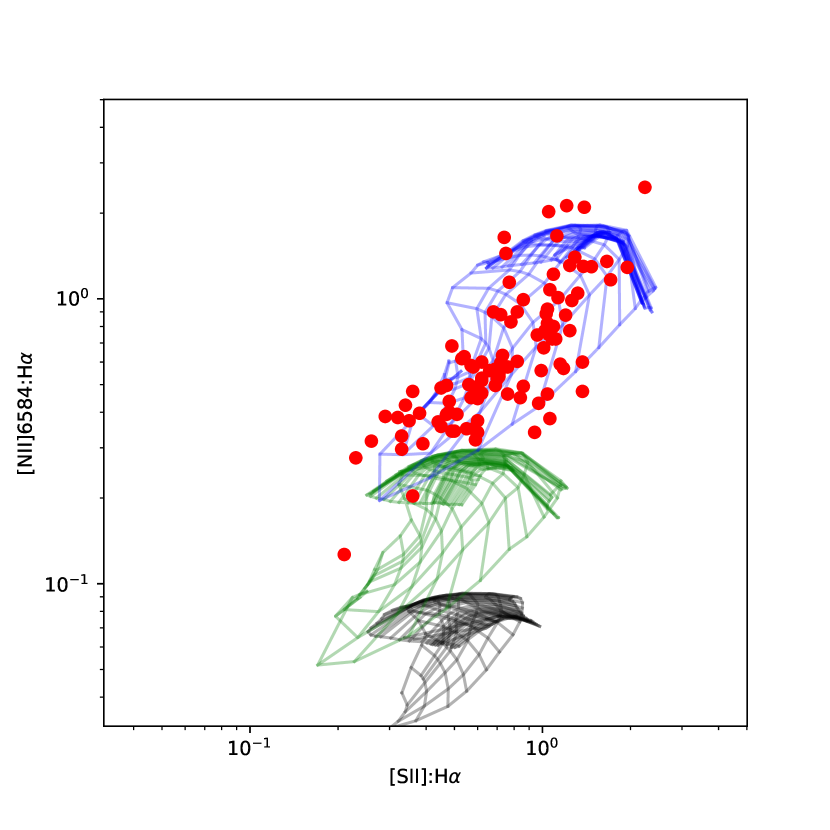
Line ratios in SNR spectra are expected to vary both as a function of shock conditions and metallicity. To see where the SNRs in NGC 6946 lie, we have compared the line ratios calculated from models by Allen et al. (2008) using the MAPPINGS III code for a range of shock velocities (100 - 1000 ) and pre-shock magnetic fields (10-4 - 10 G). The results are shown in Fig. 10. The results both for the ratio of [O III] 5007:H and for [S II]:H fall squarely into the region of the solar metallicity models. This is consistent with expectations for previous abundance studies of NGC 6946 such as Cedrés et al. (2012), Gusev et al. (2013), and references therein, depending of course on the adopted method of determining H II region abundances from strong-line data only. Both of these papers also show a very modest abundance gradient in the H II regions of NGC 6946, with considerable scatter about the mean, although very few H II regions are sampled in the inner portion of the galaxy (cf. Cedrés et al. Fig. 18).
3.3 SNRs in Other Wavelength Bands
Searches for SNRs in NGC 6946 have been carried out in several other wavelength ranges. In particular, Lacey & Duric (2001) identified 35 radio sources as SNR candidates on the criterion that these sources had non-thermal spectral indices and were positionally coincident with H emission. These objects are located mostly in the spiral arms of NGC 6946 where there is active star formation and where one might expect SNe to explode. There are seven emission nebulae in our list of SNR candidates that lie within 2″ of radio SNR candidates; this is five more than had been identified previously, but a small fraction of the total number of radio objects. Lacey & Duric (2001) argued that the reason that few radio SNRs are detected optically is that the bright H emission from H II regions makes optical searches for SNRs less sensitive in the spiral arms than in the rest of the galaxy. The fact that more of the optical SNRs are not detected at radio wavelengths is most likely a question of sensitivity. All of the SNR candidates identified by Lacey & Duric (2001) have radio luminosities of at least one-tenth of Cas A, much greater than the bulk of SNRs known in the Galaxy. By contrast, in M33, where White et al. (2019) have recently conducted a very deep radio survey with the Jansky Very Large Array, more than three-quarters of the optically identified SNRs have been detected at radio wavelengths.
An alternative diagnostic (to the [S II]:H ratio) for identifying SNRs in at least some external galaxies is emission in the [Fe II] 1.64 m line. Since Fe+ is so easily ionized further, H II regions are expected to have little if any [Fe II] while [Fe II] should, like [S II], be elevated in the cooling tail behind SNR shocks. Hence, detection of an emission nebula with [Fe II] is a strong indication of shock heating. In M83, where HST WFC3 IR imaging in [Fe II] is available (Blair et al., 2014), about 40% of the optical SNRs in the observed region were detected in [Fe II], and a handful of compact [Fe II] nebulae in particularly dusty regions are strong SNR candidates whose emission is too highly absorbed to be detected optically. This raises the possibility that [Fe II] might be valuable not only to help confirm optical SNR candidates, but also to help to obtain a more complete sample in heavily reddened regions.
In NGC 6946, Bruursema et al. (2014) carried out ground-based interference filter imagery in the light of [Fe II] 1.64 m. Ground-based [Fe II] imaging is difficult due to sky contamination, as noted by Bruursema et al. (2014), but they were able to identify 48 candidate objects that they felt were above the noise. Interestingly, only three of these objects align with SNR candidates in our sample: L19-076, L19-095=MF-14, and the exceedingly bright ULX MF-16 = L19-098 (discussed above). We are thus left wondering whether the other [Fe II] objects are possible SNR candidates or whether the data quality issues are responsible for the large difference between NGC 6946 and M83. We can say, however, that the bulk of the Bruursema et al. (2014) candidates are not seen in projection onto the dustiest regions. M33, for which Morel et al. (2002) clearly detected a solid handful of optical SNRs in ground-based [Fe II] observations, appears to be intermediate between the extremes of NGC 6946 and M83. High spatial resolution HST WFC3 IR observations would make a large impact in clarifying the situation for a galaxy as distant and as highly absorbed as NGC 6946.
SNRs are also X-ray sources, and therefore we have looked to see how many X-ray sources in NGC 6946 could be found in our candidate lists. The most detailed X-ray study of NGC 6946 to date was carried out using Chandra by Fridriksson et al. (2008), who constructed a catalog of 90 point sources, of which 25 appeared to be time variable (and hence likely X-ray binaries or background AGN). Of the 90 point sources, there are eight which are positionally coincident with objects in our sample. X-ray hardness ratios reported by Fridriksson et al. (2008) show that most of these have relatively soft X-ray spectra, consistent what is expected for thermal emission from a SNR. The main exception is F08-08, coincident with L19-029, which has a hardness ratio that is more typical of X-ray binaries and background galaxies. Not surprisingly, one of the X-ray sources coincident with L19 objects is the ULX L19-098 = MF-16. These two are also the only X-ray sources coincident with SNR candidates that also show evidence of (long-term) variability, according to Fridriksson et al. (2008).
Higher percentages of the optically identified sources have been X-ray-detected in M33 (112/200, Long et al., 2018) and M83 (67/225, Long et al., 2014). Of these, M83 is the more relevant for comparison. M83, a nearly face-on grand-design spiral, has a star formation rate of 3-4 (Boissier et al., 2005), similar to NGC 6946, but lies a distance of 4.61 Mpc (Sahu et al., 2006) compared to 6.7 Mpc for NGC 6946. M83 was observed for 725 ks with Chandra, compared to a total of about 175 ks for NGC 6946. In addition, NGC 6946 is relatively close to the Galactic plane and as a result foreground absorption reduces the X-ray sensitivity, particular below 1 keV. Indeed, the hydrogen column density along the line of sight to M83 is , whereas for NGC 6946 it is (Kalberla et al., 2005). For a thermal plasma with an effective temperature of 0.6 keV, the combination of greater distance and higher absorption implies that a typical SNR in NGC 6946 would have only about 1/3 the count rate of one in M83. Consequently, it is not surprising that we have detected fewer SNRs in X-rays in NGC 6946 than in M83.
4 Historical Supernovae in NGC 6946
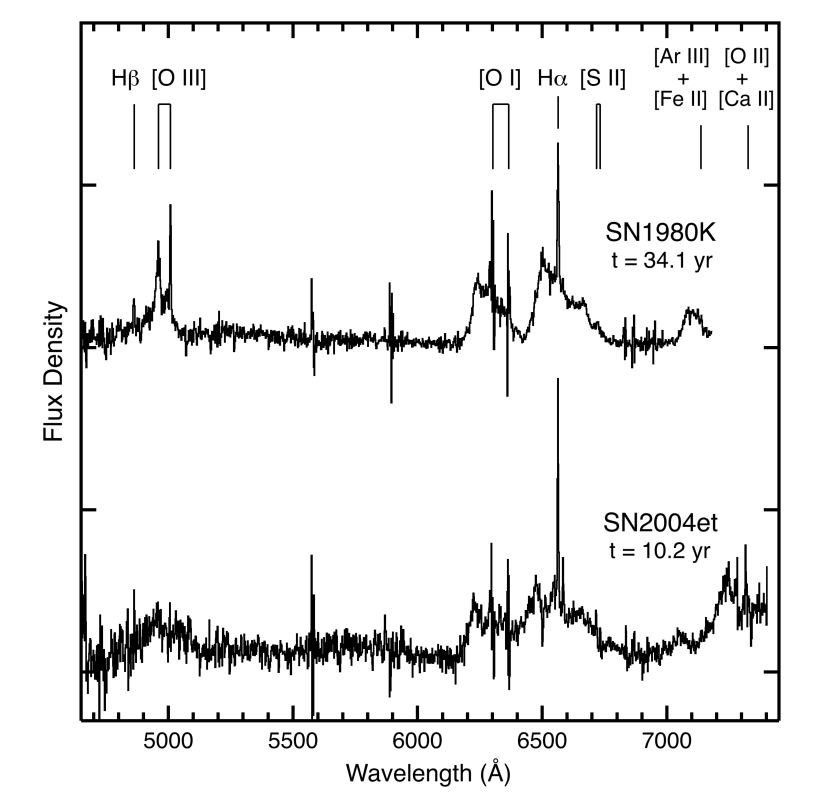
In our 2011 WIYN emission-line images, we also searched for emission at the positions of all of the nine historical SNe that had occurred in NGC 6946 at the time of our observations. We detected emission from only two of these: SN 1980K and SN 2004et. Both would probably have been among our [S II]-selected SNR candidates, and SN 1980K would also have attracted notice because of its relatively high [O III]:H ratio as well; however, we noted these in an explicit search of the positions of all the historical SNe in NGC 6946. Thus, we have not included them in Tables 2 or 4. We obtained GMOS spectra of both, as shown in Fig. 11. Unlike the spectra from the other SNRs in our sample, the lines from both of these are highly velocity-broadened, the signature of fast shock waves in these young SN-SNR transition objects and fast-moving ejecta.
The Type IIL SN 1980K has been frequently observed over the years since its explosion, and its transition from late-time SN to a developing SNR has been monitored both photometrically and spectroscopically (e.g., Uomoto & Kirshner, 1986; Fesen & Becker, 1990; Fesen & Matonick, 1994; Fesen et al., 1999; Milisavljevic et al., 2012). Our 2014 GMOS spectrum, taken 3 December 2014—about 34 yr past maximum light, is qualitatively similar to the 30 yr spectrum shown by Milisavljevic et al. (2012), with broad, asymmetric lines—stronger on the blue side than the red—from H, [O I], [O III], and a feature near 7100 Å that is probably [Fe II] 7155, possibly blended with [Ar III] 7136, all appearing above a faint, blue continuum (see Fesen & Matonick, 1994, for a discussion of the 7100 Å feature). It appears that broad [S II] with a similar asymmetric profile may also be present, blended with the red side of the H line. We estimate that the broad H flux is , slightly lower than that of reported by Milisavljevic et al. (2012) for their spectrum taken in October 2010, just over four years earlier. This continues the gradual decline they noted from that of measured by Fesen et al. (1999) in November 1997, which in turn represented a fading of from the levels observed in the early 1990s. A similar fading of broad lines with time has been observed in M83 for SN 1957D (Long et al., 2012).
SN 2004et, classified as Type IIP, was also well observed early on and as it made the transition to its nebular stage (e.g., Sahu et al., 2006; Maguire et al., 2010; Jerkstrand et al., 2012). The latest-time published spectra are by Kotak et al. (2009), which extend the observations to just over 3 years post-explosion. The spectrum in Fig. 11 shows its recovery at an age of just over 10 years. The most prominent feature is a very broad, asymmetric blend of H, [O I], and possibly [S II] and/or [N II]. Kotak et al. (2009) observed a similar “box-like” feature in spectra taken at 2.6 and 3.1 yr post-explosion, and they measured a full width at zero intensity of in the spectrum at 3.1 yr. The overall width in our 10.2 yr spectrum is similar or slightly broader, though it is not clear what physical significance to attach to this, since the feature results from blended lines. Despite the blending, both the H and [O I] contributions appear stronger on the blue side than the red, as in the case of SN 1980K. Kotak et al. (2009) also note the presence of a narrow H component. Such a component is also present in our spectrum, (Fig. 11); however, the two-dimensional spectrum from which the 1-D one was extracted shows this narrow H extending well beyond the broad components in the spatial direction, hence it is not clear that it is associated with SN 2004et itself.
Also present in our spectrum is a fainter broad feature that is almost certainly [O III], and a strong feature at 7150 - 7400 Å that is probably a blend of (primarily) [Fe II] and [Ca II] , features that were prominent in its late nebular spectra (Sahu et al., 2006; Maguire et al., 2010). [O II] may also be included in this blend. (Unfortunately, this feature extends beyond the red end of our spectrum, making it harder to identify, but it is also present in the late Kotak et al. spectra, with a profile similar to the H/[O I] feature.) The H line flux is difficult to measure because it is so broad as to to be blended with [O I] and, possibly, [S II]; furthermore, the continuum level is also uncertain. Our best flux estimate for H is . Estimating the flux at 3.1 yr from Fig. 4 of Kotak et al. (2009), the H flux at age 3.1 yr was , so it appears to have faded very slightly over the intervening seven years.
The broad, asymmetric line profiles of both these SNe, stronger on the blue side than the red, are typical of the optical emission from other decades-old core-collapse SNe. Milisavljevic et al. (2012) show several examples, and attribute the emission to the interaction between fast SN ejecta and the circumstellar shell from the progenitor star, as did Kotak et al. (2009) for SN 2004et. The predominence of blue-shifted over red-shifted emission may well result from the early formation of dust in cooling ejecta, resulting in greater absorption of emission from the far side of the expanding shell as it tries to make its way through the newly formed dust (Milisavljevic et al., 2012, and references therein).
The spectra of both SN 1980K and SN 2004et are also quite similar to the object B12-174a identified in our similar survey of M83 (Blair et al., 2015). The main difference is that for B12-174a the SN was not observed, even though its inferred age is 100 years. All these objects form a transitional class between “old SNe” and mature SNRs. SN1957D in M83 also shows broad lines, but only for oxygen, and the line intensities have dropped significantly over 40 years (Long et al., 2012, and references therein). These differences may be due to differing progenitor types, differing local ISM conditions, or both. (The [O III] lines would appear relatively stronger in both SN 1980K and SN 2004et if these were dereddened, with , Fesen et al., 1999; Sahu et al., 2006, but even so they would not be nearly so O-dominated as SN 1957D.) Since there are so few objects in this transitional class, these objects bear watching for temporal changes that should happen on observable time scales. Such observations could illuminate this poorly understood phase of SNR evolution.
The fact that none of the other seven historical SNe in NGC 6946, ranging in age from 3 to 94 years, were detected is noteworthy. All those with well-determined SN classifications are ones that result from core-collapse SNe, and thus should have produced several of high-velocity ejecta—the scenario responsible for ejecta-dominated SNRs like Cas A, or SN 1957D in M83. Furthermore, since NGC 6946 is such a champion producer of SNe, it is reasonable to expect the remnants from dozens of core-collapse SNe younger than 1000 yr to be located there. The fact that so few are detected as broad-line, ejecta-dominated remnants is similar to the case of M83, host to six SNe in the past century (or seven if we include B12-174a) and hence also expected to have far more young SNRs than are detected. Winkler et al. (2017) concluded that many of the SNRs are likely expanding into high-density environments, where remnants evolve rapidly to the point that they are dominated by swept-up material rather than by ejecta. At the other extreme, other SNe may have exploded in regions where earlier SNRs have evacuated the surrounding region, resulting in extremely faint SNRs. It would seem that the situation is similar in NGC 6946.
5 Summary
We have carried out a new optical search for SNRs in NGC 6946 using interference filters to identify emission nebulae that have elevated [S II]:H ratios compared to H II regions. We recovered all of the SNRs that had been identified by MF97. Of the 147 SNR candidates we identified, we obtained spectra of 102, and spectroscopically confirmed 89 these based on elevated [S II]:H ratios. There are 45 candidates without spectra and 17 candidates with spectra that show spectroscopic [S II]:H ratios less than the canonical value of 0.4 for regarding an emission nebula as a confirmed optical SNR; many of these are in regions of H II contamination that complicates spectral extraction. Given the uncertainties, we have chosen to retain all 147 objects as SNR candidates, though only those 89 with high ratios can be regarded as confirmed.
Very few of the candidates are detected as SNRs at other wavelengths. Only seven are among the 35 radio SNRs identified by Lacey & Duric (2001), most likely due to the limited sensitivity of the radio survey. Similarly only eight candidates have X-ray counterparts, which we attribute to a combination of higher absorption along the line of sight to NGC 6946 compared to some other galaxies at comparable distances, e.g. M83, and to the lower exposure times for the Chandra study of NGC 6946 than for these other galaxies.
We also inspected our images for evidence of emission at the sites of historical SNe in NGC 6946 and obtained spectra of the only two for which emission was apparent: SN 1980K and SN 2004et. Both show the broad, asymmetric lines that are typical of very young SNRs, possibly caused by the interaction between fast SN ejecta and circumstellar shells from the progenitors to these core-collapse SNe. Newly formed dust in cooling ejecta could then absorb light from the far side to produce the asymmetric profiles. Although SN1980K is well-known as one of an unusual group of SNe that continue to be observable long after its explosion, the most recent (published) spectrum of SN2004et was taken 3.1 years after its outburst (Kotak et al., 2009). Our spectrum indicates that this object is still strongly interacting with circumstellar material to produce optical emission 10+ years after the explosion.
Much more work is needed to fully characterize the SNR population of NGC 6946, some of which we are currently working on. These include HST studies in the optical to measure diameters and identify additional small diameter objects in crowded regions, infrared [Fe II] 1.64 m studies to identify SNRs in dusty regions or buried in complex H emission, and deeper radio studies to find and characterize the radio counterparts of the optical SNR population.
References
- Allen et al. (2008) Allen, M. G., Groves, B. A., Dopita, M. A., Sutherland, R. S., & Kewley, L. J. 2008, ApJS, 178, 20
- Astropy Collaboration et al. (2013) Astropy Collaboration, Robitaille, T. P., Tollerud, E. J., et al. 2013, A&A, 558, A33
- Berghea & Dudik (2012) Berghea, C. T., & Dudik, R. P. 2012, ApJ, 751, 104
- Blair & Fesen (1994) Blair, W. P., & Fesen, R. A. 1994, ApJ, 424, L103
- Blair et al. (2001) Blair, W. P., Fesen, R. A., & Schlegel, E. M. 2001, AJ, 121, 1497
- Blair et al. (1983) Blair, W. P., Kirshner, R. P., & Winkler, Jr., P. F. 1983, ApJ, 272, 84
- Blair et al. (2012) Blair, W. P., Winkler, P. F., & Long, K. S. 2012, ApJS, 203, 8
- Blair et al. (2014) Blair, W. P., Chandar, R., Dopita, M. A., et al. 2014, ApJ, 788, 55
- Blair et al. (2015) Blair, W. P., Winkler, P. F., Long, K. S., et al. 2015, ApJ, 800, 118
- Boissier et al. (2005) Boissier, S., Gil de Paz, A., Madore, B. F., et al. 2005, ApJ, 619, L83
- Boomsma et al. (2008) Boomsma, R., Oosterloo, T. A., Fraternali, F., van der Hulst, J. M., & Sancisi, R. 2008, A&A, 490, 555
- Bruursema et al. (2014) Bruursema, J., Meixner, M., Long, K. S., & Otsuka, M. 2014, AJ, 148, 41
- Cedrés et al. (2012) Cedrés, B., Cepa, J., Bongiovanni, Á., et al. 2012, A&A, 545, A43
- de Blok et al. (2008) de Blok, W. J. G., Walter, F., Brinks, E., et al. 2008, AJ, 136, 2648
- Dunne et al. (2000) Dunne, B. C., Gruendl, R. A., & Chu, Y.-H. 2000, AJ, 119, 1172
- Fesen & Becker (1990) Fesen, R. A., & Becker, R. H. 1990, ApJ, 351, 437
- Fesen & Matonick (1994) Fesen, R. A., & Matonick, D. M. 1994, ApJ, 428, 157
- Fesen et al. (1999) Fesen, R. A., Gerardy, C. L., Filippenko, A. V., et al. 1999, AJ, 117, 725
- Fridriksson et al. (2008) Fridriksson, J. K., Homan, J., Lewin, W. H. G., Kong, A. K. H., & Pooley, D. 2008, ApJS, 177, 465
- Gusev et al. (2013) Gusev, A. S., Sakhibov, F. H., & Dodonov, S. N. 2013, Astrophysical Bulletin, 68, 40
- Heng (2010) Heng, K. 2010, PASA, 27, 23
- Jarrett et al. (2013) Jarrett, T. H., Masci, F., Tsai, C. W., et al. 2013, AJ, 145, 6
- Jerkstrand et al. (2012) Jerkstrand, A., Fransson, C., Maguire, K., et al. 2012, A&A, 546, A28
- Kaaret et al. (2010) Kaaret, P., Feng, H., Wong, D. S., & Tao, L. 2010, ApJ, 714, L167
- Kalberla et al. (2005) Kalberla, P. M. W., Burton, W. B., Hartmann, D., et al. 2005, A&A, 440, 775
- Kotak et al. (2009) Kotak, R., Meikle, W. P. S., Farrah, D., et al. 2009, ApJ, 704, 306
- Lacey et al. (1997) Lacey, C., Duric, N., & Goss, W. M. 1997, ApJS, 109, 417
- Lacey & Duric (2001) Lacey, C. K., & Duric, N. 2001, ApJ, 560, 719
- Levenson et al. (1995) Levenson, N. A., Kirshner, R. P., Blair, W. P., & Winkler, P. F. 1995, AJ, 110, 739
- Long et al. (2018) Long, K. S., Blair, W. P., Milisavljevic, D., Raymond, J. C., & Winkler, P. F. 2018, ApJ, 855, 140
- Long et al. (2014) Long, K. S., Kuntz, K. D., Blair, W. P., et al. 2014, ApJS, 212, 21
- Long et al. (2012) Long, K. S., Blair, W. P., Godfrey, L. E. H., et al. 2012, ApJ, 756, 18
- Maguire et al. (2010) Maguire, K., Di Carlo, E., Smartt, S. J., et al. 2010, MNRAS, 404, 981
- Massey et al. (1988) Massey, P., Strobel, K., Barnes, J. V., & Anderson, E. 1988, ApJ, 328, 315
- Matonick & Fesen (1997) Matonick, D. M., & Fesen, R. A. 1997, ApJS, 112, 49
- Milisavljevic & Fesen (2008) Milisavljevic, D., & Fesen, R. A. 2008, ApJ, 677, 306
- Milisavljevic et al. (2012) Milisavljevic, D., Fesen, R. A., Chevalier, R. A., et al. 2012, ApJ, 751, 25
- Monet et al. (2003) Monet, D. G., Levine, S. E., Canzian, B., et al. 2003, AJ, 125, 984
- Morel et al. (2002) Morel, T., Doyon, R., & St-Louis, N. 2002, MNRAS, 329, 398
- Pagel (1978) Pagel, B. E. J. 1978, MNRAS, 183, 1P
- Rao et al. (2010) Rao, F., Feng, H., & Kaaret, P. 2010, ApJ, 722, 620
- Roberts & Colbert (2003) Roberts, T. P., & Colbert, E. J. M. 2003, MNRAS, 341, L49
- Sahu et al. (2006) Sahu, D. K., Anupama, G. C., Srividya, S., & Muneer, S. 2006, MNRAS, 372, 1315
- Schlafly & Finkbeiner (2011) Schlafly, E. F., & Finkbeiner, D. P. 2011, ApJ, 737, 103
- Tikhonov (2014) Tikhonov, N. A. 2014, Astronomy Letters, 40, 537
- Uomoto & Kirshner (1986) Uomoto, A., & Kirshner, R. P. 1986, ApJ, 308, 685
- White et al. (2019) White, R. L., Long, K. S., Becker, R. H., et al. 2019, ApJ, submitted
- Winkler et al. (2017) Winkler, P. F., Blair, W. P., & Long, K. S. 2017, ApJ, 839, 83
| Filter | |||
|---|---|---|---|
| Designation | (Å) | (Å)aaFull width at half maximum in the WIYN f/6.3 beam. | Exposure (s) |
| [O III] | 5010 | 60 | |
| Green Continuum | 5127 | 100 | |
| H | 6563 | 27 | |
| [S II]bbWIYN Observatory filter W037; other filters are PFW custom. | 6723 | 63 | |
| Red Continuum | 6840 | 93 | |
| Source | RA | Dec | GDC | H Fluxa | [SII]:H | Spectrum | Confirmed | Other Names |
|---|---|---|---|---|---|---|---|---|
| (2000) | (2000) | (kpc) | ||||||
| L19-001 | 20:34:15.00 | 60:10:44.3 | 10.4 | 52 | 0.21 | 05.18 | no | – |
| L19-002 | 20:34:15.48 | 60:07:31.6 | 9.6 | 64 | 0.34 | – | – | – |
| L19-003 | 20:34:15.78 | 60:08:26.0 | 9.2 | 216 | 1.14 | – | – | – |
| L19-004 | 20:34:16.41 | 60:08:27.3 | 9.0 | 33 | 0.61 | 02.25 | no | – |
| L19-005 | 20:34:16.68 | 60:07:30.8 | 9.3 | 120 | 0.42 | 08.17 | no | – |
| L19-006 | 20:34:17.54 | 60:10:58.3 | 10.1 | 97 | 0.66 | 05.09 | yes | – |
| L19-007 | 20:34:17.95 | 60:10:00.4 | 9.1 | 92 | 0.49 | 02.10 | yes | – |
| L19-008 | 20:34:18.39 | 60:10:47.3 | 9.7 | 540 | 0.33 | – | – | – |
| L19-009 | 20:34:18.84 | 60:11:08.9 | 10.0 | 33 | 0.86 | 05.01 | yes | – |
| L19-010 | 20:34:19.17 | 60:08:57.5 | 8.3 | 251 | 0.40 | 02.21 | yes | – |
| L19-011 | 20:34:20.60 | 60:09:06.8 | 8.0 | 56 | 0.52 | 02.11 | yes | – |
| L19-012 | 20:34:21.96 | 60:08:57.8 | 7.6 | 90 | 0.50 | – | – | – |
| L19-013 | 20:34:22.70 | 60:06:13.4 | 9.4 | 15 | 0.82 | 08.01 | yes | – |
| L19-014 | 20:34:23.38 | 60:08:18.7 | 7.3 | 96 | 0.62 | 02.01 | yes | MF-01; |
| L19-015 | 20:34:23.39 | 60:11:35.3 | 9.6 | 17 | 0.87 | 05.19 | yes | – |
| L19-016 | 20:34:24.43 | 60:11:25.8 | 9.1 | 169 | 0.41 | 05.10 | yes | – |
| L19-017 | 20:34:24.93 | 60:09:46.5 | 7.2 | 286 | 0.31 | 02.22 | no | – |
| L19-018 | 20:34:25.37 | 60:08:56.4 | 6.7 | 65 | 0.39 | – | – | – |
| L19-019 | 20:34:26.00 | 60:11:10.5 | 8.4 | 103 | 0.65 | 05.02 | yes | MF-02; |
| L19-020 | 20:34:26.06 | 60:13:22.8 | 12.2 | 17 | 0.60 | – | – | – |
| L19-021 | 20:34:26.17 | 60:10:11.9 | 7.2 | 94 | 0.41 | – | – | – |
| L19-022 | 20:34:27.65 | 60:11:12.2 | 8.1 | 45 | 0.60 | – | – | – |
| L19-023 | 20:34:28.22 | 60:11:37.9 | 8.7 | 5 | 1.77 | – | – | – |
| L19-024 | 20:34:28.32 | 60:13:21.9 | 11.8 | 53 | 0.77 | – | – | – |
| L19-025 | 20:34:28.33 | 60:07:04.2 | 7.2 | 20 | 0.96 | 08.02 | yes | – |
| L19-026 | 20:34:28.40 | 60:08:09.5 | 6.2 | 35 | 0.61 | – | – | – |
| L19-027 | 20:34:28.44 | 60:07:33.4 | 6.7 | 17 | 0.63 | – | – | – |
| L19-028 | 20:34:28.86 | 60:07:45.4 | 6.4 | 215 | 0.34 | 02.18 | no | – |
| L19-029 | 20:34:29.17 | 60:10:51.1 | 7.3 | 12 | 1.26 | – | – | F08-08; |
| L19-030 | 20:34:30.13 | 60:10:24.4 | 6.5 | 9 | 0.71 | 05.20 | yes | – |
| L19-031 | 20:34:31.67 | 60:10:28.0 | 6.2 | 78 | 0.65 | 05.05 | yes | – |
| L19-032 | 20:34:32.60 | 60:10:27.9 | 6.0 | 81 | 0.47 | 05.05 | no | – |
| L19-033 | 20:34:33.05 | 60:11:25.7 | 7.4 | 134 | 0.49 | 05.11 | yes | – |
| L19-034 | 20:34:33.31 | 60:09:46.7 | 5.1 | 13 | 1.12 | – | – | – |
| L19-035 | 20:34:33.65 | 60:09:52.0 | 5.1 | 14 | 1.32 | – | – | MF-03; |
| L19-036 | 20:34:33.85 | 60:09:25.0 | 4.7 | 81 | 0.97 | 02.02 | yes | MF-04; |
| L19-037 | 20:34:36.63 | 60:11:34.4 | 7.0 | 186 | 0.44 | 05.03 | yes | – |
| L19-038 | 20:34:37.38 | 60:07:15.0 | 5.4 | 42 | 0.66 | 02.03 | yes | – |
| L19-039 | 20:34:37.44 | 60:11:31.4 | 6.8 | 36 | 0.77 | 04.01 | yes | – |
| L19-040 | 20:34:37.76 | 60:08:52.6 | 3.6 | 24 | 0.90 | 08.07 | yes | MF-05; |
| L19-041 | 20:34:37.81 | 60:11:54.4 | 7.4 | 37 | 0.91 | 05.04 | yes | MF-06; |
| L19-042 | 20:34:37.98 | 60:07:22.3 | 5.1 | 18 | 1.31 | 02.04 | yes | MF-07; |
| L19-043 | 20:34:38.36 | 60:06:09.4 | 7.3 | 130 | 0.47 | – | – | – |
| L19-044 | 20:34:38.90 | 60:06:57.7 | 5.7 | 81 | 0.53 | 08.08 | yes | – |
| L19-045 | 20:34:39.15 | 60:09:19.0 | 3.3 | 405 | 0.32 | – | – | – |
| L19-046 | 20:34:39.19 | 60:08:13.9 | 3.7 | 44 | 0.58 | 02.05 | yes | – |
| L19-047 | 20:34:39.65 | 60:07:26.0 | 4.8 | 2 | 2.50 | – | – | – |
| L19-048 | 20:34:40.63 | 60:06:53.5 | 5.7 | 80 | 0.40 | 08.09 | yes | – |
| L19-049 | 20:34:40.73 | 60:08:34.0 | 3.1 | 46 | 0.53 | 02.23 | yes | – |
| L19-050 | 20:34:41.02 | 60:05:57.9 | 7.5 | 12 | 1.02 | – | – | – |
| L19-051 | 20:34:41.32 | 60:11:13.0 | 5.5 | 23 | 0.73 | 04.21 | yes | – |
| L19-052 | 20:34:41.32 | 60:04:54.9 | 9.7 | 82 | 0.43 | – | – | – |
| L19-053 | 20:34:41.53 | 60:11:30.0 | 6.1 | 67 | 0.47 | 05.21 | yes | – |
| L19-054 | 20:34:41.93 | 60:05:50.0 | 7.8 | 103 | 0.44 | 08.03 | yes | – |
| L19-055 | 20:34:42.44 | 60:09:16.0 | 2.5 | 6 | 1.87 | 02.13 | yes | – |
| L19-056 | 20:34:43.08 | 60:11:39.4 | 6.2 | 82 | 0.40 | 04.11 | no | – |
| L19-057 | 20:34:43.32 | 60:10:11.1 | 3.3 | 187 | 0.44 | – | – | – |
| L19-058 | 20:34:43.53 | 60:07:51.7 | 3.5 | 25 | 0.67 | – | – | – |
| L19-059 | 20:34:43.97 | 60:08:24.4 | 2.6 | 54 | 0.62 | 02.14 | yes | MF-08; |
| L19-060 | 20:34:44.61 | 60:08:17.3 | 2.7 | 63 | 0.37 | 02.15 | yes | – |
| L19-061 | 20:34:45.13 | 60:12:36.4 | 8.0 | 9 | 1.31 | 04.12 | yes | – |
| L19-062 | 20:34:45.67 | 60:07:21.2 | 4.3 | 196 | 0.35 | 02.24 | yes | – |
| L19-063 | 20:34:46.92 | 60:12:19.4 | 7.2 | 35 | 0.68 | 04.22 | yes | – |
| L19-064 | 20:34:47.19 | 60:08:20.2 | 2.2 | 79 | 0.48 | 08.10 | yes | – |
| L19-065 | 20:34:47.37 | 60:08:22.7 | 2.1 | 109 | 0.63 | 02.09 | yes | – |
| L19-066 | 20:34:47.75 | 60:09:58.7 | 2.1 | 57 | 0.79 | 04.13 | yes | L97-34; |
| L19-067 | 20:34:48.09 | 60:07:50.5 | 3.2 | 97 | 0.44 | 08.11 | yes | – |
| L19-068 | 20:34:48.64 | 60:09:24.4 | 1.0 | 159 | 0.44 | 07.01 | yes | – |
| L19-069 | 20:34:48.72 | 60:08:23.4 | 2.0 | 138 | 0.41 | 01.01 | yes | – |
| L19-070 | 20:34:49.66 | 60:07:37.0 | 3.6 | 60 | 0.50 | 03.10 | yes | – |
| L19-071 | 20:34:49.80 | 60:09:41.3 | 1.2 | 69 | 0.40 | – | – | – |
| L19-072 | 20:34:49.95 | 60:07:53.5 | 3.0 | 50 | 0.54 | 06.10 | yes | – |
| L19-073 | 20:34:50.02 | 60:09:43.3 | 1.3 | 86 | 0.49 | – | – | – |
| L19-074 | 20:34:50.36 | 60:09:45.2 | 1.3 | 79 | 0.38 | 02.16 | yes | – |
| L19-075 | 20:34:50.37 | 60:09:51.8 | 1.5 | 579 | 0.24 | – | – | – |
| L19-076 | 20:34:50.80 | 60:07:48.4 | 3.2 | 159 | 0.31 | 03.11 | yes | F08-43;B14-20; |
| L19-077 | 20:34:50.94 | 60:10:20.9 | 2.6 | 3662 | 0.29 | – | – | L97-48;F08-45; |
| L19-078 | 20:34:51.29 | 60:05:20.4 | 8.7 | 227 | 0.44 | – | – | – |
| L19-079 | 20:34:51.45 | 60:07:39.3 | 3.5 | 116 | 0.62 | 07.11 | yes | MF-09;L97-51; |
| L19-080 | 20:34:51.57 | 60:09:09.2 | 0.2 | 79 | 0.74 | 02.06 | yes | MF-10;F08-47; |
| L19-081 | 20:34:51.66 | 60:09:57.2 | 1.6 | 86 | 0.47 | 01.02 | no | – |
| L19-082 | 20:34:52.47 | 60:07:28.2 | 4.0 | 39 | 0.89 | 03.12 | yes | MF-11; |
| L19-083 | 20:34:52.51 | 60:10:01.9 | 1.8 | 69 | 0.70 | 02.07 | yes | – |
| L19-084 | 20:34:52.56 | 60:10:52.3 | 3.7 | 187 | 0.47 | 04.15 | yes | – |
| L19-085 | 20:34:53.09 | 60:08:14.1 | 2.3 | 10 | 1.24 | 07.24 | yes | – |
| L19-086 | 20:34:53.71 | 60:07:13.9 | 4.6 | 86 | 0.64 | 02.08 | yes | L97-68; |
| L19-087 | 20:34:54.31 | 60:11:03.4 | 4.0 | 33 | 0.96 | 04.02 | yes | MF-12; |
| L19-088 | 20:34:54.41 | 60:10:55.9 | 3.8 | 10 | 1.38 | 01.03 | yes | – |
| L19-089 | 20:34:54.55 | 60:05:08.6 | 9.3 | 178 | 0.63 | 08.16 | yes | – |
| L19-090 | 20:34:54.80 | 60:10:06.8 | 2.0 | 12 | 1.25 | 02.17 | yes | – |
| L19-091 | 20:34:54.87 | 60:10:34.6 | 3.0 | 56 | 0.64 | 07.12 | yes | – |
| L19-092 | 20:34:55.62 | 60:11:13.7 | 4.4 | 43 | 0.51 | – | – | – |
| L19-093 | 20:34:55.90 | 60:07:49.2 | 3.5 | 142 | 0.50 | 03.02 | yes | MF-13; |
| L19-094 | 20:34:56.58 | 60:08:19.9 | 2.5 | 88 | 0.76 | 01.04 | yes | F08-53; |
| L19-095 | 20:34:57.81 | 60:08:10.1 | 3.0 | 71 | 0.71 | 01.05 | yes | MF-14;B14-25; |
| L19-096 | 20:34:58.49 | 60:08:01.8 | 3.3 | 9 | 1.39 | 07.13 | yes | – |
| L19-097 | 20:35:00.31 | 60:11:46.0 | 5.8 | 201 | 0.62 | 04.03 | yes | MF-15; |
| L19-098 | 20:35:00.72 | 60:11:30.9 | 5.3 | 1184 | 0.95 | 01.06 | yes | MF-16;L97-85;F08-63;B14-29; |
| L19-099 | 20:35:01.15 | 60:12:00.1 | 6.3 | 44 | 0.57 | 04.04 | yes | MF-17; |
| L19-100 | 20:35:02.24 | 60:11:05.2 | 4.6 | 274 | 0.48 | 01.07 | yes | – |
| L19-101 | 20:35:02.38 | 60:06:31.5 | 7.0 | 188 | 0.57 | 03.04 | yes | MF-18; |
| L19-102 | 20:35:02.93 | 60:11:27.2 | 5.3 | 60 | 0.51 | 06.14 | yes | – |
| L19-103 | 20:35:03.17 | 60:10:41.9 | 4.0 | 25 | 0.87 | 01.08 | yes | – |
| L19-104 | 20:35:03.30 | 60:05:28.8 | 9.3 | 66 | 0.71 | 03.13 | yes | MF-19; |
| L19-105 | 20:35:03.59 | 60:06:23.4 | 7.4 | 79 | 0.41 | – | – | – |
| L19-106 | 20:35:04.06 | 60:11:15.6 | 5.1 | 14 | 1.33 | 04.16 | yes | – |
| L19-107 | 20:35:04.19 | 60:11:18.5 | 5.2 | 48 | 0.72 | – | – | – |
| L19-108 | 20:35:04.22 | 60:09:53.5 | 3.2 | 43 | 0.64 | 06.15 | no | L97-88; |
| L19-109 | 20:35:04.27 | 60:06:52.1 | 6.5 | 11 | 1.13 | 03.14 | yes | – |
| L19-110 | 20:35:05.00 | 60:05:32.9 | 9.3 | 48 | 0.50 | – | – | – |
| L19-111 | 20:35:05.63 | 60:10:00.8 | 3.6 | 47 | 0.60 | 06.16 | yes | MF-20; |
| L19-112 | 20:35:05.69 | 60:11:07.6 | 5.1 | 383 | 0.32 | 04.06 | yes | L97-95; |
| L19-113 | 20:35:06.89 | 60:07:58.4 | 5.0 | 40 | 0.59 | 03.15 | yes | – |
| L19-114 | 20:35:06.96 | 60:09:57.0 | 3.9 | 98 | 0.51 | 04.07 | yes | – |
| L19-115 | 20:35:07.07 | 60:05:57.3 | 8.8 | 247 | 0.36 | – | – | – |
| L19-116 | 20:35:08.80 | 60:06:03.0 | 8.8 | 63 | 0.45 | – | – | MF-21; |
| L19-117 | 20:35:08.89 | 60:10:13.0 | 4.5 | 9 | 1.08 | – | – | – |
| L19-118 | 20:35:09.56 | 60:09:13.1 | 4.4 | 239 | 0.39 | 06.17 | no | – |
| L19-119 | 20:35:09.61 | 60:12:30.0 | 8.0 | 124 | 0.73 | – | – | MF-22; |
| L19-120 | 20:35:09.87 | 60:06:13.3 | 8.6 | 19 | 0.82 | – | – | – |
| L19-121 | 20:35:10.22 | 60:06:26.7 | 8.3 | 83 | 0.49 | 03.16 | yes | – |
| L19-122 | 20:35:10.54 | 60:06:41.3 | 7.9 | 23 | 0.78 | – | – | – |
| L19-123 | 20:35:10.63 | 60:10:40.9 | 5.3 | 190 | 0.39 | 01.11 | yes | – |
| L19-124 | 20:35:10.89 | 60:08:56.9 | 4.9 | 825 | 0.33 | 06.04 | no | F08-74; |
| L19-125 | 20:35:11.04 | 60:08:27.1 | 5.3 | 70 | 0.49 | 01.12 | yes | – |
| L19-126 | 20:35:11.45 | 60:11:11.9 | 6.1 | 110 | 0.57 | 04.17 | yes | – |
| L19-127 | 20:35:11.60 | 60:07:41.2 | 6.4 | 183 | 0.51 | 03.05 | yes | MF-23; |
| L19-128 | 20:35:11.90 | 60:09:28.6 | 5.0 | 20 | 0.88 | 06.18 | yes | – |
| L19-129 | 20:35:11.94 | 60:04:03.7 | 13.3 | 342 | 0.34 | – | – | – |
| L19-130 | 20:35:12.25 | 60:06:37.6 | 8.3 | 69 | 0.57 | – | – | – |
| L19-131 | 20:35:12.62 | 60:09:09.7 | 5.2 | 60 | 0.62 | 01.13 | yes | – |
| L19-132 | 20:35:13.62 | 60:08:58.9 | 5.5 | 111 | 0.54 | 07.25 | yes | – |
| L19-133 | 20:35:14.44 | 60:07:12.7 | 7.7 | 9 | 1.10 | 07.18 | yes | – |
| L19-134 | 20:35:16.52 | 60:07:50.1 | 7.3 | 11 | 0.77 | – | – | – |
| L19-135 | 20:35:16.93 | 60:11:05.4 | 7.0 | 56 | 0.86 | 01.15 | yes | MF-24; |
| L19-136 | 20:35:17.33 | 60:10:27.3 | 6.6 | 21 | 0.80 | 04.18 | yes | – |
| L19-137 | 20:35:17.56 | 60:07:19.3 | 8.2 | 200 | 0.47 | – | – | – |
| L19-138 | 20:35:20.08 | 60:09:33.9 | 7.0 | 88 | 0.61 | 06.05 | yes | F08-82; |
| L19-139 | 20:35:20.80 | 60:09:52.7 | 7.2 | 16 | 1.17 | – | – | – |
| L19-140 | 20:35:21.11 | 60:08:44.1 | 7.6 | 203 | 0.63 | 06.06 | yes | MF-25; |
| L19-141 | 20:35:23.02 | 60:08:21.2 | 8.3 | 200 | 0.38 | 01.18 | yes | – |
| L19-142 | 20:35:23.66 | 60:08:47.7 | 8.2 | 129 | 0.44 | 07.20 | no | – |
| L19-143 | 20:35:24.22 | 60:07:42.5 | 9.2 | 124 | 0.41 | 03.17 | no | – |
| L19-144 | 20:35:24.66 | 60:06:57.2 | 10.3 | 18 | 0.80 | – | – | – |
| L19-145 | 20:35:25.24 | 60:07:26.9 | 9.8 | 299 | 0.38 | – | – | – |
| L19-146 | 20:35:25.51 | 60:07:51.3 | 9.4 | 57 | 0.67 | – | – | MF-26; |
| L19-147 | 20:35:26.11 | 60:08:43.0 | 8.8 | 202 | 0.65 | 01.19 | yes | MF-27; |
| Mask No. | Date (UT) | Total Exposure (s)aa H Flux is in units of 10-17 ergs cm-2 s-1. |
|---|---|---|
| 1 | 30 Jul 2014 | 3 CWLs |
| 2 | 24 Sep 2014 | 3 CWLs |
| 3 | 25-30 Sep 2014 | 3 CWLs |
| 4 | 26 Oct, 19 Nov 2014 | 3 CWLs |
| 5 | 21-27 Nov 2014 | 3 CWLs |
| 6bbMF = Matonick & Fesen (1997); B14 = Bruursema et al. (2014); F08 = Fridriksson et al. (2008); L97 = Lacey et al. (1997) | 14-17 Dec 2014 | 2 CWLs |
| 7 | 14 Sep 2015 | 3 CWLs |
| 8 | 20 Sep - 19 Oct 2015 | 4 CWLs |
| Source | H flux | H | [OIII]5007 | [OI]6300 | H | [NII]6583 | [SII]6716 | [SII]6731 | [SII]:H | [SII]6716:6731 | FWHM |
|---|---|---|---|---|---|---|---|---|---|---|---|
| L19-001 | 183 | 76 | – | – | 300 | 38 | 33 | 30 | 0.21 | 1.10 | 6.8 |
| L19-004 | 68 | 53 | – | – | 300 | 93 | 69 | 47 | 0.39 | 1.47 | 7.1 |
| L19-005 | 216 | 80 | 182 | – | 300 | 61 | 65 | 43 | 0.36 | 1.51 | 8.3 |
| L19-006 | 181 | 79 | – | – | 300 | 102 | 170 | 113 | 0.94 | 1.50 | 8.4 |
| L19-007 | 123 | 54 | 87 | – | 300 | 149 | 84 | 58 | 0.47 | 1.45 | 7.4 |
| L19-009 | 122 | 29 | 81 | 40 | 300 | 114 | 180 | 138 | 1.06 | 1.30 | 7.6 |
| L19-010 | 57 | 49 | – | 38 | 300 | 111 | 79 | 53 | 0.44 | 1.49 | 9.4 |
| L19-011 | 28 | 42 | 202 | 18 | 300 | 134 | 102 | 78 | 0.60 | 1.31 | 8.5 |
| L19-013 | 19 | 61 | 165 | 76 | 300 | 148 | 132 | 127 | 0.86 | 1.04 | 7.0 |
| L19-014 | 132 | 38 | 108 | 40 | 300 | 164 | 123 | 89 | 0.71 | 1.38 | 7.4 |
| L19-015 | 52 | – | 146 | – | 300 | 139 | 117 | 112 | 0.76 | 1.04 | 9.6 |
| L19-016 | 102 | – | 32 | 36 | 300 | 135 | 149 | 103 | 0.84 | 1.45 | 6.1 |
| L19-017 | 248 | 31 | 15 | 73 | 300 | 95 | 49 | 29 | 0.26 | 1.69 | 7.6 |
| L19-019 | 85 | 36 | 139 | 209 | 300 | 180 | 239 | 171 | 1.37 | 1.40 | 6.5 |
| L19-025 | 21 | – | 166 | 81 | 300 | 225 | 182 | 133 | 1.05 | 1.37 | 7.8 |
| L19-028 | 150 | 29 | 9 | – | 300 | 99 | 57 | 43 | 0.33 | 1.33 | 5.5 |
| L19-030 | 31 | – | – | 874 | 300 | 168 | 177 | 121 | 0.99 | 1.46 | 6.2 |
| L19-031 | 179 | 69 | 110 | 67 | 300 | 217 | 189 | 134 | 1.08 | 1.41 | 7.6 |
| L19-032 | 501 | 55 | 13 | 6 | 300 | 119 | 64 | 49 | 0.38 | 1.31 | 7.4 |
| L19-033 | 157 | 75 | – | – | 300 | 179 | 132 | 85 | 0.72 | 1.55 | 7.2 |
| L19-036 | 89 | 35 | 56 | 81 | 300 | 296 | 218 | 161 | 1.26 | 1.35 | 7.7 |
| L19-037 | 43 | – | – | 55 | 300 | 142 | 243 | 167 | 1.37 | 1.46 | 4.0 |
| L19-038 | 28 | 56 | 67 | 63 | 300 | 224 | 173 | 115 | 0.96 | 1.50 | 6.1 |
| L19-039 | 78 | 31 | 76 | -357 | 300 | 240 | 189 | 140 | 1.09 | 1.35 | 7.1 |
| L19-040 | 20 | – | 23 | 60 | 300 | 314 | 231 | 166 | 1.32 | 1.39 | 7.0 |
| L19-041 | 55 | 117 | 177 | – | 300 | 202 | 156 | 146 | 1.01 | 1.07 | 5.9 |
| L19-042 | 26 | 39 | 158 | 89 | 300 | 390 | 240 | 175 | 1.38 | 1.37 | 7.3 |
| L19-044 | 15 | 88 | 106 | 49 | 300 | 180 | 117 | 69 | 0.62 | 1.70 | 6.7 |
| L19-046 | 31 | 32 | 92 | 93 | 300 | 366 | 177 | 149 | 1.09 | 1.19 | 7.7 |
| L19-048 | 69 | 50 | 56 | 47 | 300 | 146 | 79 | 55 | 0.45 | 1.44 | 6.9 |
| L19-049 | 56 | 35 | 76 | 13 | 300 | 185 | 95 | 65 | 0.53 | 1.46 | 7.5 |
| L19-051 | 45 | – | 182 | 242 | 300 | 303 | 191 | 147 | 1.13 | 1.30 | 7.5 |
| L19-053 | 239 | 64 | – | 20 | 300 | 103 | 84 | 63 | 0.49 | 1.33 | 6.5 |
| L19-054 | 88 | 56 | – | – | 300 | 107 | 79 | 56 | 0.45 | 1.41 | 6.7 |
| L19-055 | 9 | 86 | – | 65 | 300 | 420 | 227 | 160 | 1.29 | 1.42 | 6.6 |
| L19-056 | 97 | 44 | 21 | – | 300 | 112 | 62 | 44 | 0.35 | 1.41 | 7.9 |
| L19-059 | 62 | 40 | – | – | 300 | 264 | 126 | 90 | 0.72 | 1.40 | 7.2 |
| L19-060 | 50 | 42 | 46 | 49 | 300 | 205 | 82 | 66 | 0.49 | 1.24 | 7.2 |
| L19-061 | 60 | – | – | – | 300 | 177 | 198 | 146 | 1.15 | 1.36 | 7.1 |
| L19-062 | 85 | 47 | 51 | 10 | 300 | 131 | 83 | 60 | 0.48 | 1.38 | 5.7 |
| L19-063 | 116 | 52 | 26 | – | 300 | 118 | 85 | 69 | 0.51 | 1.23 | 8.4 |
| L19-064 | 56 | 26 | 39 | – | 300 | 173 | 105 | 70 | 0.58 | 1.50 | 6.5 |
| L19-065 | 48 | 8 | 19 | 60 | 300 | 232 | 170 | 137 | 1.02 | 1.24 | 6.1 |
| L19-066 | 36 | – | – | – | 300 | 350 | 314 | 198 | 1.71 | 1.59 | 5.9 |
| L19-067 | 69 | 55 | – | – | 300 | 157 | 118 | 93 | 0.70 | 1.27 | 7.0 |
| L19-068 | 92 | 30 | 47 | 39 | 300 | 270 | 140 | 105 | 0.82 | 1.33 | 6.7 |
| L19-069 | 222 | 35 | 42 | 26 | 300 | 188 | 92 | 72 | 0.54 | 1.28 | 8.1 |
| L19-070 | 49 | 62 | 127 | – | 300 | 270 | 118 | 86 | 0.68 | 1.37 | 7.9 |
| L19-072 | 27 | – | 77 | 40 | 300 | 323 | 203 | 113 | 1.06 | 1.80 | 6.4 |
| L19-074 | 24 | 32 | – | 258 | 300 | 739 | 368 | 302 | 2.24 | 1.22 | 8.1 |
| L19-076 | 47 | – | 78 | 104 | 300 | 607 | 132 | 182 | 1.05 | 0.73 | 9.2 |
| L19-079 | 22 | 18 | 62 | 54 | 300 | 343 | 135 | 97 | 0.77 | 1.39 | 6.9 |
| L19-080 | 73 | 13 | 158 | 78 | 300 | 637 | 185 | 178 | 1.21 | 1.04 | 9.5 |
| L19-081 | 99 | 13 | 47 | 20 | 300 | 142 | 63 | 45 | 0.36 | 1.40 | 8.1 |
| L19-082 | 23 | – | – | 111 | 300 | 389 | 261 | 181 | 1.47 | 1.44 | 6.6 |
| L19-083 | 24 | 32 | 176 | 87 | 300 | 629 | 234 | 182 | 1.39 | 1.29 | 7.7 |
| L19-084 | 119 | 51 | 24 | 41 | 300 | 140 | 109 | 76 | 0.62 | 1.43 | 7.8 |
| L19-085 | 37 | – | 235 | 43 | 300 | 493 | 182 | 41 | 0.74 | 4.44 | 8.6 |
| L19-086 | 28 | – | 174 | 58 | 300 | 393 | 245 | 128 | 1.24 | 1.91 | 7.5 |
| L19-087 | 100 | 42 | 46 | 121 | 300 | 263 | 204 | 156 | 1.20 | 1.31 | 7.1 |
| L19-088 | 24 | 81 | 271 | 61 | 300 | 232 | 216 | 157 | 1.24 | 1.38 | 5.4 |
| L19-089 | 11 | – | – | – | 300 | 160 | 138 | 76 | 0.71 | 1.82 | 11.0 |
| L19-090 | 27 | – | – | – | 300 | 499 | 180 | 155 | 1.12 | 1.16 | 7.6 |
| L19-091 | 9 | 84 | – | – | 300 | 387 | 332 | 253 | 1.95 | 1.31 | 6.4 |
| L19-093 | 159 | 49 | 56 | – | 300 | 175 | 100 | 71 | 0.57 | 1.41 | 6.9 |
| L19-094 | 179 | 37 | 153 | 60 | 300 | 433 | 107 | 119 | 0.75 | 0.90 | 7.9 |
| L19-095 | 108 | 34 | 56 | 52 | 300 | 249 | 119 | 115 | 0.78 | 1.03 | 6.7 |
| L19-096 | 14 | 95 | 70 | 145 | 300 | 406 | 291 | 207 | 1.66 | 1.41 | 7.2 |
| L19-097 | 564 | 58 | – | – | 300 | 181 | 140 | 105 | 0.82 | 1.33 | 6.7 |
| L19-098 | 1351 | – | 518 | 97 | 300 | 276 | 160 | 153 | 1.04 | 1.05 | 7.8 |
| L19-099 | 171 | 53 | 120 | 15 | 300 | 149 | 116 | 91 | 0.69 | 1.27 | 6.7 |
| L19-100 | 61 | 51 | – | – | 300 | 120 | 93 | 52 | 0.48 | 1.79 | 7.6 |
| L19-101 | 243 | 58 | 4 | 16 | 300 | 118 | 84 | 57 | 0.47 | 1.47 | 8.8 |
| L19-102 | 103 | – | – | – | 300 | 105 | 97 | 69 | 0.55 | 1.41 | 7.1 |
| L19-103 | 56 | 34 | 86 | 60 | 300 | 298 | 149 | 110 | 0.86 | 1.35 | 6.9 |
| L19-104 | 120 | 53 | 134 | – | 300 | 96 | 104 | 73 | 0.59 | 1.42 | 8.8 |
| L19-106 | 73 | – | 129 | 55 | 300 | 217 | 193 | 141 | 1.11 | 1.37 | 6.8 |
| L19-108 | 330 | 23 | – | – | 300 | 127 | 58 | 43 | 0.34 | 1.35 | 6.0 |
| L19-109 | 18 | 54 | 282 | – | 300 | 246 | 184 | 128 | 1.04 | 1.44 | 8.8 |
| L19-111 | 64 | 17 | – | 50 | 300 | 190 | 120 | 99 | 0.73 | 1.21 | 8.7 |
| L19-112 | 258 | 45 | 98 | 35 | 300 | 170 | 116 | 90 | 0.69 | 1.29 | 6.8 |
| L19-113 | 31 | – | – | 36 | 300 | 158 | 104 | 82 | 0.62 | 1.27 | 6.1 |
| L19-114 | 311 | 29 | 9 | 14 | 300 | 150 | 95 | 72 | 0.56 | 1.32 | 6.7 |
| L19-118 | 863 | 37 | – | 8 | 300 | 116 | 52 | 37 | 0.29 | 1.41 | 7.3 |
| L19-121 | 92 | 52 | 51 | 24 | 300 | 105 | 101 | 73 | 0.58 | 1.38 | 9.0 |
| L19-123 | 12 | 31 | 28 | – | 300 | 239 | 186 | 133 | 1.06 | 1.40 | 6.0 |
| L19-124 | 2638 | 34 | 5 | 14 | 300 | 115 | 52 | 44 | 0.32 | 1.18 | 6.2 |
| L19-125 | 127 | 23 | 24 | 39 | 300 | 135 | 97 | 73 | 0.57 | 1.33 | 6.2 |
| L19-126 | 80 | 35 | – | – | 300 | 103 | 89 | 60 | 0.50 | 1.48 | 7.2 |
| L19-127 | 242 | 44 | 89 | 35 | 300 | 147 | 97 | 80 | 0.59 | 1.21 | 8.0 |
| L19-128 | 40 | – | 65 | 133 | 300 | 323 | – | – | – | 1.00 | 6.9 |
| L19-131 | 60 | 34 | 192 | 74 | 300 | 266 | 165 | 145 | 1.03 | 1.14 | 7.9 |
| L19-132 | 61 | 49 | – | – | 300 | 155 | 105 | 82 | 0.62 | 1.28 | 7.6 |
| L19-133 | 7 | – | 148 | 122 | 300 | 171 | 215 | 138 | 1.18 | 1.56 | 5.5 |
| L19-135 | 93 | 51 | 46 | 91 | 300 | 139 | 180 | 132 | 1.04 | 1.36 | 8.0 |
| L19-136 | 74 | 47 | – | – | 300 | 129 | 174 | 116 | 0.97 | 1.50 | 7.1 |
| L19-138 | 317 | 52 | 55 | 69 | 300 | 168 | 102 | 97 | 0.66 | 1.05 | 6.9 |
| L19-140 | 472 | – | – | 36 | 300 | 102 | 103 | 76 | 0.60 | 1.36 | 7.5 |
| L19-141 | 82 | 62 | 115 | 63 | 300 | 173 | 130 | 99 | 0.76 | 1.31 | 7.9 |
| L19-142 | 155 | 38 | 116 | 8 | 300 | 83 | 39 | 29 | 0.23 | 1.34 | 6.7 |
| L19-143 | 152 | 60 | 23 | – | 300 | 89 | 58 | 41 | 0.33 | 1.41 | 8.1 |
| L19-147 | 271 | 55 | 11 | 16 | 300 | 112 | 106 | 74 | 0.60 | 1.43 | 8.4 |