Near room temperature antiferromagnetic ordering with a potential low dimensional magnetism in AlMn2B2
Abstract
We present self flux growth and characterization of single crystalline AlMn2B2. It is an orthorhombic (space group Cmmm), layered material with a plate like morphology. The anisotropic bulk magnetization data, electrical transport and 11B nuclear magnetic resonance(NMR) data revealed an antiferromagnetic (AFM) transition at 313 2 K. In the magnetization data, there is also a broad local maximum significantly above the AFM transition that could be a signature of low dimensional magnetic interactions in AlMn2B2.
I Introduction
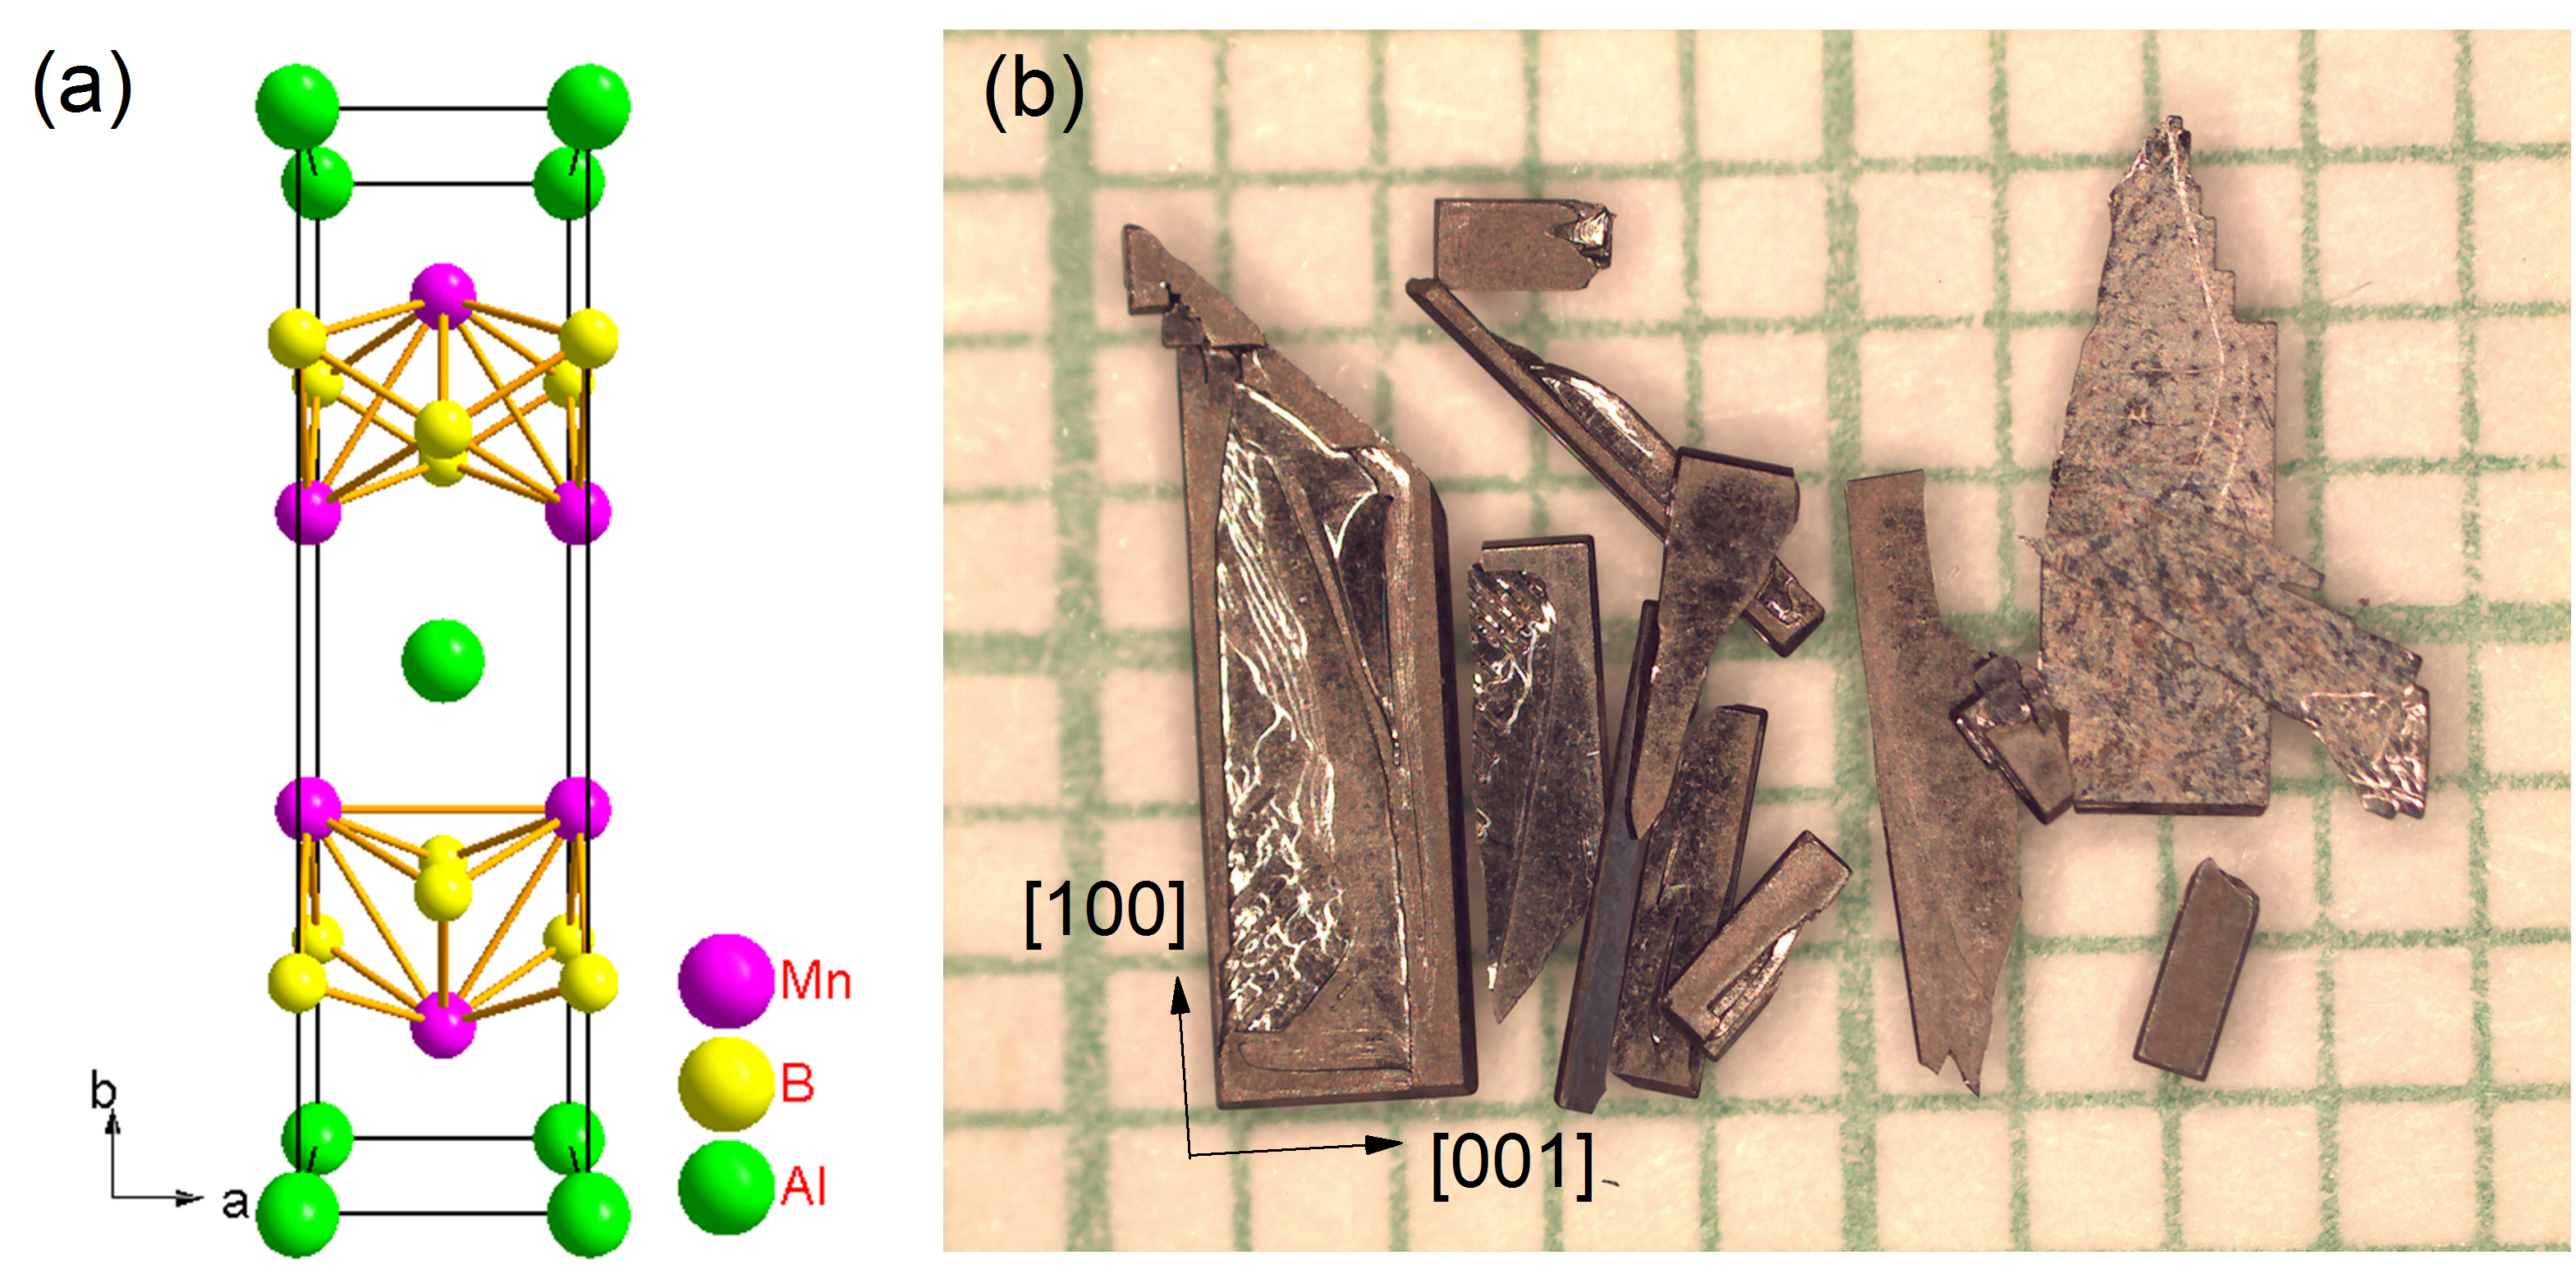
The AlT2B2 (T = Fe, Cr, Mn) system crystallizes in the orthorhombic, Cmmm structure and adopts a layer morphology with an internal structure of alternate stacking of Al atom planes and T2B2 slabs along the b-axis Du et al. (2015). A representative unit cell of AlMn2B2 is shown in Fig. 1(a) to demonstrate this atomic structure. AlT2B2 compounds are interesting, specially for potential rare earth free magnetocaloric materials and soft magnetic materials. AlFe2B2 is ferromagnetic and studied for its magneto-caloric and anisotropic magnetic properties Tan et al. (2013); Lamichhane et al. (2018); Barua et al. (2018). Understanding the magnetic properties of the neighbouring, isostructural compounds can provide further insight in to the series as well as how to tune the magnetocaloric property of the AlFe2B2 via substitution. We started this work to clarify the magnetic properties of AlMn2B2 since it was identified as a nonmagnetic material Chai et al. (2015). In addition, some inconsistencies between bulk and local probe magnetic measurements in the Al(Fe1-xMnx)2B2 were observed. A later first principle calculation suggested that AlMn2B2 should be an anti-ferromagnetic compound Ke et al. (2017). In a recent powder neutron study, AlMn2B2 is identified as a ceramic AFM compound Potashnikov et al. (2019) with Neel temperature around 390 K. A study of lattice parameters variation from room temperature to 1200 K revealed that there is a change in anisotropy nature in a and c lattice parameters around 450 K and a local minimum in b lattice parameters around 400 K Verger et al. (2018). The lack of a clear description of the nature or number of magnetic phase transitions in AlMn2B2 led us to grow and systematically study single crystalline samples.
This paper reports the synthesis of bulk single crystals via high-temperature solution growth and their characterization via high and low temperature magnetization, NMR, and electrical resistance measurements. We find that AlMn2B2 is a metallic antiferromagnet with a transition temperature of TN = K. In addition we find that AlMn2B2 has features associated with pseudo-two-dimensional magnets.
| Empirical formula | AlMn2B2 |
|---|---|
| Formula weight | 158.48 |
| Temperature | K |
| Wavelength | Å |
| Crystal system, space group | Orthorhombic, Cmmm |
| Unit cell dimensions | a=2.9215(1) Å |
| b = 11.0709(6) Å | |
| c = 2.8972(2) Å | |
| Volume | 93.706(9) Å3 |
| Z, Calculated density | 2, 5.63 g/ |
| Absorption coefficient | 6.704 mm-1 |
| F(000) | 73 |
| range (∘) | 3.693 to 29.003 |
| Limiting indices | |
| Reflections collected | 1467 |
| Independent reflections | 270 [R(int) = 0.0401] |
| Completeness to theta = 25.242∘ | 98.5% |
| Absorption correction | multi-scan, empirical |
| Refinement method | Full-matrix least-squares |
| Data / restraints / parameters | 270 / 0 / 12 |
| Goodness-of-fit on | 1.101 |
| Final R indices [I(I)] | , |
| R indices (all data) | , |
| Largest diff. peak and hole | 2.341 and -1.249 e.Å-3 |
| atom | Wyckoff site | x | y | z | Ueq |
| Mn | 4j | 0 | 0.3552(1) | 1/2 | 0.0070(1) |
| Al | 2a | 0 | 0 | 0 | 0.0067(5) |
| B | 4i | 0 | 0.2065(5) | 0 | 0.0070(1) |
II Experimental Details
II.1 Crystal growth
Solution growth is a powerful tool even for compounds with high melting elements like B Belashchenko et al. (2015); Lamichhane et al. (2018); Canfield and Fisher (2001). The major difficulty associated with solution growth is finding an initial composition that allows for growth of the single phase, desired compound. For example, CaKFe4As4 growth in single phase form presents an illustrative example Meier et al. (2017). Fortunately, with the innovation of fritted alumina crucibles sets Canfield et al. (2016) we can now reuse decanted melt and essentially fractionate the melt, as described below.
Al shot (Alfa Aesar 99.999%), B pieces (Alfa Aesar 99.5% metal basis) and Mn pieces (Alfa Aesar 99.9% metal basis) after surface oxidation cleaning as described elsewhere Lamichhane et al. (2016) were used for the crystal growth process. We started with an Al rich composition, Al68Mn22B10, and arc-melted it at least 4 times under an Ar atmosphere. The button was then cut with a metal cutter and re-arcmelted if some not-reacted B pieces were found. After the button appeared to be homogeneous, it was packed in a fritted alumina crucible set Canfield et al. (2016) and sealed under partial pressure of argon inside amorphous silica jacket to form a growth ampoule. The growth ampoule was then heated to 1200 ∘C over 2 h and soaked there for 10 h before spinning using a centrifuge. Due to high melting point of B containing compounds, homogeneous liquid was not formed at 1200 ∘C. Undissolved polycrystalline MnB and Al-Mn binary compounds were separated at 1200 ∘C via centrifuging. The catch crucible collected the homogeneous melt at 1200 ∘C was again sealed in a fritted alumina crucible sets under Ar atmosphere to form second growth ampoule. This second ampoule was heated to 1200 ∘C over 2 h, held there for another 10 h and cooled down to 1100 ∘C over 50 h and spun using centrifuge to separate the crystals. The second growth attempt produced a mixture of the targeted AlMn2B2 phase along with MnB crystals. So as to avoid this MnB contamination, the catch crucible of the second growth was used for a third growth and sealed again under a partial pressure of Ar. For this stage, to make sure there are no other nucleated crystals, the third growth growth was heated to 1200 ∘C over 2 h and soaked there for 2 h. It was then cooled down to 1100 ∘C over 1 h and stayed there for 1 h followed by slow cooling to 990 ∘C over 120 h and centrifuged to separate large, single phased AlMn2B2 crystals as shown in Fig. 1(b). The flux on the surface was removed via concentrated NaOH etching.
It should be noted that predominantly single phase AlMn2B2 crystals were grown in single growth attempt using initial Al84Mn8B8 composition however the crystals were small, due to multiple nucleation sites.
III Crystal structure and stoichiometry
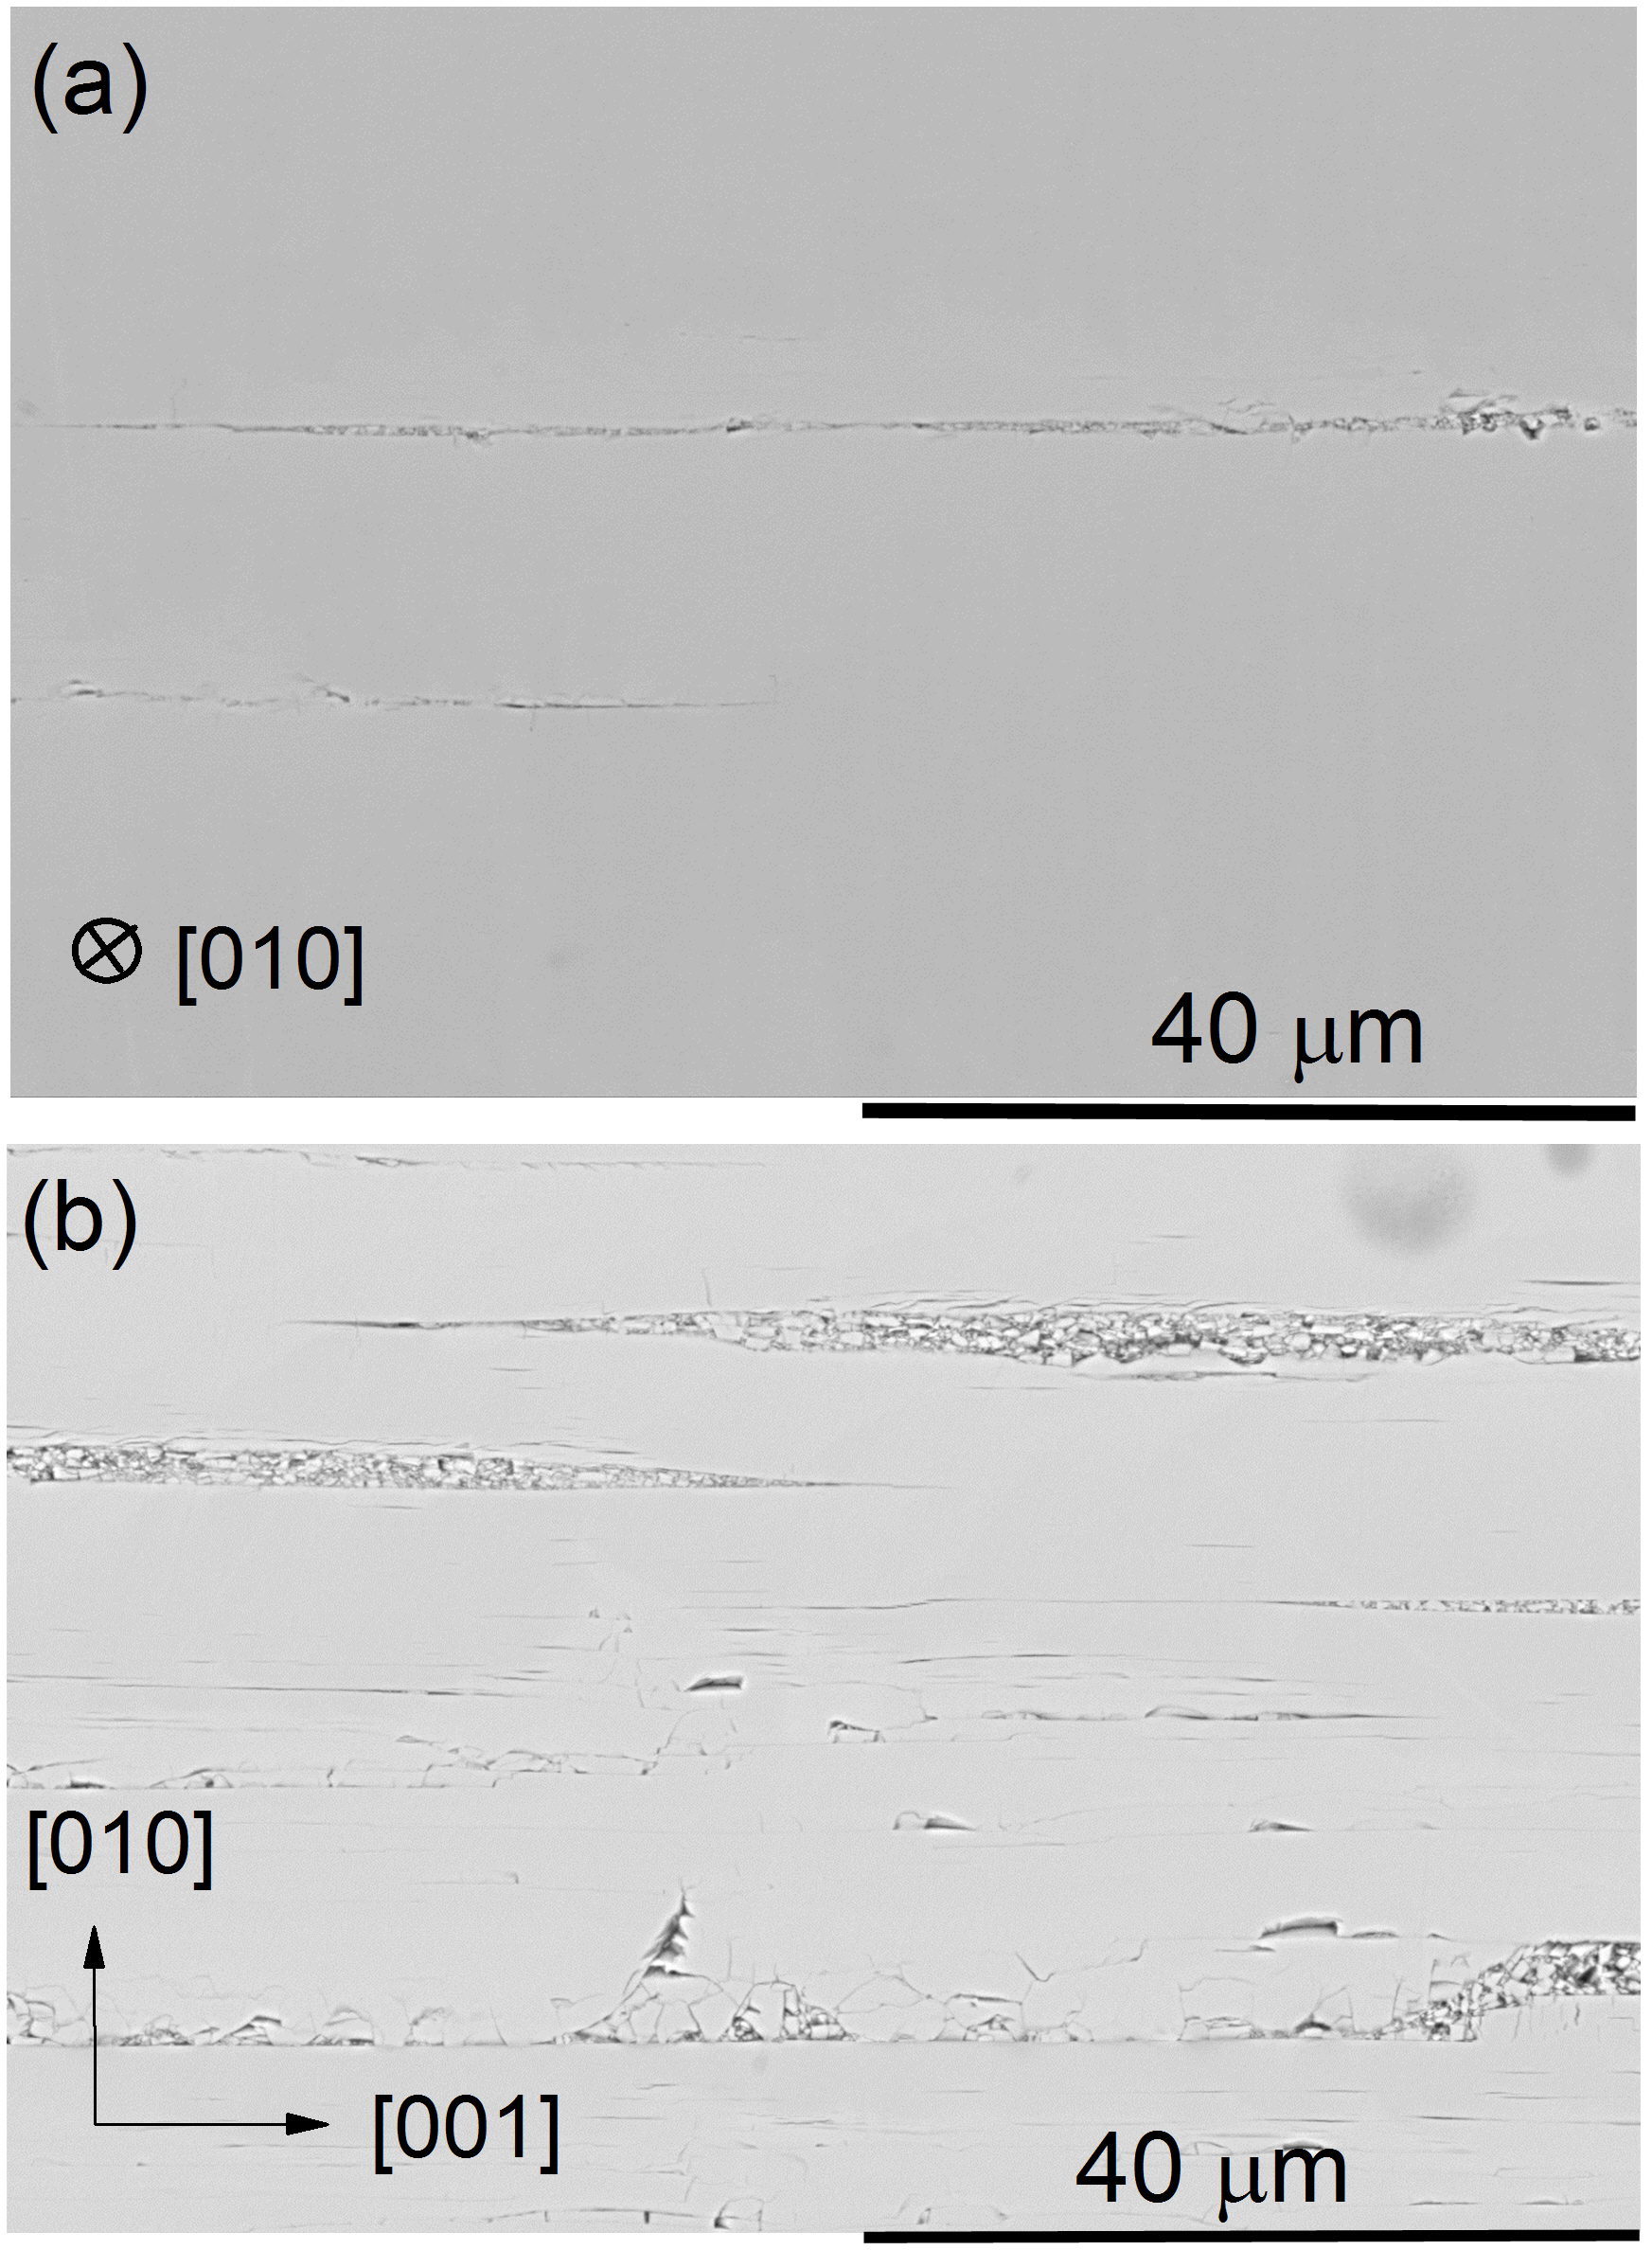
As grown single crystals were characterized using a scanning electron microscope (SEM), as well as both powder and single crystal X-ray diffraction (XRD). Figures 2(a) and (b) show the planar and cross sectional backscattered SEM images of AlMn2B2 single crystals which show predominantly homogeneous compositions. The small linear grooves are the cracked layers associated with the SEM sample polishing. Being a layered material, it can be easily cleaved and deformed. Boron is difficult to account for correctly in electron dispersive spectroscopy(EDS), as a consequence of this we determined only the Mn:Al ratio for two different batches of single crystalline samples. In first batch, 13 spots were analyzed in EDS with Mn:Al ratio of 2.07 for all characteristics X-ray emissions. Similarly, an 8 spot analysis in the second batch provided the Mn:Al ratio to be 2.12 for characteristics K-lines for all elements. With the L-characteristics-lines analysis, a ratio of 2.51 was obtained for the second batch. Without the creation and use of Mn-Al-B based standards, further characterization by EDS is difficult.
Although the EDS results are qualitatively in agreement with the AlMn2B2 structure, to more precisely determine the composition and structure, multiple batches of AlMn2B2 were investigated using single crystal XRD technique. Single crystalline XRD data were collected with the use of graphite monochromatized Mo Kα radiation (=0.71073 Å) at room temperature on a Bruker APEX2 diffractometer. Reflections were gathered by taking five sets of 440 frames with 0.5∘ scans in , with an exposure time of 10 s per frame and the crystal-to-detector distance of 6 cm. The structure solution and refinement for single crystal data was carried out using SHELXTL program package. Attempts to refine occupancies of each site indicated full occupancy(). The final stage of refinement was performed using anisotropic displacement parameters for all the atoms. The refinement metrics and atomic coordinates are presented in TABLE 1 and 2 respectively. The single crystalline refinement showed AlMn2B2 as a stoichiometric material.
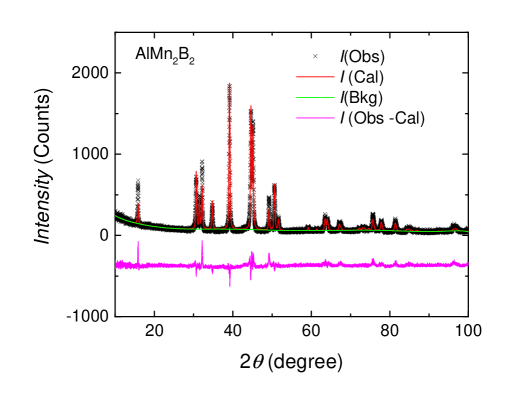
Etched single crystals were finely ground and spread over a zero background silicon wafer sample holder with help of a thin film of Dow Corning high vacuum grease. Powder diffraction data were obtained using a Rigaku Miniflex II diffractometer within a 2 range of 10 - 100∘ with a step of 0.02∘ and dwelling time of 3 seconds for data acquisition. The crystallographic information file from the single crystal XRD solution was used to fit the powder XRD data using GSAS Larson and Dreele (2004) and EXPGUI Toby (2001) software packages. Figure 3 shows the Rietveld refined powder XRD pattern with R factor of 0.08. Being a relatively hard, layered material, texture is visible along [020] direction although March Dollase texture correction was employed to account for this intensity mismatch.
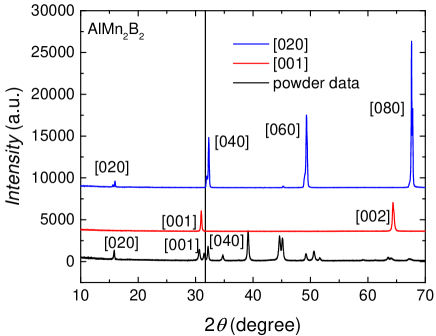
To identify the crystallographic orientation of the AlMn2B2 single crystals, we employed the monochromatic X-ray diffraction from the crystallographic surfaces in the Bragg-Brentano geometry Jesche et al. (2016); Lamichhane et al. (2018). The direction perpendicular to the plate was identified to be [010] since a family of {020} lines were observed in the diffraction pattern as shown in blue curve in Fig. 4. The plate was held vertical and the family of {001} peaks were obtained as shown in red curve of Fig. 4. The monochromatic x-ray surface diffraction peaks were compared with powder diffraction data to correctly identify their directions. A vertical line through the powder [110] peak was used as a reference point of comparison as shown in Fig. 4. Then the last remaining direction was identified to be [100] along the length of the crystals. A reference coordinate system is shown in Fig. 1(b) to demonstrate the crystallographic orientations of AlMn2B2 crystals.
IV Electric and Magnetic properties
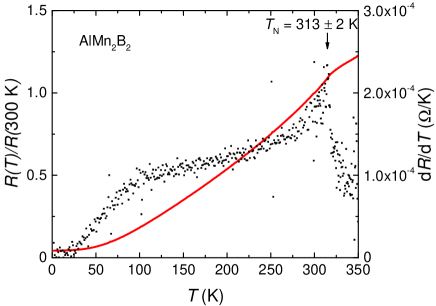
The temperature dependent electrical resistance of AlMn2B2 was measured in a traditional 4 probe measurement on a NaOH etched, rod like sample using an external device control option to interface with a Linear Research, Inc. ac (1 mA, 17 Hz) resistance bridge (LR 700). Thin platinum wires were attached to the sample using DuPont 4929N silver paint to make electrical contact. Quantum Design Magnetic Property Measurement System (MPMS) was used as a temperature controller. The measured temperature dependent electrical resistance of AlMn2B2 is shown in Fig. 5. These data further confirm that our single crystals are essentially stoichiometric AlMn2B2; given that the residual resistivity ratio () is 28.5, there is relatively low disorder scattering. In addition, a very clear feature is seen in both R(T) and at T = 313 2 K. Such features are often related to a loss of spin disorder scattering at a magnetic transition Fisher and Langer (1968). As such, these data are our first suggestion that AlMn2B2 may indeed have some form of magnetic order below 315 K.
The magnetic properties of AlMn2B2 were studied from a base temperature of 2 K to 700 K. Low temperature anisotropic magnetization data of single crystalline AlMn2B2 samples were measured within the temperature range 2 - 350 K using a MPMS. High temperature, anisotropic temperature dependent magnetization data were obtained using a Quantum Design VersaLab Vibrating Sample Magnetometer (VSM) over the temperature range 300 - 700 K in an oven option mode.
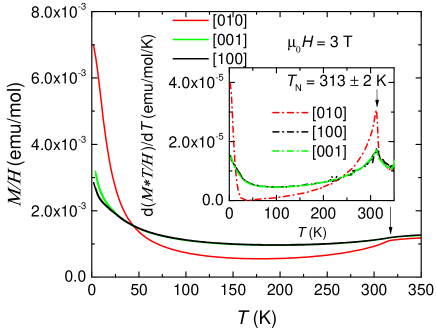
The low temperature anisotropic susceptibility data, with H = 3 T applied field, are presented in Fig. 6. Below 50 K, the magnetization data show a low temperature upturn as reported in a previous literature Chai et al. (2015). In all three directions, there is a clear anomaly in susceptibility data around 312 K. The inset shows as a function of temperature Fisher (1962) showing a clear anomaly around 312 K identifying AlMn2B2 as a AFM material. The observed anomaly in coincides with the kink observed in .
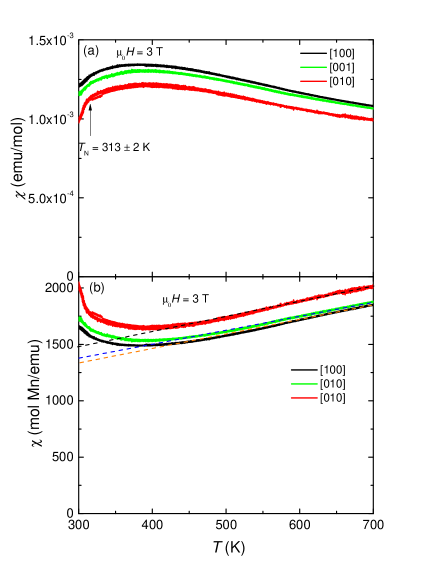
Recently, AlMn2B2 was reported to be AFM however Neel temperature was reported to be around 390 K Potashnikov et al. (2019). To examine higher temperatures, our high temperature susceptibility data, obtained using our VSM are presented in Fig. 7(a) and (b). Although a broad local maximum of the susceptibility around 350 - 390 K for different axes, consistent to reference[Potashnikov et al., 2019] was found, the did not show any anomaly. The only clear and conclusive feature in the high temperature data associated with a magnetic transition is the feature at 313 2 K. The broad local maximum in magnetization well above the transition temperature can be associated with low dimensional, or linear chain anisotropic Heisenberg anitiferromagnetism Ma et al. (2013); Vasil’ev et al. (2000); Kim et al. (1998); Bonner and Fisher (1964); Dingle et al. (1969). The fitted Curie Weiss temperatures for various axes were obtained to be = - 815 K, = - 750 K, and = - 835 K. From the average slope of Curie Weiss plot, the effective moment of Mn is found to be 2.5/Mn.
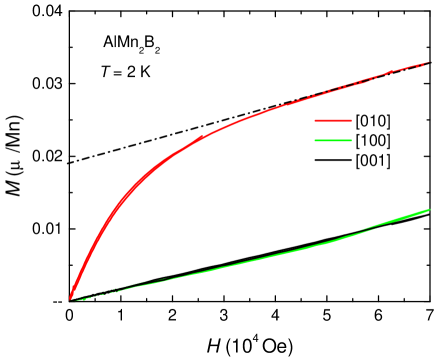
At low temperature, T 50 K, in Fig. 6 there is a clear upturn in the M/H data, particularly for H along the [010] direction. In order to better understand this we measured the anisotropic field dependent magnetization at 2 K as shown in Fig. 8. For fields greater than 4 T the slopes of the M(H) plots are comparable for all three directions. For H [010], there is a roughly 0.02 /Mn offset due to a rapid increase and saturation for H 3 T. The origin of this small, anisotropic contribution is currently not known.
V Nuclear Magnetic resonance Study
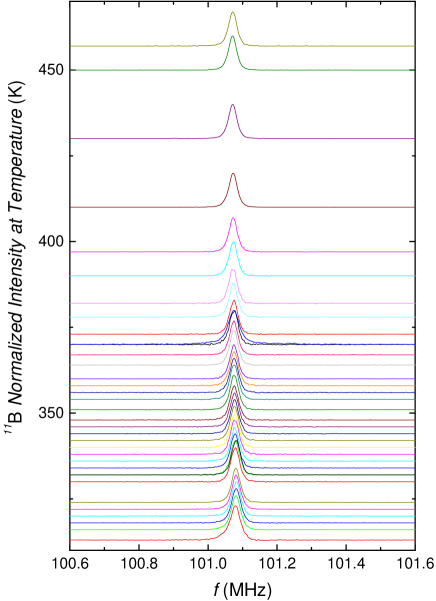
To further investigate the magnetism of AlMn2B2, we carried out 11B NMR measurements at various temperatures between 5 K and 457 K as presented in Figs. 9 - 11. To perform the NMR measurements for the temperature region of T = 5 - 295 K, crushed single crystalline powder was enclosed in a weighing paper folded closed cylindrical tube and inserted inside the NMR coil. For the higher temperature NMR measurements up to 457 K from room temperature, the crushed powder was sealed under atmospheric pressure of Ar inside a 1 mm internal diameter amorphous silica tube. The NMR measurements were carried out using a lab-built phase coherent spin-echo pulsed NMR spectrometer on 11B (nuclear spin I = and gyromagnetic ratio = 13.6552 MHz/T) nuclei in the temperature range 5 T 457 K. NMR spectra were obtained either by Fourier transform of the NMR echo signals, by sweeping frequency or by sweeping magnetic field. Magnetic phase transition was studied analyzing the full width at half maximum (FWHM) of 11B NMR spectra and spin-lattice relaxation rate . The 11B was measured by the conventional single saturation pulse method.
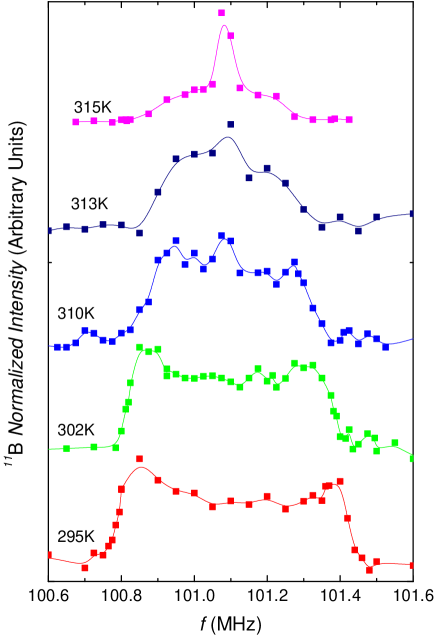
Figure 9 shows the 11B NMR spectra obtained by Fourier transform of the NMR spin echo for temperatures in the range 315 - 457 K at H = 7.4089 T. Throughout the range of study, the FWHM 29 kHz is nearly independent of temperature. On the other hand, below 315 K, as shown in Fig. 10, the 11B NMR line broadens abruptly and has an almost rectangular shape at low temperatures. Since the rectangular shape is characteristic of NMR spectrum in AFM ordered state for powder sample, the results clearly indicate that the magnetic phase transition around 315 K is AFM. Similar rectangular NMR spectra in AFM state have been observed in BiMn2PO6 Nath et al. (2014), NaVGe2O6 Pedrini et al. (2004), CuV2O6 Kikuchi et al. (2000), and BaCo2V2O8 Ideta et al. (2012) .
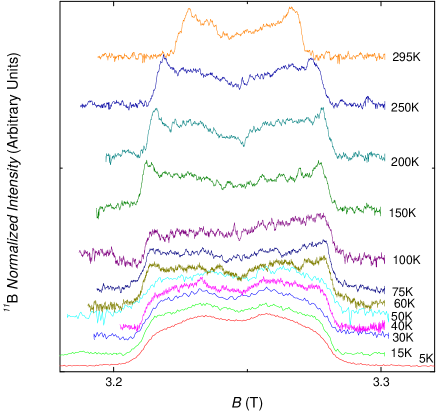
In the low temperature range between 5 - 295 K, several 11B NMR spectra were measured at a frequency of f = 44.32 MHz by sweeping the magnetic field as shown in Fig. 11. The FWHM increases with decreasing temperature and shows nearly constant(0.06 T) down to 50 K. Below 50 K, the FWHM slightly decreases, where the shape of the spectrum changes and the edges of the lines are smeared out. These results suggest a change in magnetic state around 50 K. Although it is not clear at present, it is interesting if the change relates to the strong enhancement of below 50 K as shown in Fig. 6. NMR measurements on single crystals could provide additional information in this issue. This is the future work.
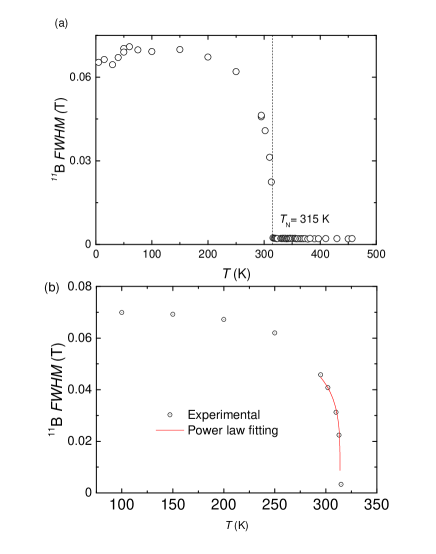
Figure 12(a) shows the temperature variation of the FWHM of the 11B NMR spectra between 5 - 457 K. Since the FWHM of the powder NMR spectrum in AFM state corresponds to the twice of the hyperfine field() at the B site produced by Mn ordered moments, the temperature dependence of FWHM reflects the temperature dependence of the Mn sub-lattice magnetization. Therefore, one can obtain the critical exponent () of the order parameter using the formula . The maximum value of with = 314 K was obtained by fitting the data points in the range 295 K - 315 K close to as shown in Fig. 12(b). Very nominal change was observed in the fitted parameter with the extension of fitted range toward the low temperature. The observed change in critical exponent was within the error bar for all the temperature range. This power law fittings of FWHM provided lower value of (for 3D Heisenberg model ) suggesting a low dimensional magnetism as discussed in reference[Ma et al., 2013].
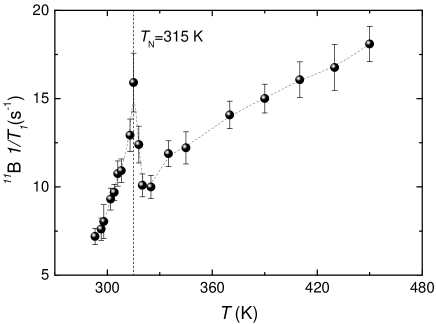
To study the dynamical properties of the Mn spins in high temperature range, the spin lattice relaxation rates () at the 11B site were measured from room temperature to 457 K. Figure 13 shows the temperature dependence of where shows a clear peak at 315 K, evidencing again the AFM ordering. On the other hand, no clear anomaly in the temperature dependence of is observed around 390 K where the magnetic susceptibility exhibits a broad local maximum. Therefore, the broad maximum in the magnetic susceptibility is not associated with a magnetic ordering, but it could be attributed to a two dimensional magnetic character in AlMn2B2 as observed in 2D AFM compounds such as BaMN2Si2O7 Ma et al. (2013).
VI Conclusions
Structural, electrical transport and magnetic properties were studied on self flux grown single crystalline AlMn2B2 samples. All these measurements revealed that AlMn2B2 as an AFM compound with a transition temperature around 3132 K. At higher temperature broad hump, well above the transition temperature, could be the signature of low dimensional magnetic interaction in AlMn2B2 above the room temperature.
VII Acknowledgement
Dr. Warren Straszheim is acknowledged for doing SEM on various samples. This research was supported by the Critical Materials Institute, an Energy Innovation Hub funded by the U.S. Department of Energy, Office of Energy Efficiency and Renewable Energy, Advanced Manufacturing Office. This work was also supported by the office of Basic Energy Sciences, Materials Sciences Division, U.S. DOE. This work was performed at the Ames Laboratory, operated for DOE by Iowa State University under Contract No. DE-AC02-07CH11358.
References
- Du et al. (2015) Qianheng Du, Guofu Chen, Wenyun Yang, Jianzhong Wei, Muxin Hua, Honglin Du, Changsheng Wang, Shunquan Liu, Jingzhi Han, Yan Zhang, and Jinbo Yang, “Magnetic frustration and magnetocaloric effect in AlFe2-xMnxB2(x= 0–0.5) ribbons,” Journal of Physics D: Applied Physics 48, 335001 (2015).
- Tan et al. (2013) Xiaoyan Tan, Ping Chai, Corey M. Thompson, and Michael Shatruk, “Magnetocaloric Effect in AlFe2B2: Toward Magnetic Refrigerants from Earth-Abundant Elements,” Journal of the American Chemical Society 135, 9553–9557 (2013), pMID: 23731263, https://doi.org/10.1021/ja404107p .
- Lamichhane et al. (2018) Tej N. Lamichhane, Li Xiang, Qisheng Lin, Tribhuwan Pandey, David S. Parker, Tae-Hoon Kim, Lin Zhou, Matthew J. Kramer, Sergey L. Bud’ko, and Paul C. Canfield, “Magnetic properties of single crystalline itinerant ferromagnet ,” Phys. Rev. Materials 2, 084408 (2018).
- Barua et al. (2018) R. Barua, B.T. Lejeune, L. Ke, G. Hadjipanayis, E.M. Levin, R.W. McCallum, M.J. Kramer, and L.H. Lewis, “Anisotropic magnetocaloric response in AlFe2B2,” Journal of Alloys and Compounds 745, 505 – 512 (2018).
- Chai et al. (2015) Ping Chai, Sebastian A. Stoian, Xiaoyan Tan, Paul A. Dube, and Michael Shatruk, “Investigation of magnetic properties and electronic structure of layered-structure borides AlT2B2 (T=Fe, Mn, Cr) and AlFe2-xMnxB2,” Journal of Solid State Chemistry 224, 52 – 61 (2015).
- Ke et al. (2017) Liqin Ke, Bruce N. Harmon, and Matthew J. Kramer, “Electronic structure and magnetic properties in (=Fe, Mn, Cr, Co, and Ni) and their alloys,” Phys. Rev. B 95, 104427 (2017).
- Potashnikov et al. (2019) D. Potashnikov, E.N. Caspi, A. Pesach, A. Hoser, S. Kota, L. Verger, M.W. Barsoum, I. Felner, A. Keren, and O. Rivin, “Magnetic ordering in the nano-laminar ternary Mn2AlB2using neutron and X-ray diffraction,” Journal of Magnetism and Magnetic Materials 471, 468 – 474 (2019).
- Verger et al. (2018) L. Verger, S. Kota, H. Roussel, T. Ouisse, and M. W. Barsoum, “Anisotropic thermal expansions of select layered ternary transition metal borides: MoAlB, Cr2AlB2, Mn2AlB2, and Fe2AlB2,” Journal of Applied Physics 124, 205108 (2018).
- Belashchenko et al. (2015) Kirill D. Belashchenko, Liqin Ke, Markus Dane, Lorin X. Benedict, Tej Nath Lamichhane, Valentin Taufour, Anton Jesche, Sergey L. Bud’ko, Paul C. Canfield, and Vladimir P. Antropov, “Origin of the spin reorientation transitions in (Fe1-xCox)2B alloys,” Applied Physics Letters 106, 062408 (2015), https://doi.org/10.1063/1.4908056 .
- Canfield and Fisher (2001) Paul C. Canfield and Ian R. Fisher, “High-temperature solution growth of intermetallic single crystals and quasicrystals,” Journal of Crystal Growth , 155 – 161 (2001).
- Meier et al. (2017) W. R. Meier, T. Kong, S. L. Bud’ko, and P. C. Canfield, “Optimization of the crystal growth of the superconductor CaKFe4As4 from solution in the FeAS - CaFe2As2 - KFe2As2 system,” Phys. Rev. Materials 1, 013401 (2017).
- Canfield et al. (2016) Paul C. Canfield, Tai Kong, Udhara S. Kaluarachchi, and Na Hyun Jo, “Use of frit-disc crucibles for routine and exploratory solution growth of single crystalline samples,” Philosophical Magazine 96, 84 – 92 (2016).
- Lamichhane et al. (2016) Tej N. Lamichhane, Valentin Taufour, Morgan W. Masters, David S. Parker, Udhara S. Kaluarachchi, Srinivasa Thimmaiah, Sergey L. Bud’ko, and Paul C. Canfield, “Discovery of ferromagnetism with large magnetic anisotropy in ZrMnP and HfMnP,” Applied Physics Letters 109, 092402 (2016).
- Larson and Dreele (2004) A. C. Larson and R. B. Von Dreele, “General structure analysis system,” Los Alamos National Laboratory Report No. LAUR 86-748 (2004).
- Toby (2001) Brian H. Toby, “EXPGUI, a graphical user interface for GSAS,” Journal of Applied Crystallography 34, 210–213 (2001).
- Jesche et al. (2016) A. Jesche, M. Fix, A. Kreyssig, W. R. Meier, and P. C. Canfield, “X-ray diffraction on large single crystals using a powder diffractometer,” Philosophical Magazine 96, 2115–2124 (2016), https://doi.org/10.1080/14786435.2016.1192725 .
- Fisher and Langer (1968) Michael E. Fisher and J. S. Langer, “Resistive anomalies at magnetic critical points,” Phys. Rev. Lett. 20, 665–668 (1968).
- Fisher (1962) Michael E. Fisher, “Relation between the specific heat and susceptibility of an antiferromagnet,” The Philosophical Magazine: A Journal of Theoretical Experimental and Applied Physics 7, 1731–1743 (1962), https://doi.org/10.1080/14786436208213705 .
- Ma et al. (2013) J. Ma, C. D. Dela Cruz, Tao Hong, W. Tian, A. A. Aczel, Songxue Chi, J.-Q. Yan, Z. L. Dun, H. D. Zhou, and M. Matsuda, “Magnetic phase transition in the low-dimensional compound BaMn2Si2O7,” Phys. Rev. B 88, 144405 (2013).
- Vasil’ev et al. (2000) A.N Vasil’ev, L.A Ponomarenko, H Manaka, I Yamada, M Isobe, and Y Ueda, “Quasi-one-dimensional antiferromagnetic spinel compound LiCuVO4,” Physica B: Condensed Matter 284-288, 1619 – 1620 (2000).
- Kim et al. (1998) Y.J. Kim, M. Greven, U.-J. Wiese, and R.J. Birgeneau, “Monte-carlo study of correlations in quantum spin chains at non-zero temperature,” The European Physical Journal B - Condensed Matter and Complex Systems 4, 291–297 (1998).
- Bonner and Fisher (1964) Jill C. Bonner and Michael E. Fisher, “Linear magnetic chains with anisotropic coupling,” Physical Review 135, 640 –658 (1964).
- Dingle et al. (1969) R. Dingle, M. E. Lines, and S. L. Holt, “Linear-Chain Antiferromagnetism in [N] [Mn],” Phys. Rev. 187, 643–648 (1969).
- Nath et al. (2014) R. Nath, K. M. Ranjith, B. Roy, D. C. Johnston, Y. Furukawa, and A. A. Tsirlin, “Magnetic transitions in the spin- frustrated magnet and strong lattice softening in and below 200 K,” Phys. Rev. B 90, 024431 (2014).
- Pedrini et al. (2004) B. Pedrini, J. L. Gavilano, D. Rau, H. R. Ott, S. M. Kazakov, J. Karpinski, and S. Wessel, “NMR and dc susceptibility studies of ,” Phys. Rev. B 70, 024421 (2004).
- Kikuchi et al. (2000) Jun Kikuchi, Kazuhiro Ishiguchi, Kiyoichiro Motoya, Masayuki Itoh, Kazunori Inari, Naotoshi Eguchi, and Jun Akimitsu, “NMR and Neutron Scattering Studies of Quasi One-Dimensional Magnet CuV2O6,” Journal of the Physical Society of Japan 69, 2660–2668 (2000).
- Ideta et al. (2012) Yukiichi Ideta, Yu Kawasaki, Yutaka Kishimoto, Takashi Ohno, Yoshitaka Michihiro, Zhangzhen He, Yutaka Ueda, and Mitsuru Itoh, “51V NMR study of antiferromagnetic state and spin dynamics in quasi-one-dimensional BaCo2V2O8,” Phys. Rev. B 86, 094433 (2012).