Magnetic structure and spin waves in the frustrated ferro-antiferromagnet Pb2VO(PO4)2
Abstract
Single crystal neutron diffraction, inelastic neutron scattering and electron spin resonance experiments are used to study the magnetic structure and spin waves in Pb2VO(PO4)2, a prototypical layered ferromagnet with frustrating next nearest neighbor antiferromagnetic interactions. The observed excitation spectrum is found to be inconsistent with a simple square lattice model previously proposed for this material. At least four distinct exchange coupling constants are required to reproduce the measured spin wave dispersion. The degree of magnetic frustration is correspondingly revised and found to be substantially smaller than in all previous estimates.
pacs:
I Introduction
In classical spin systems, geometric frustration is usually resolved by the “least frustrated” magnetically ordered state. The actual ground state spin configuration depends on the type and strength of frustration. As a function of this parameter, one expects transitions between different ordered phases. These “classical” transition points are a promising area to look for novel quantum phases and excitations.Starykh (2015) A case in point is the Heisenberg ferromagnet on a square lattice frustrated by antiferromagnetic (AF) next-nearest neighbor coupling. The classical model is either a collinear ferromagnet or a “columnar” AF (CAF) structure. The quantum model near the transition between these classical states, for , is predicted to be a so-called spin nematic.Shannon et al. (2006); Ueda and Totsuka (2007); Shindou et al. (2013) This exotic quantum phase shows no conventional dipolar magnetic order but features spontaneously anisotropic quantum spin fluctuations. In strong enough applied fields a nematic phase is supported for all .Ueda and Momoi (2013); Ueda (2015)
To this day, the only known potential experimental realizations of the ferro-antiferromagnet square lattice model are among layered vanadophosphates.Tsirlin and Rosner (2009) Our understanding of these compounds is far from complete though, since most experiments to date were done on powder samples. The only neutron work reported to date is on Pb2VO(PO4)2, which is perhaps the most thoroughly studied member of the series.Skoulatos et al. (2007, 2009) These powder neutron diffraction experiments confirmed a magnetically ordered CAF structure. The exchange constants meV and meV were first estimated from magnetic susceptibility data.Kaul et al. (2004) These values are reasonably consistent with the frustration ratio deduced from quasielastic diffuse magnetic neutron scattering assuming a perfect square lattice model:Skoulatos et al. (2009) . Pb2VO(PO4)2 was also probed by Q-band electron spin resonance (ESR) Förster et al. (2013), NMR Nath et al. (2009) and magnetometry as well as specific heat Kaul (2005) experiments on small single crystal samples. The consensus was that this compound is a good “baseline” ferro-antiferromagnet square lattice system, substantially frustrated but still in the classical CAF phase.
By their nature, previous bulk measurements and powder neutron diffraction experiments were unable to assess just how well Pb2VO(PO4)2 corresponds to the ferro-antiferromagnet square lattice model in the first place. This is a valid point of concern, since the material is monoclinic rather than tetragonal. Therefore, the spins no longer form a perfect square. The spin arrangement is not even rectangular. There are as many as four atoms per crystallographic unit cell with several inequivalent bonds between them. In the present work we report the results of high-field ESR, neutron diffraction and inelastic neutron scattering measurements on single crystal samples of this compound. We show that excitations deviate significantly from those in a square lattice columnar state and require at least four distinct exchange constants to describe them. In addition, we accurately determine the direction and magnitude of the ordered moment at low temperatures and confirm the exceptional magnetic two-dimensionality of this material. We conclude that it indeed features ferro-antiferromagnet frustration, but deviates substantially from a simplistic square-lattice description.
II Experimental
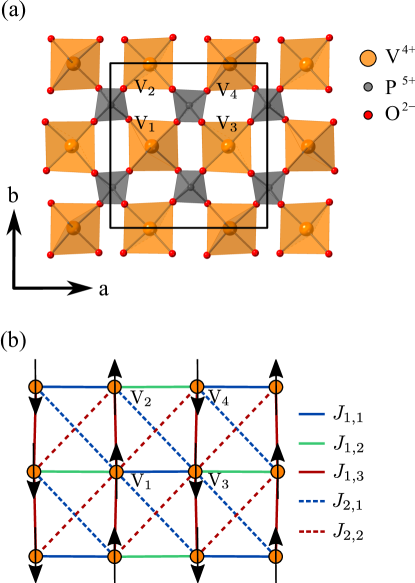
Pb2VO(PO4)2 crystallizes in space group P121/a1 (No.14) with lattice parameters a=8.747(4), b=9.016(5), c=9.863(9) Å, =100.96(4)∘.Shpanchenko et al. (2006) Each unit cell contains four formula units. The crystal structure features layers of VO5 pyramids connected through PO4 tetrahedra in the plane [Fig. 1(a)]. The V-layers are separated by phosphate tetrahedra and lead ions. Within each layer, symmetry allows for three distinct nearest neighbor (denoted , and , respectively) and two next-nearest neighbor ( and ) interactions, as shown in Fig. 1(b). The exchange paths for nearest neighbor ferromagnetic interactions as well as next-nearest neighbor antiferromagnetic exchanges both run through two bridging oxygen atoms. The individual V-O-O bridging angles along the ferromagnetic and antiferromagnetic exchange paths are in the ranges of 100 to 120 degrees and 160 to 180 degrees respectively.Shpanchenko et al. (2006)
Powders of Pb2(VO)(PO4)2 were synthesized in an Ar-flow muffle furnace using stoichiometric amounts of high-purity commercially available precursors of PbO(99.999%), NH4H2PO4(99.999%), V2O3(99.99%) and V2O5(99.99%)(Sigma-Aldrich111The identification of any commercial product or trade name does not imply endorsement or recommendation by the National Institute of Standards and Technology.). Single crystals were grown in a quartz tube using the self-flux Bridgman method in a modified vertical muffle furnace. During the growing period, care was taken to prevent ingress of oxygen. For neutron diffraction measurements we employed a 23 mg single crystal sample with mosaic spread of 0.6∘ full width at half maximum. Inelastic neutron scattering was done on a 1.5 g single crystal sample with 0.6∘ mosaic spread. For ESR experiments single-crystalline samples of Pb2(VO)(PO4)2 with typical sizes of 3x3x1 mm3 were used.
The magnetic structure was determined on the CEA-CRG D23 diffractometer at ILL using neutrons of a wavelength Å. Sample environment was a standard orange cryostat. A pyrolytic graphite filter was used to suppress higher harmonics. Magnetic ordering corresponds to a propagation vector (recall that there are 4 magnetic atoms per unit cell). As a result, many magnetic Bragg reflections coincide with nuclear peaks. Magnetic reflections for which this was not the case were measured in usual rocking scans at 1.5 K counting about 45 s/point. For the remaining magnetic reflections we first measured the rocking curve of the underlying nuclear peak at K. Each scan was then analyzed using a Gaussian fit. Subsequently, the combined nuclear and magnetic contributions were measured at K in short rocking scans near the top of the peak counting about 60 s/point. To extract the magnetic contribution, these scans were fit using peak profiles of the same width as determined for the underlying nuclear peak above .
Spin wave excitations in Pb2VO(PO4)2 were measured using the Multi-Angle Crystal Spectrometer (MACS) at NIST Rodriguez et al. (2008) and the IN12 3-axis instrument at ILL.Schmalzl et al. (2016) In both cases the final neutron energy was fixed at Ef=3.7 meV. Higher-order beam contamination was suppressed by a cooled BeO filter on MACS and a cooled Be filter on IN12 after the sample. No collimators were used in either of the setups. Both experiments were performed at the base temperature of a dilution refrigerator below 0.1 K. The scattering planes were and on MACS and IN12, respectively. The tabulated(MACS) and measured(IN12) energy resolution at the elastic position was correspondingly 0.17 meV and 0.12 meV full width at half maximum. On MACS the data were collected in constant-energy slices at 0.5, 1, 1.5, 1.75, 2 and 2.25 meV energy transfer. Each slice was taken by scanning the scattering angle in the typical range to with steps and the sample rotation angle in range with steps, while typically counting s at each setting. IN12 data were taken in a series of constant- scans centered along the , , and reciprocal-space rods with typical steps of 0.025 meV in energy transfer and counting about 120 s/point.
The high-field ESR measurements were performed employing a 16 T transmission-type ESR spectrometer, similar to that described in Ref. Zvyagin et al., 2004. In our experiments, a set of VDI microwave sources was used, allowing us to probe magnetic excitations in a very broad, quasi-continuously covered frequency range from approximately 50 to 400 GHz. The experiments were done in the Faraday and Voigt configurations with magnetic field applied along the , , and axes (where the is the direction perpendicular to the plane) at a temperature of 1.4 K.
III Results
III.1 Diffraction
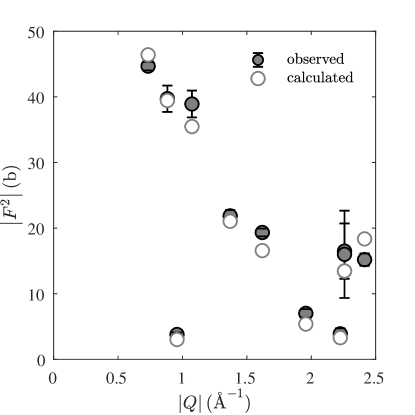
The magnetic structure at T = 1.5 K was determined from an analysis of 11 measured magnetic reflections. These were normalized using the scale factor obtained from the least-square fitting of 22 nuclear Bragg peaks measured intensities (R-factor 4.2 %). A refinement, also using the FULLPROF SUITE packageRodríguez-Carvajal (1993) yielded a unique solution, a collinear CAF-type spin arrangement with moments along the crystallographic axis [Fig. 1(b)]. The resulting magnetic structure factors are plotted against wave vector in Fig. 2, solid symbols. The relative alignment of spins from adjacent V-planes is ferromagnetic. The final R-factor was 5.7%. The ordered moment was determined to be 0.68(1) per site. The calculated structure factors are plotted in open symbols in Fig. 2 for a direct comparison with experiment.
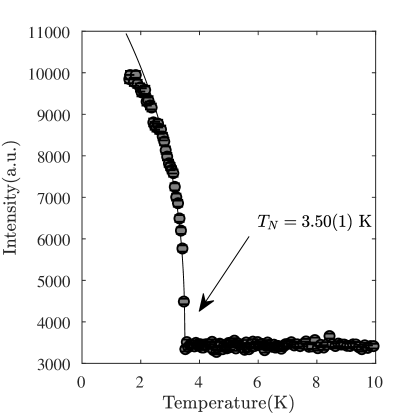
In Fig. 3 we show the temperature dependence of neutron intensity measured at the position of a purely magnetic Bragg reflection. A simplistic power law fit in the temperature range K yields an ordering temperature of K and a crude estimate of the order parameter exponent .
III.2 Inelastic scattering
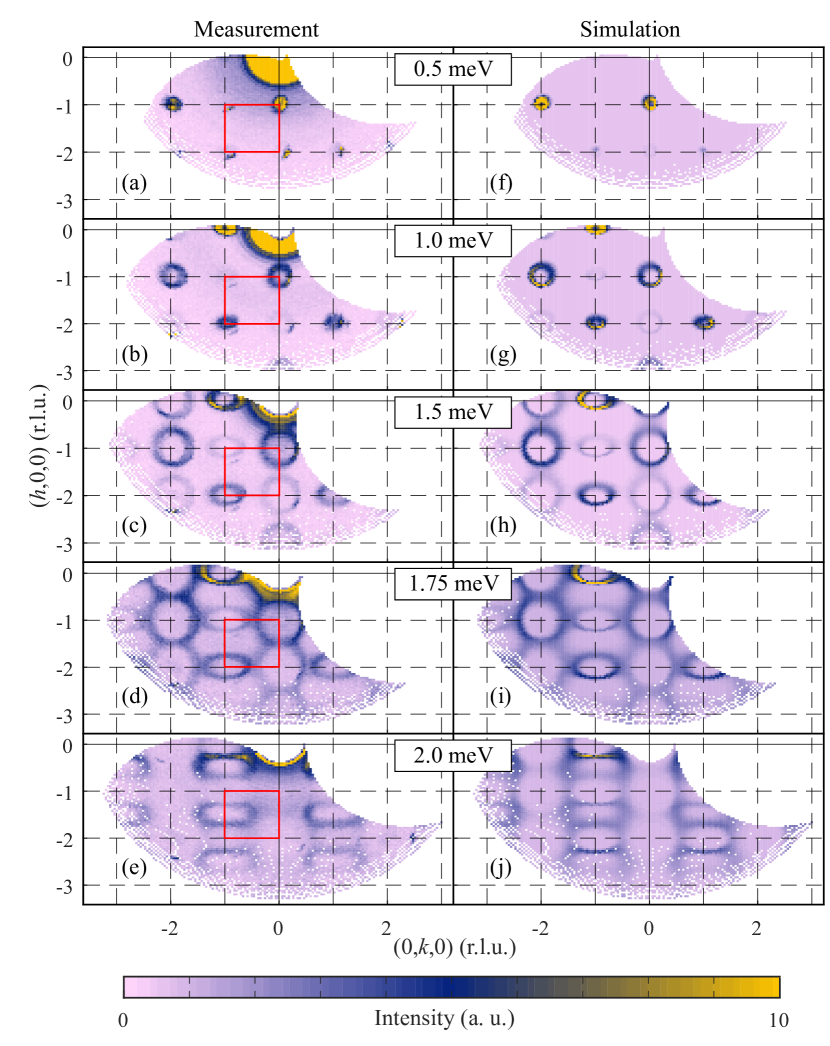
The first column in Fig. 4 shows false color plots of inelastic neutron intensities measured in Pb2VO(PO4)2 at different energy transfers at the MACS instrument. These spectra were modeled using linear spin wave theory, assuming a Heisenberg hamiltonian with five distinct in-plane exchange constants as depicted in Fig. 1(b). The coupling between V-layers was assumed to be negligible, and all excitation widths were assumed to be resolution limited. The spin wave energies and structure factors were calculated using the program SpinW.Toth and Lake (2015) The neutron polarization factors were based on the collinear magnetic structure described above. The magnetic form factor for V4+ was taken in the dipolar approximation as calculated in Ref. Wilson and Prince, 1992. The thus computed inelastic magnetic neutron scattering cross section was numerically folded with the resolution function of the instrument calculated using the ResLib program.Zheludev (2009) The resolution calculation was done within the Popovici approximation.Popovici (1975) The data collected at all energy transfers were fit simultaneously. However, since the process is rather computation intensive, all fits were restricted to a single Brillouin zone shown as a red rectangle at each energy in Fig. 4. The parameters were the five exchange constants, an overall intensity prefactor and a separate constant background at each energy transfer. Treating the exchange constants and as independent did not meaningfully improve the quality of the fits. Since they correspond to V-V bond lengths that are practically equal (but not identical by symmetry), in our final analysis they were constrained to be equal. An excellent fit is obtained with parameter values listed in Table 1. This set of Heisenberg exchange constants provides a very good description not only of the data in the target Brillouin zone, but also of that in the entire experimental range of momentum transfers. Intensities simulated using our fitting model and the final parameter set are shown in false color plots in the right column of Fig. 4.
| Bond | V-V-distance(Å) | (meV) |
|---|---|---|
| 4.42 | -0.286(2) | |
| 4.66 4.67 | -0.389(2) | |
| 6.27 | 1.453(3) | |
| 6.30 | 0.538(2) |
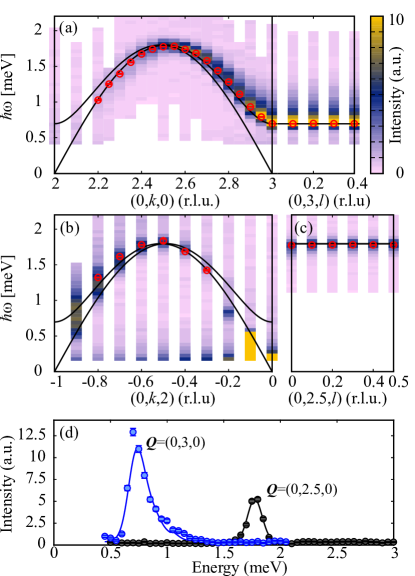
The inelastic intensities collected on IN12 are shown in the false color plots of Fig. 5. In their analysis we also employed a combination of SpinW and ResLib, but chose to fit every energy scan separately. To account for resolution (focusing) effects, the spin wave dispersion was calculated using parameters values in Table 1. To independently extract the excitation energy in each scan, we allowed for an additional energy offset relative to this calculated dispersion. A flat background and an intensity scale factor were the two other parameters. The thus obtained spin wave energies are shown as open circles in Fig. 5. The solid lines are a dispersion calculation based on parameters in Table 1. We see an almost perfect agreement. The IN12 data re-affirm the determined values of in-plane exchange constants. In addition, they confirm a total lack of dispersion perpendicular to the planes. From our analysis we can estimate the corresponding bandwidth to be smaller than 20 eV.
III.3 ESR
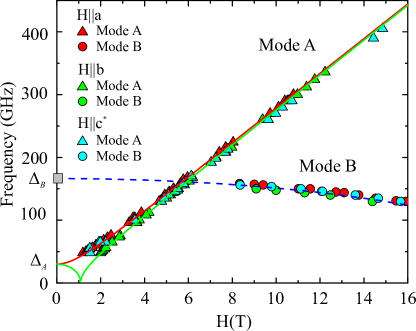
High-field ESR experiments revealed two ESR modes, whose frequency-field diagrams are shown in Fig. 6. The frequency-field dependence of mode A can be fit using the equation , where is the Planck constant, is the excitation frequency, is the Bohr magneton, and is the factor. The fit results are shown in Fig. 6 by the red and green solid lines, indicating a zero-field gap GHz ( meV), which is present in Pb2VO(PO4)2 presumably due to a finite in-plane anisotropy. Mode B can be identified as an exchange mode with a gap GHz ( meV), extrapolated from the frequency-field dependence. The gap size is in excellent agreement with results of inelastic neutron scattering (Fig. 5).
IV Discussion
While our results confirm the two-dimensional nature and a CAF-type magnetic structure for Pb2VO(PO4)2, they also unambiguously show that a square lattice description with only two exchange parameters is insufficient to describe the magnetism in this compound. The nearest-neighbor coupling constants are indeed all ferromagnetic, but alternate substantially along the axis. The most significant consequence is the splitting of the spin wave spectrum into two separate branches as seen in Fig. 5. This produces an additional gapped excitation at each zone-center, as also seen with ESR.Schmidt et al. (2010) Next-nearest-neighbor interactions are AF, but differ by almost a factor of three along the two diagonals.
Our data also show that the material is less frustrated than originally thought. A good measure of frustration is the ratio , where is the sum of absolute values all exchange constants and is the classical ground state energy. In all cases with corresponding to an absence of frustration. For the ferro-antiferromagnet square lattice CAF, . In our exchange model for Pb2VO(PO4)2, and . Previous estimates based on an assumed square lattice modelTsirlin et al. (2009) correspond to a stronger frustration . A weak frustration in Pb2VO(PO4)2 is consistent with a rather large observed ordered moment. The latter is similar to that found in strongly 2-dimensional but unfrustrated AFs such as the cuprates.Tranquada and Shirane (1989)
V Conclusion
While Pb2VO(PO4)2 and probably all related layered vanadophosphates are indeed highly 2-dimensional and feature competing ferromagnetic and antiferromagnetic interactions the actual spin Hamiltonian in these systems may be more sensitive to structural details than originally thought.
Acknowledgements.
Access to MACS was provided by the Center for High Resolution Neutron Scattering, a partnership between the National Institute of Standards and Technology and the National Science Foundation under Agreement No. DMR-1508249. This work was supported by the Deutsche Forschungsgemeinschaft through the projects ZV6/2-2, SFB 1143, and the Würzburg-Dresden Cluster of Excellence on Complexity and Topology in Quantum Matter - (EXC 2147, project-id 39085490). We acknowledge support by the HLD at HZDR, member of the European Magnetic Field Laboratory (EMFL). This work was also supported by the Swiss State Secretariat for Education, Research and Innovation (SERI) through a CRG-grant. This work is partially supported by the Swiss National Science Foundation under Division II. The authors would like to thank K. Povarov for fruitful discussions.References
- Starykh (2015) O. A. Starykh, Reports on Progress in Physics 78, 052502 (2015).
- Shannon et al. (2006) N. Shannon, T. Momoi, and P. Sindzingre, Phys. Rev. Lett. 96, 027213 (2006).
- Ueda and Totsuka (2007) H. T. Ueda and K. Totsuka, Phys. Rev. B 76, 214428 (2007).
- Shindou et al. (2013) R. Shindou, S. Yunoki, and T. Momoi, Phys. Rev. B 87, 054429 (2013).
- Ueda and Momoi (2013) H. T. Ueda and T. Momoi, Phys. Rev. B 87, 144417 (2013).
- Ueda (2015) H. T. Ueda, Journal of the Physical Society of Japan 84, 023601 (2015).
- Tsirlin and Rosner (2009) A. A. Tsirlin and H. Rosner, Phys. Rev. B 79, 214417 (2009).
- Skoulatos et al. (2007) M. Skoulatos, J. P. Goff, N. Shannon, E. E. Kaul, C. Geibel, A. P. Murani, M. Enderle, and A. R. Wildes, Journal of Magnetism and Magnetic Materials 310, 1257 (2007).
- Skoulatos et al. (2009) M. Skoulatos, J. P. Goff, C. Geibel, E. E. Kaul, R. Nath, N. Shannon, B. Schmidt, A. P. Murani, P. P. Deen, M. Enderle, and A. R. Wildes, Europys. Lett. 88, 57005 (2009).
- Kaul et al. (2004) E. E. Kaul, H. Rosner, N. Shannon, R. V. Shpanchenko, and C. Geibel, Journal of Magnetism and Magnetic Materials (2004), 10.1016/j.jmmm.2003.12.002.
- Förster et al. (2013) T. Förster, F. A. Garcia, T. Gruner, E. E. Kaul, B. Schmidt, C. Geibel, and J. Sichelschmidt, Phys. Rev. B 87, 180401(R) (2013).
- Nath et al. (2009) R. Nath, Y. Furukawa, F. Borsa, E. E. Kaul, M. Baenitz, C. Geibel, and D. C. Johnston, Phys. Rev. B 80, 214430 (2009).
- Kaul (2005) E. E. Kaul, Experimental Investigation of New Low-Dimensional Spin Systems in Vanadium Oxides, Ph.D. thesis, Technische Universität Dresden (2005).
- Shpanchenko et al. (2006) V. Shpanchenko, E. E. Kaul, C. Geibel, and E. V. Antipov, Acta Crystallog. C 62, 88 (2006).
- Note (1) The identification of any commercial product or trade name does not imply endorsement or recommendation by the National Institute of Standards and Technology.
- Rodriguez et al. (2008) J. A. Rodriguez, D. M. Adler, P. C. Brand, C. Broholm, J. C. Cook, C. Brocker, R. Hammond, Z. Huang, P. Hundertmark, J. W. Lynn, N. C. Maliszewskyj, J. Moyer, J. Orndorff, D. Pierce, T. D. Pike, G. Scharfstein, S. A. Smee, and R. Vilaseca, Measurement Science and Technology 19, 034023 (2008).
- Schmalzl et al. (2016) K. Schmalzl, W. Schmidt, S. Raymond, H. Feilbach, C. Mounier, B. Vettard, and T. Brückel, Nuclear Instruments and Methods in Physics Research Section A: Accelerators, Spectrometers, Detectors and Associated Equipment 819, 89 (2016).
- Zvyagin et al. (2004) S. Zvyagin, J. Krzystek, P. van Loosdrecht, G. Dhalenne, and A. Revcolevschi, Physica B: Condensed Matter 346-347, 1 (2004), proceedings of the 7th International Symposium on Research in High Magnetic Fields.
- Rodríguez-Carvajal (1993) J. Rodríguez-Carvajal, Physica B: Condensed Matter 192, 55 (1993).
- Toth and Lake (2015) S. Toth and B. Lake, Journal of Physics: Condensed Matter 27, 166002 (2015).
- Wilson and Prince (1992) A. Wilson and E. Prince, eds., International Tables for Crystallography, Vol. C (Kluwer Academic Publishers, Dordrecht, Boston, London, 1992).
- Zheludev (2009) A. Zheludev, “Reslib resolution library for matlab,” http://www.neutron.ethz.ch/research/resources/reslib (2009).
- Popovici (1975) M. Popovici, Acta Cryst. A31, 507 (1975).
- Bettler et al. (2018) S. Bettler, Y. Feng, S. Gvasaliya, F. Landolt, S. Raymond, and A. Zheludev, “Spin excitations in Pb2VO(PO4)2 single crystals,” Institut Laue-Langevin (ILL) (2018), 10.5291/ILL-DATA.CRG-2513.
- Schmidt et al. (2010) B. Schmidt, M. Siahatgar, and P. Thalmeier, Phys. Rev. B 81, 165101 (2010).
- Tsirlin et al. (2009) A. A. Tsirlin, B. Schmidt, Y. Skourski, R. Nath, C. Geibel, and H. Rosner, Phys. Rev. B 80, 132407 (2009).
- Tranquada and Shirane (1989) J. Tranquada and G. Shirane, Physica C: Superconductivity and its Applications 162-164, 849 (1989).