2018/08/13\Accepted2019/01/15
line: identification — galaxies: individual (NGC 1068, NGC 253, and IC 342) — galaxies: Seyfert — galaxies: starburst — radio lines: galaxies
A molecular line survey toward the nearby
galaxies NGC 1068, NGC 253, and IC 342 at 3 mm
with the Nobeyama 45 m radio telescope:
The data
Abstract
We present observational data of a molecular line survey toward the nearby galaxies NGC 1068, NGC 253, and IC 342 at the wavelengths of 3 mm (85–116 GHz) obtained with the Nobeyama 45 m radio telescope. In IC 342 the line survey with high spectral resolution at the 3 mm region was reported for the first time. NGC 1068 is a nearby gas-rich galaxy with X-rays from an active galactic nucleus (AGN), and NGC 253 and IC 342 are nearby gas-rich galaxies with prototypical starbursts. These galaxies are useful to study the impacts of X-rays and ultraviolet radiation on molecular abundances. The survey was carried out with the resulting rms noise level of a few mK (). As a result we could obtain almost complete data of these galaxies at the 3 mm region: We detected 19–23 molecular species depending on the galaxies including several new detections (e.g., cyclic-C3H2 in IC 342). We found that the intensities of HCN, CN, and HC3N relative to 13CO are significantly strong in NGC 1068 compared to those in NGC 253 and IC 342. On the other hand, CH3CCH was not detected in NGC 1068. We obtained these results with the narrow beam (15′′.2–19′′.1) of the 45 m telescope among the single-dish telescopes, and in particular selectively observed the molecular gas close to the circumnuclear disk (CND) in NGC 1068. Our line intensities in NGC 1068 were compared to those obtained with the IRAM 30 m radio telescope already reported. As a result, the intensity ratio of each line was found to have information on the spatial distribution. Our observations obtained the line intensities and stringent constraints on the upper limit for the three galaxies with such narrow beam, and consequently, the data will be a basis for further observations with high spatial resolution.
1 Introduction
Recent progress of radio telescopes and related instruments enabled us observations with high sensitivity and with wide-band spectroscopy. The progress of receivers, intermediate frequency (IF) systems, analog-to-digital (AD) converters, and digital spectrometers achieved, for example, simultaneous observations of 16 GHz bandwidth in total for upper and lower sidebands. As a result, our knowledge of interstellar molecules and atoms are drastically increasing. Spectral lines of them are indispensable as probes of astrophysical phenomena, in particular, deep inside of dust obscured regions, and such lines are also indispensable for astrochemical and astrobiological studies.
So far 200 molecular species have been detected in interstellar space and circumstellar envelopes (e.g., The Cologne Database for Molecular Spectroscopy: CDMS, Müller et al. 2001, 2005; Endres et al. 2016). Significant fraction of them has also been detected in external galaxies. Galaxies show a wide range of environments such as active galactic nuclei (AGNs), starbursts, arm-interarms, bars, mergers, different metallicity and so on. Effects of such environments on molecular and atomic gas are quite interesting to probe such environments themselves and to study their chemistry, which seems to be different from those in quiescent Galactic objects. In particular, AGNs and starbursts are quite energetic phenomena, which do not exist in our Galaxy. The effects of such energetic environments on molecules and atoms are important topics to search for good probes of AGNs and/or starbursts, and to study molecular and atomic processes with X-rays and ultraviolet radiation. Many observational studies of such environments have already been reported (e.g., Jackson et al. 1993; Kohno et al. 1996, 2003; Usero et al. 2004; van der Werf et al. 2010; Rangwala et al. 2011; Nakajima et al. 2011; Aladro et al. 2013; Izumi et al. 2013; García-Burillo et al. 2014; Takano et al. 2014; Rangwala et al. 2014; Viti et al. 2014; Aladro et al. 2015; Martín et al. 2015; Nakajima et al. 2015; Izumi et al. 2016a; Imanishi et al. 2016; Kelly et al. 2017; Qiu et al. 2018).
In galaxies with AGNs, high HCN/CO and HCN/HCO+ intensity ratios have been reported (e.g., Jackson et al. 1993; Kohno et al. 1996, 2003; Krips et al. 2008, see also related references in Takano et al. (2014)). Recently data of submillimeter lines of HCN, HCO+, and CS became available, and consequently Izumi et al. (2013, 2016a) concluded that the intensity ratios of HCN ( = 4–3)/HCO+ ( = 4–3) and/or HCN ( = 4–3)/CS ( = 7–6) are enhanced in circumnuclear disk (CND) around AGNs, based on data from their observations, the ALMA (Atacama Large Millimeter/submillimeter Array) archive, and literatures. In addition, recent high spatial resolution observations with ALMA revealed detailed distributions of the HCN/HCO+ intensity ratio. In Seyfert galaxies NGC 1068 and NGC 1097, the ratios are generally high in the CND, but the maximum ratios are seen at the surrounding regions of the AGN positions, not at the AGN positions (García-Burillo et al. 2014; Viti et al. 2014; Martín et al. 2015). Salak et al. (2018) reported a similar situation in the starburst galaxy NGC 1808 with a weak AGN. In Cen A the ratios are found to be not high (0.5) in the central regions (Espada et al. 2017). As shown above, the interpretation of the ratios are still not straightforward.
Furthermore, Herschel observations opened new wavelength/frequency ranges of submillimeter and THz regions. Such observations show relatively strong intensities of reactive ions OH+ and H2O+ (e.g., van der Werf et al. 2010; Rangwala et al. 2011), and relatively high CH/CO ratios of column density in galaxies with AGNs (Rangwala et al. 2014).
In addition, many studies of molecular abundances have been carried out in galaxies with starbursts, such as toward NGC 253, M 82, (e.g., Mauersberger & Henkel 1991; Takano et al. 1995; Meier & Turner 2005; Martín et al. 2006; Meier & Turner 2012; Aladro et al. 2013, 2015; Meier et al. 2015). Recently Aladro et al. (2015) carried out systematic line survey observations toward eight nearby galaxies with starbursts, AGNs, and ultra-luminous infrared emission to study the effects of nuclear activity. These studies have often been carried out with unbiased line survey observations in the frequency axis. The line surveys are of fundamental importance in astronomy not only for complete understanding of molecular and atomic abundances in representative sources, but also for finding out new observational tools (spectral lines) probing astrophysical phenomena.
We carried out a new line survey project in the 3 mm wavelength region from December 2007 to May 2012 (Takano et al. 2013) as one of the legacy projects with the Nobeyama 45 m radio telescope. The target objects of this project include Galactic and extragalactic sources, and the project was subdivided into four sub-projects: 1. Low-mass star forming region L1527 (Yoshida et al. accepted to PASJ), 2. Interacting shocked region L1157 B1 between the outflow and the ambient clouds (Sugimura et al. 2011; Yamaguchi et al. 2011, 2012), 3. Infrared dark cloud G28.34+0.06 (Liu et al. 2013), and 4. Galaxies NGC 1068, NGC 253, and IC 342 (Nakajima et al. 2011, 2018). The present sub-project surveyed lines from extragalactic objects. The purpose of this extragalactic sub-project has been to study molecular abundances in nearby galaxies with AGNs and/or starbursts. The obtained data from the galaxies are compared one another to extract characteristics of the effects of the AGNs and starbursts. The additional purpose of this sub-project was to prepare for the ALMA early science by obtaining inventory of spectral lines with accurate flux information: Single-dish telescopes such as the Nobeyama 45 m can obtain accurate flux, even if the distributions of spectral lines are spatially more extended than the telescope beam.
Three well studied nearby galaxies, NGC 1068, NGC 253, and IC 342, were selected for this sub-project as gas-rich extragalactic sources (e.g., Young et al. 1995) with the AGNs and/or starbursts. The effects of the AGNs and starbursts were expected to be studied by comparing data among the central regions in these three galaxies and by comparing them with chemical model calculations. The three galaxies are briefly introduced below.
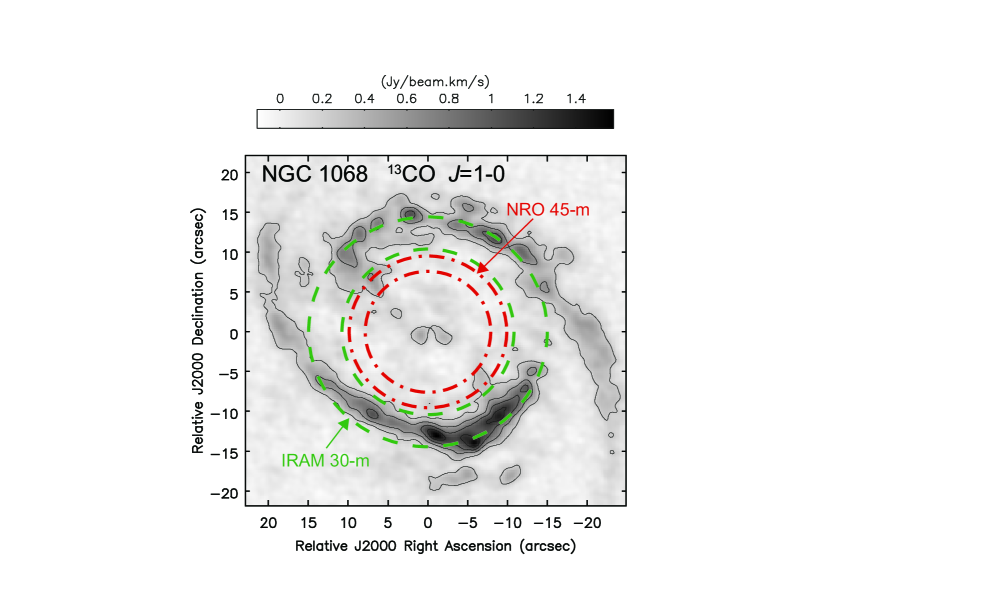
NGC 1068 (M 77) is a nearby (14.4 Mpc, Tully 1988; Bland-Hawthorn et al. 1997) well studied Seyfert 2 galaxy. The CND consists of the eastern knot and the western knot with the separation of about 3′′. This CND is surrounded by the starburst ring/arms with a diameter of about 30′′. So far several line survey observations have been reported toward the center of NGC 1068 (Snell et al. 2011; Costagliola et al. 2011; Kamenetzky et al. 2011; Spinoglio et al. 2012; Aladro et al. 2013, 2015) using single-dish telescopes. In these observations emission from the CND and the starburst ring/arms is not well separated due to the relatively large telescope beams compared with the diameter of the starburst ring/arms (30′′), except for the cases of the short wavelength regions of the two telescopes: Herschel observations (17′′ at 194 m, Spinoglio et al. 2012) and the IRAM 30 m observations (22′′ at 112 GHz, Costagliola et al. 2011, and 21′′ at 116 GHz, Aladro et al. 2013, 2015). The relatively small beam of the 45 m telescope (15′′.2–19′′.1) at the 3 mm region can mainly observe the CND (see also the section of observations). The beam sizes of the Nobeyama 45 m and the IRAM 30 m radio telescopes are overlaid on the 13CO image of NGC 1068 in figure 1 for comparison.
NGC 253 is a nearby (3.5 Mpc, e.g., Rekola et al. 2005; Mouhcine et al. 2005) almost edge-on barred spiral galaxy with prototypical starbursts. It has an exceptionally rich gas with many molecular species in high abundance (e.g., Mauersberger & Henkel 1991). The first extragalactic line survey was reported by Martín et al. (2006) toward the center of this galaxy at the 2 mm wavelength region with the IRAM 30 m radio telescope. Then, several line survey observations have been reported toward the center of NGC 253 using single-dish telescopes and ALMA (Snell et al. 2011; Rosenberg et al. 2014; Meier et al. 2015; Aladro et al. 2015). Although Snell et al. (2011) and Aladro et al. (2015) observed with the single-dish telescopes, the FCRAO 14 m and the IRAM 30 m, respectively, at the same wavelength of 3 mm with our observations, our beam (15′′.2–19′′.1) is smaller than their beams (47′′–70′′ and 21′′–29′′ for the FCRAO 14 m and the IRAM 30 m, respectively).
IC 342 is a nearby (3.93 Mpc, Tikhonov & Galazutdinova 2010) almost face-on barred spiral galaxy with prototypical starbursts. This galaxy is also known to have rich molecular gas (e.g., Henkel et al. 1988). Limited line survey observations have been reported toward the center of IC 342 (Snell et al. 2011; Rigopoulou et al. 2013) using single-dish telescopes. Since IC 342 is situated in the northern sky, it cannot be observed with ALMA, but it can be observed, for example, with NOEMA (Northern Extended Millimeter Array). Although Snell et al. (2011) observed with the FCRAO 14 m radio telescope at the same wavelength of 3 mm with our observations, our beam is again smaller (1/3) than their beams, and our velocity resolution is about 10 times higher than their resolution (100 km s-1). Rigopoulou et al. (2013) observed with Herschel at the wavelength of 196–671 m. The properties of NGC 1068, NGC 253, and IC 342 are listed in table 1.
The initial results of NGC 1068 and this entire line survey project were already reported by Nakajima et al. (2011) and Takano et al. (2013), respectively. In this article, we present obtained data for the three galaxies with the 45 m telescope. Then, we discuss results immediately recognized from the data. The analyses employing rotational diagrams and discussion on the molecular abundances were already reported in a separate paper by Nakajima et al. (2018) (hereafter “analysis paper”).
2 Observations
The observations were carried out with the 45 m telescope at Nobeyama Radio Observatory (NRO)111Nobeyama Radio Observatory is a branch of the National Astronomical Observatory of Japan, National Institutes of Natural Sciences. between February 2009 and May 2011 (three observational seasons). The total allocated time was 500 hrs. Among them 204 hrs were used for the main observations for the galaxies (about 87, 41, and 76 hrs for NGC 1068, NGC 253, and IC 342, respectively) excluding the time for receiver tunings, pointings of the telescope, calibration, recovery from troubles of the system, and bad weather. The frequency covered was from 85 to 116 GHz: There are some gaps in the frequency coverage due to reasons of frequency settings. We tried to place the gaps in frequency regions without expected significant lines (except for HN13C, see the section 4.1.3). The dual-polarization and sideband-separating (2SB) receivers T100 for the 3 mm region (Nakajima et al. 2008) were used: They can observe both linear polarizations (T100H and T100V) with two sidebands simultaneously, and with higher sensitivity than the previous observations with the old SIS receivers. The system temperature was typically 150–300 K including the atmospheric noise depending on elevation, weather, and frequency. The image-sideband rejection ratio was typically 10 dB. The ratio was measured by injecting artificial signal from the top of the receiver optics after each tuning of the receivers (Nakajima et al. 2010). The beam sizes were 15′′.2–19′′.1 (half power beam width: HPBW) for 115–86 GHz. The intensity calibration to obtain antenna temperature () was carried out with the chopper-wheel method. We employed the main beam efficiencies of the T100 receivers for each year to convert the intensity scale to main beam temperature (). The variation of the efficiency during our observational period was not significant: The main beam efficiencies in the final year of our observations at 86, 110, and 115 GHz were 42, 42, and 36%, respectively, for T100H, and 43, 42, and 36%, respectively, for T100V.
Before December 2010 the backend used was digital spectrometers AC45 (Sorai et al. 2000). Eight spectrometers with an instantaneous bandwidth of 512 MHz each and with a resolution of 605 kHz were used simultaneously. From December 2010 a new IF system, new AD converters (4 GHz sampling rate with 3 bit), new digital spectrometers SAM45 (sixteen spectrometers with an instantaneous bandwidth of 1.6 GHz each at the maximum bandwidth), and new related softwares were available. This new system (Kuno et al. 2011; Iono et al. 2012) accelerated our survey. SAM45 was made based on the technology of the correlator for the ALMA Atacama Compact Array (Morita Array) (Kamazaki et al. 2012). The resolution of SAM45 was set to be 488.28 kHz. In addition, the Doppler tracking of both of the sidebands for the 2SB type receivers was carried out by software after the data acquisition. Such software was implemented when the 2SB type receivers were installed (Takahashi et al. 2010).
The central position of each galaxy was observed. The coordinates and the systemic velocities employed were RA(J2000.0) = \timeform2h42m40s.798222In Schinnerer et al. (2000) this value was referred from Muxlow et al. (1996), where a slightly different value of \timeform2h42m40s.7098 was reported., Dec(J2000.0) = \timeform-00D00’47”.938, and 1150 km s-1 for NGC 1068 (Schinnerer et al. 2000), RA(J2000.0) = \timeform00h47m33s.3, Dec(J2000.0) = \timeform-25D17’23” (Martín et al. 2006), and 230 km s-1 for NGC 253, RA(J2000.0) = \timeform03h46m48s.9, Dec(J2000.0) = \timeform68D5’46.0” (Falco et al. 1999), and 32 km s-1 (Crosthwaite et al. 2000) for IC 342. These parameters are summarized in table 1. The position switching was employed. The integration time was 10–20 s both for ON and OFF positions. The OFF positions were +5′ of azimuthal angle for the three galaxies. The telescope pointing was checked every 1–1.5 hours using the nearby SiO maser sources ( = 1 and/or 2, = 1–0): -Cet for NGC 1068, R-Aqr for NGC 253, and T-Cep and IRC+60092 for IC 342. The pointing deviations were typically within 5′′.
3 Data Reduction
The data reduction was carried out with the software package for the spectral lines NewStar (Ikeda et al. 2001). All individual scans were visually inspected, and the bad data (e.g., bad baselines) were flagged manually. Then the data were integrated, baseline subtracted, and binned to obtain the final spectra. Linear baselines were usually subtracted. The lines were Gaussian fitted to obtain intensity, line of sight velocity, and width (full width at half intensity). The integrated intensities were obtained by numerically summing intensity at each spectral channel with significant intensity above the baselines.
The obtained spectra are presented in this article. The spectra were already analyzed to obtain rotational temperatures and column densities in the analysis paper, where the beam dilutions were taken into account.
4 Results
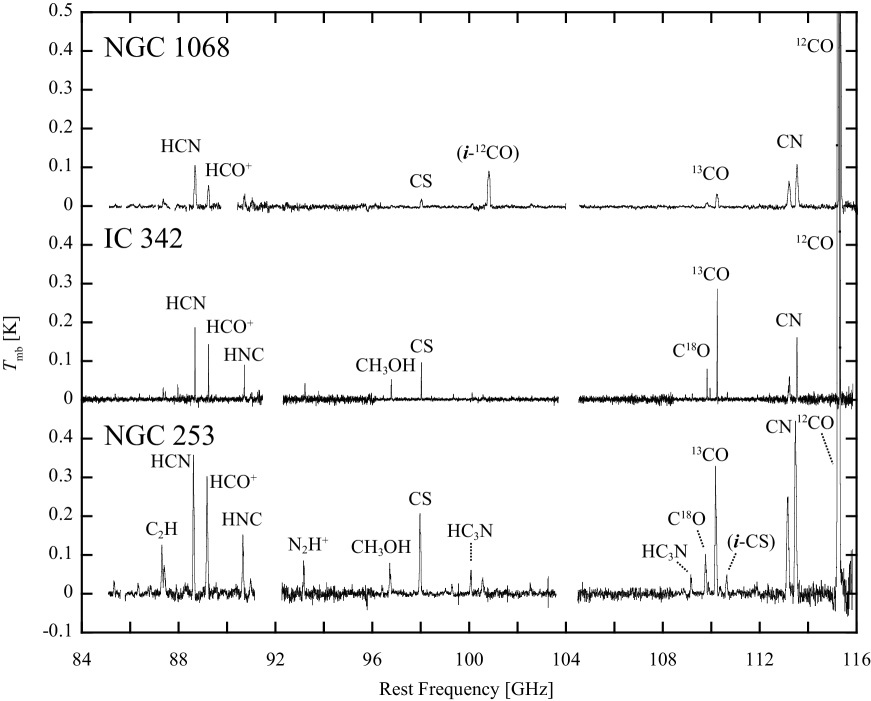
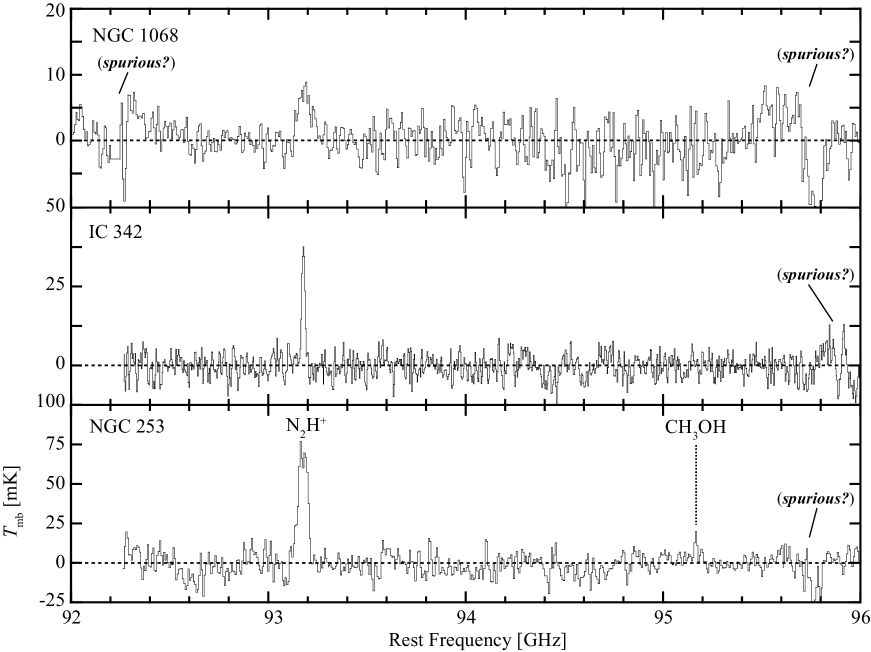
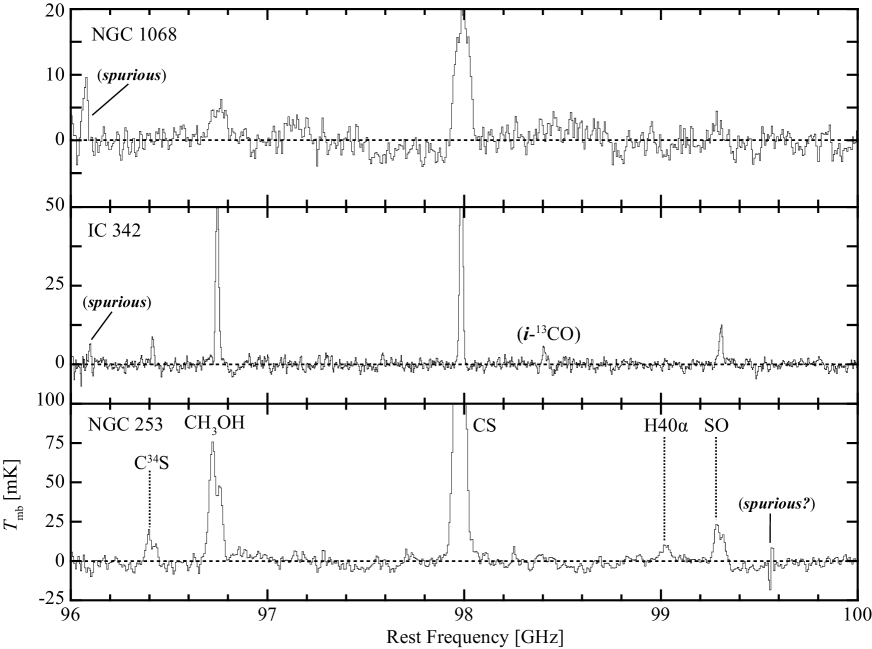
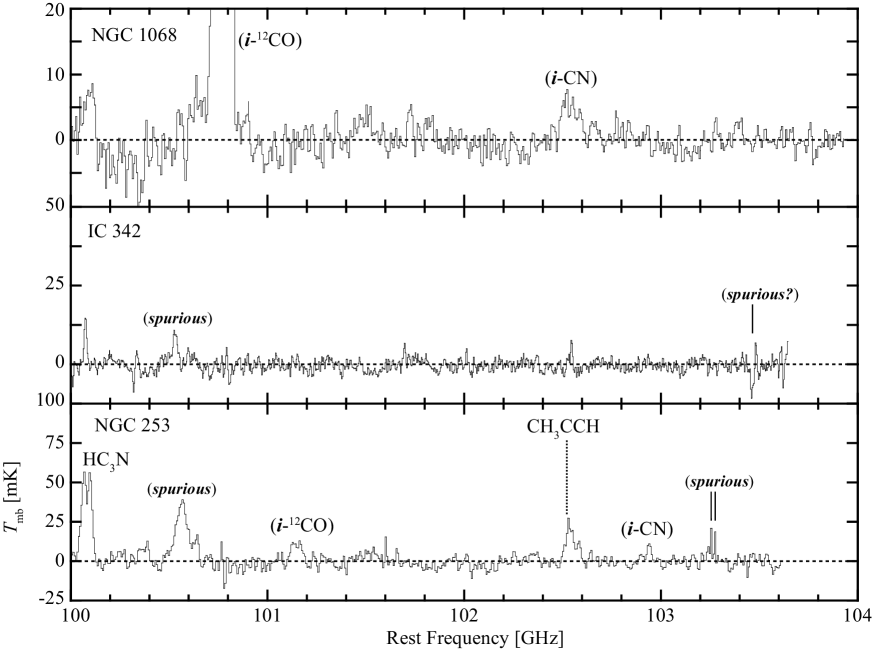
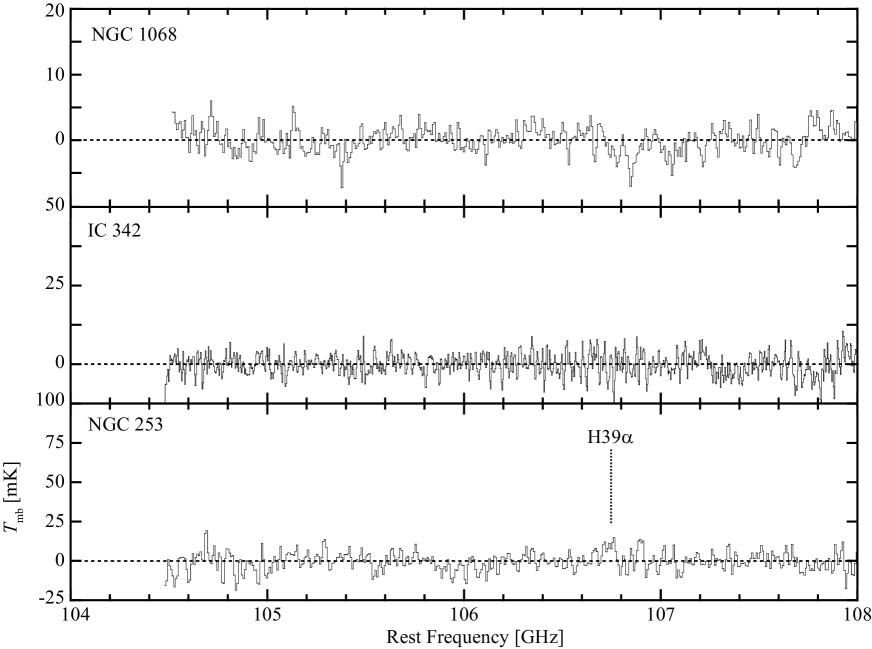
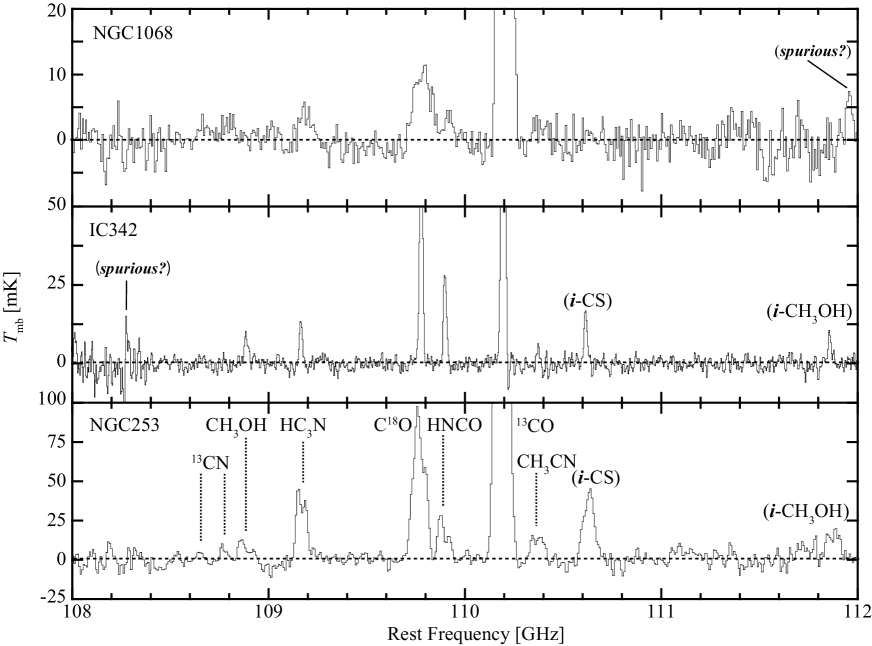
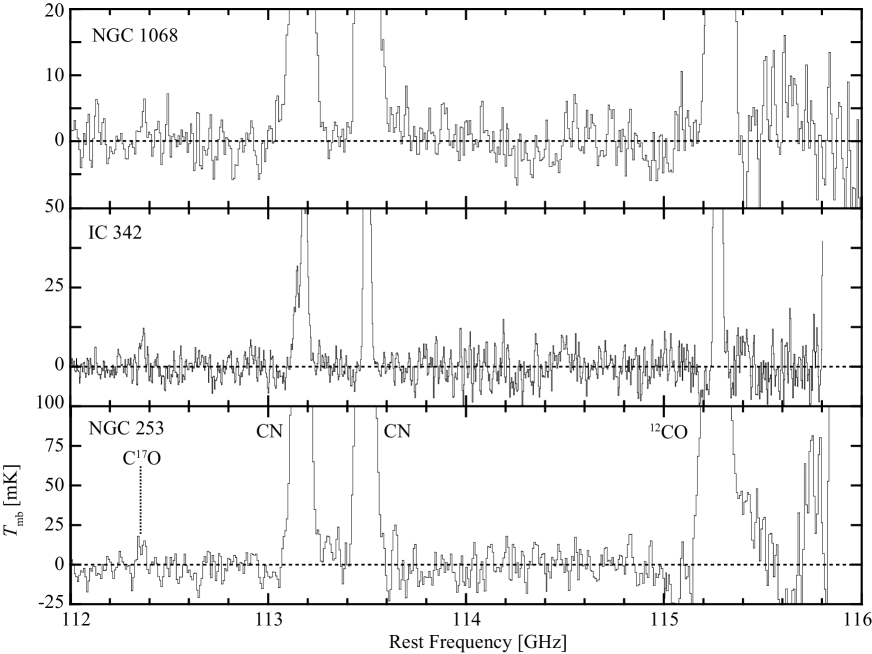
Spectra from 85 GHz to 116 GHz toward the nearby external galaxies NGC 1068, NGC 253, and IC 342 were obtained. The whole compressed spectra of the three galaxies are presented in figure 2. The spectra were made with velocity resolutions of 20 km s-1 for NGC 1068 and NGC 253, and 10 km s-1 for IC 342. As a result, the achieved rms noise levels (in ) are 1.2–2.6 mK for NGC 1068, 1.8–4.8 mK for NGC 253, and 0.8–2.5 mK for IC 342.
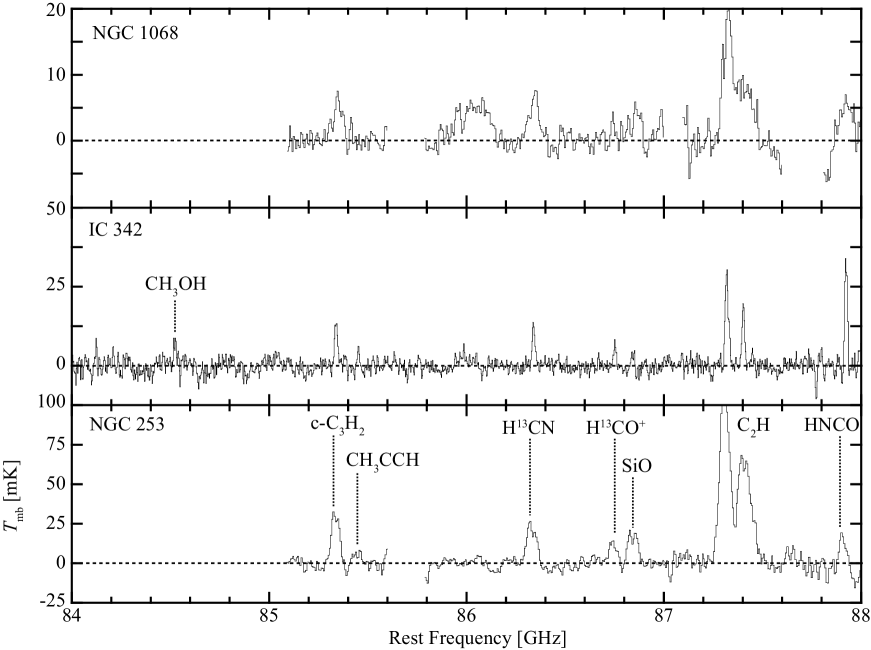
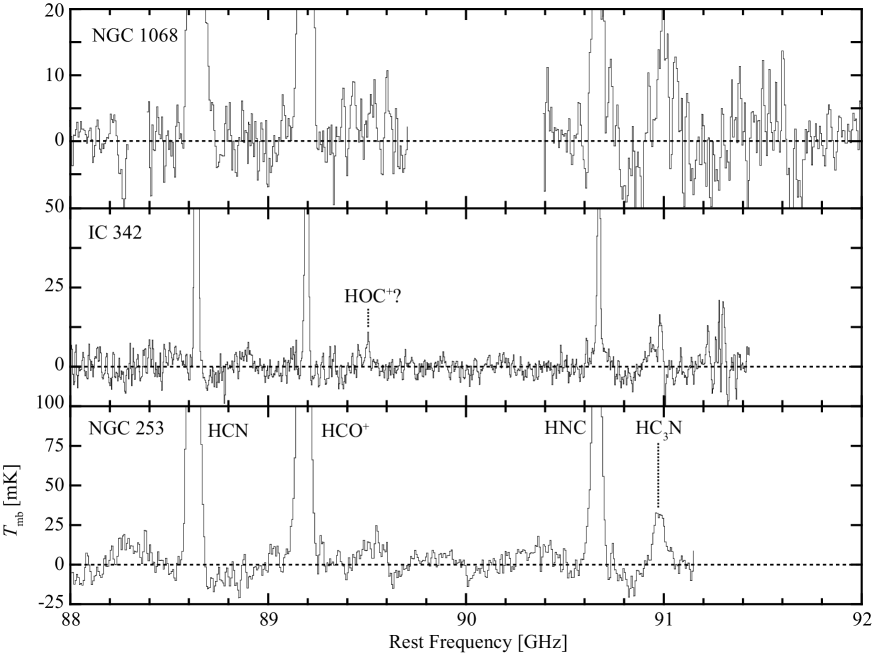
The spectra with 4 GHz width are presented in figures 3 to 10. The line parameters such as intensity are listed in tables A molecular line survey toward the nearby galaxies NGC 1068, NGC 253, and IC 342 at 3 mm with the Nobeyama 45 m radio telescope: The data to A molecular line survey toward the nearby galaxies NGC 1068, NGC 253, and IC 342 at 3 mm with the Nobeyama 45 m radio telescope: The data . The rest frequencies were obtained from Lovas (2004). During the line identification (see the section 4.1), we found lines of 12CO, 13CO, CN, CS, and CH3OH leaked from the other sideband of the receivers. They are indicated in the spectra. In addition the AD converters at the period of our observations generated spurious lines (a few moving features during observations along the frequency axis per each 1.6 GHz instantaneous bandwidth). Significant features of such spurious lines (sometimes broad features after integration) are also indicated in the spectra.
4.1 Line identification
4.1.1 Detected Lines
The detected lines were identified based on the literatures of spectral line surveys referred in the introduction, and also on databases of molecular spectroscopy, CDMS, JPL Catalog (Pickett et al. 1998), NIST Recommended Rest Frequencies (e.g., Lovas 2004), and Splatalogue (e.g., Remijan et al. 2016). We judge detections based not only on the intensity, but also on the quality of the data such as characteristics of the noise (random or not) and characteristics of the baseline (flat or fluctuated).
The numbers of lines detected are 25, 34, and 31 for NGC 1068, NGC 253, and IC 342, respectively. As a result, the numbers of atomic and molecular species (distinguishing isotopologues) identified are 19, 24, and 22 for NGC 1068, NGC 253, and IC 342, respectively. Atomic hydrogen is the only detected atomic species as recombination lines, and it is detected only in NGC 253.
The detected molecules in NGC 1068 for the first time in this survey (C2H, cyclic-C3H2, and H13CN) were already reported in our paper of the initial results (Nakajima et al. 2011). In NGC 253 molecules detected in this survey have already been reported in literatures (e.g., Mauersberger & Henkel 1991; Aladro et al. 2015). In IC 342 cyclic-C3H2, SO, and C17O are detected for the first time.
4.1.2 Tentative detections
In NGC 1068 a possible weak and broad emission feature is seen at the frequency of the = 1–0 transition of C17O (112358.988 MHz) (figure 10). Since the signal-to-noise ratio (SN) is low (2), this is a tentative detection. In NGC 253 the spectral profile of the = 1–0 transition of 12CO has a shoulder at the higher frequency side (figure 10). It may correspond to the = 5/2–3/2 transition () of NS (115556.253 MHz), but the characteristics of the baseline seems not good. It is, therefore, a tentative detection in our spectra. Actually this line is detected with ALMA in NGC 253 (Meier et al. 2015). In IC 342 a weak emission feature is seen at the frequency of the = 1–0 transition of HOC+ (89487.414 MHz) (figure 4). Since the SN is low (2), this is a tentative detection. It is not clear whether this line is detected in NGC 1068 and NGC 253 in our spectra due to the large noise and bad baseline, respectively. These lines are not counted as the identified line in the section 4.1.1
4.1.3 Important non-detections
CH3CCH is known to be abundant in some starburst galaxies (see the section 5.1). In this work it is not detected in NGC 1068, but it is detected in NGC 253 and IC 342. The non-detection in NGC 1068 is already reported by Aladro et al. (2013, 2015) with the IRAM 30 m telescope. In our observations with the NRO 45 m telescope, this result was further studied toward the CND with the smaller beam. Very recently Qiu et al. (2018) reported detection of CH3CCH ( = 50-40) with the IRAM 30 m telescope by conducting deep observations. These results are discussed in the section 5.1.
H13CO+ is an interesting species to compare its intensity to that of H13CN to estimate the HCN/HCO+ intensity ratio to study the power source of galaxies as mentioned in the introduction. It is not detected in NGC 1068, but it is detected in NGC 253 and IC 342. Its detection in NGC 1068 is reported by Aladro et al. (2013), though the line is partially blended with those of SiO ( = 2–1) and possibly HCO (11,0–01,0). In our data the SiO ( = 2–1) line is detected, but the feature of H13CO+ is not clear. This result causes high H13CN/H13CO+ intensity ratio (see the section 4.3.1). The upper limits of the integrated intensities ((upper limit)) of CH3CCH ( = 5K-4K) and H13CO+ ( = 1–0) in NGC 1068 are listed in table A molecular line survey toward the nearby galaxies NGC 1068, NGC 253, and IC 342 at 3 mm with the Nobeyama 45 m radio telescope: The data . However, the upper limit of the = 6K-5K transition of CH3CCH is not listed, because this line is contaminated by an image line from the other sideband of the receiver, which is caused by the finite image-band suppression of the T100 receiver. The upper limits were calculated with the following formula (cf. Aladro et al. 2015)
| (1) |
where rms is root-mean-square of the noise close to the line frequency, FWZI is Full Width at Zero Intensity (estimated to be 400 km s-1), and is the velocity resolution of the spectra (20 km s-1).
In NGC 1068 Aladro et al. (2013) detected the = 5/2–3/2 transition () of NS with the IRAM 30 m telescope. In our spectra the frequency region of this line is noisy, and the line is not seen. In addition, Aladro et al. (2015) tentatively detected HCO (11,0–01,0), HN13C ( = 1–0), HOC+ ( = 1–0), and C34S ( = 2–1) in NGC 1068 with the IRAM 30 m telescope. The lines of HCO are not seen in our spectra, though they are generally not easy to detect due to the blending with other lines as mentioned above. In the case of HN13C the frequency of this line (87090.859 MHz) is in the gap of our spectra. HOC+ is not detected in our spectra as mentioned above in the section 4.1.2. C34S is not detected either in our spectra, though the spectra show relatively low noise and stable baseline. The emission of CS ( = 2–1) is known to be distributed both in the CND and the starburst ring based on interferometric observations (see the section 5.4). Therefore, it is probable that the IRAM 30 m telescope is advantageous for the detection of C34S ( = 2–1), because its beam covers the emission both from the CND and the starburst ring.
4.2 Characteristics of integrated intensity (Normalized by CS or 13CO)
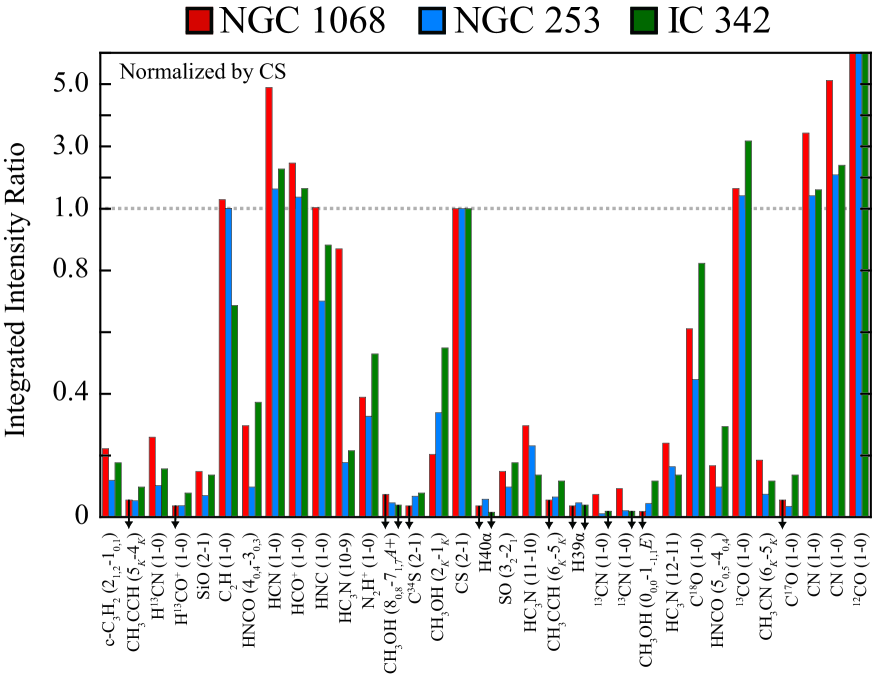
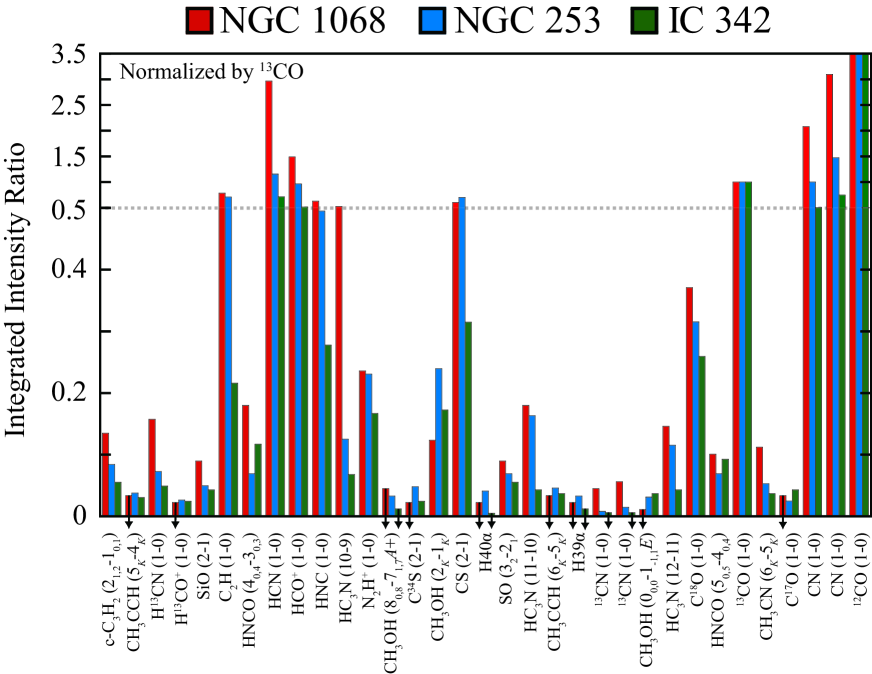
Here we compare the integrated intensities among the three galaxies to see their immediately recognized characteristics. For this comparison, the integrated intensities normalized by the integrated intensity of CS ( = 2–1) or 13CO ( = 1–0) were used to cancel the difference in the amount of gas in these galaxies. CS is one of the typical molecules to trace dense molecular gas. On the other hand, 13CO ( = 1–0) traces gas including relatively low density gas (e.g., Wilson et al. 2013), and its optical depth is much lower than that of 12CO.
The comparison of integrated intensities among the three galaxies normalized by that of CS or 13CO is shown in figures 11 and 12, respectively. From these figures, we noticed the strongest normalized integrated intensities of HCN, CN, and so on in NGC 1068. This characteristic is quite remarkable and is immediately recognized also in the compressed spectra shown in figure 2: The HCN and CN lines are significantly stronger than that of 13CO in NGC 1068. In addition to these figures, selected normalized integrated intensities of focused molecular lines in this section are listed in table A molecular line survey toward the nearby galaxies NGC 1068, NGC 253, and IC 342 at 3 mm with the Nobeyama 45 m radio telescope: The data .
4.2.1 HCN ( = 1–0) and H13CN ( = 1–0) intensities
The integrated intensities of HCN and H13CN normalized by that of CS or 13CO are significantly stronger in NGC 1068 than the corresponding intensities in NGC 253 and IC 342 as listed in table A molecular line survey toward the nearby galaxies NGC 1068, NGC 253, and IC 342 at 3 mm with the Nobeyama 45 m radio telescope: The data . Since the optical depth of H13CN is much lower than that of HCN (cf. Nakajima et al. 2018), the comparison using H13CN should be more reliable for comparing the HCN intensities among the galaxies, and furthermore for comparing the HCN column densities. The normalized integrated intensity of H13CN in NGC 1068 is about 1.6–3.2 times stronger than those in NGC 253 and IC 342 (table A molecular line survey toward the nearby galaxies NGC 1068, NGC 253, and IC 342 at 3 mm with the Nobeyama 45 m radio telescope: The data ).
4.2.2 CN ( = 1–0) and 13CN ( = 1–0) intensities
The integrated intensities of CN normalized by that of CS or 13CO are significantly stronger in NGC 1068 than the corresponding intensities in NGC 253 and IC 342. This tendency is also seen for 13CN between NGC 1068 and NGC 253 (non-detection in IC 342). Since the optical depth of 13CN is much lower than that of CN (cf. Nakajima et al. 2018), the comparison using 13CN should be more reliable, though the intensity is rather week. The normalized integrated intensity of 13CN in NGC 1068 is about 4 times stronger than that in NGC 253 (table A molecular line survey toward the nearby galaxies NGC 1068, NGC 253, and IC 342 at 3 mm with the Nobeyama 45 m radio telescope: The data ).
The CN = 1–0 transition has fine and hyperfine structures. Two lines due to the fine structure ( = 3/2–1/2 and 1/2–1/2) are mainly resolved as the broad lines of the external galaxies.
4.2.3 HC3N intensities
The three transitions ( = 10–9, 11–10, and 12–11) were detected in this survey. The integrated intensities of HC3N normalized by that of CS or 13CO are relatively stronger in NGC 1068 than the corresponding intensities in NGC 253 and IC 342 (table A molecular line survey toward the nearby galaxies NGC 1068, NGC 253, and IC 342 at 3 mm with the Nobeyama 45 m radio telescope: The data ). Since the SN of the = 10–9 transition in NGC 1068 is low (2–3), the reliability of the corresponding ratios is low.
The normalized integrated intensities of the = 11–10 and 12–11 transitions in NGC 1068 are 1.1–1.5 times stronger than those in NGC 253. On the other hand, they are 1.7–4.5 times stronger than those in IC 342. Therefore, the characteristic of HC3N is relatively weak between NGC 1068 and NGC 253 compared with the cases of HCN and CN. We can alternatively interpret that the normalized intensities in NGC 1068 and NGC 253 are similar, and that the normalized intensities in IC 342 are relatively low.
4.3 Characteristics of integrated intensity ratio
4.3.1 HCN ( = 1–0)/HCO+ ( = 1–0) integrated intensity ratios
The HCN/HCO+ integrated intensity ratios are listed in table A molecular line survey toward the nearby galaxies NGC 1068, NGC 253, and IC 342 at 3 mm with the Nobeyama 45 m radio telescope: The data . The obtained values are 1.980.11, 1.190.03, and 1.380.02 for NGC 1068, NGC 253, and IC 342, respectively, where the errors are 1. Therefore, the ratio in NGC 1068 is significantly high among the three galaxies.
The normalized integrated intensity of HCN and H13CN in NGC 1068 is significantly stronger than those in NGC 253 and IC 342 as mentioned in section 4.2.1 . On the other hand, the normalized integrated intensity of HCO+ in NGC 1068 is also significantly stronger than those in NGC 253 and IC 342 as listed in table A molecular line survey toward the nearby galaxies NGC 1068, NGC 253, and IC 342 at 3 mm with the Nobeyama 45 m radio telescope: The data , but it is not so strong as in the cases of HCN and H13CN. The characteristic of the HCN/HCO+ integrated intensity ratios mentioned above is caused by this balance of the intensities.
The H13CN/H13CO+ integrated intensity ratio should, in principle, be more reliable to study the HCN/HCO+ integrated intensity ratios without the effect of the large optical depth and the HCN/HCO+ column density ratios, because the optical depths of the H13CN and H13CO+ lines are much lower (cf. Nakajima et al. 2018). The obtained ratios are 3.1, 2.80.7, and 2.00.6 for NGC 1068, NGC 253, and IC 342, respectively, as listed in table A molecular line survey toward the nearby galaxies NGC 1068, NGC 253, and IC 342 at 3 mm with the Nobeyama 45 m radio telescope: The data , where the errors are 1. Therefore, the ratio in NGC 1068 is high among the three galaxies, but the reliability is still insufficient due to the low SN of the lines and to non-detection of H13CO+ in NGC 1068.
4.3.2 Integrated intensity ratios between isotopic species ( = 1–0)
The integrated intensity ratios between isotopic species, CO/13CO, CO/C18O, and HCN/H13CN are listed in table A molecular line survey toward the nearby galaxies NGC 1068, NGC 253, and IC 342 at 3 mm with the Nobeyama 45 m radio telescope: The data . The ratios calculated from the data of NGC 1068 and NGC 253 obtained with the IRAM 30 m telescope (Aladro et al. 2015) are also listed with those obtained with the NRO 45 m telescope. The ratios in NGC 1068 obtained with both of the telescopes look significantly different each other. On the other hand, the ratios in NGC 253 obtained with both of the telescopes are similar. A possible reason is the difference in the central gas distributions between NGC 1068 and NGC 253. The details will be discussed in the section 5.3.2.
In addition, the optical depth of each line can be calculated from the integrated intensity ratio of the isotopic species using the elemental isotopic ratios. The results were presented in the analysis paper (Nakajima et al. 2018).
4.4 Comparison of integrated intensity in NGC 1068 between NRO 45 m and IRAM 30 m telescopes
NGC 1068 has the CND and the surrounding ring-like starburst region with the diameter of about 30′′ as already mentioned in the introduction with the figure 1. The observed line intensities, therefore, should sensitively reflect the coupling of the beams and the distributions of the molecules (in the CND and/or the starburst region).
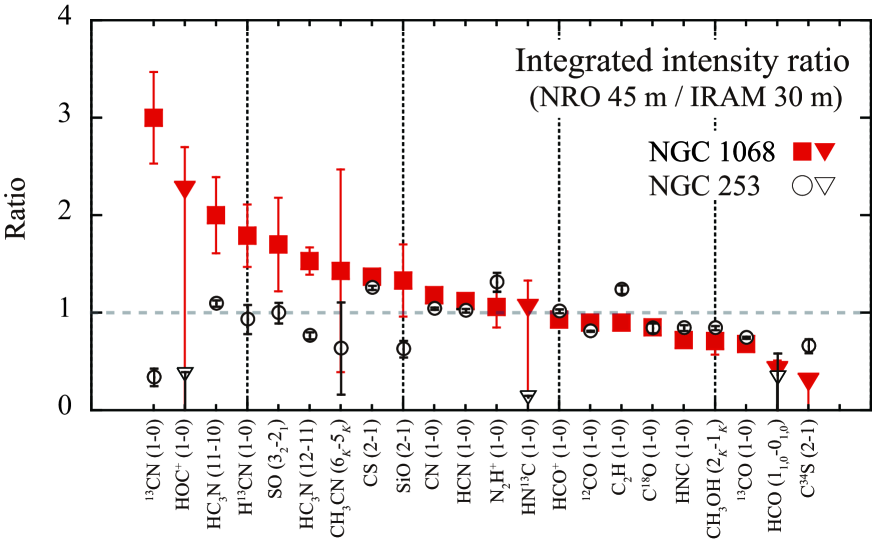
In this point of view, our line intensities were compared with those obtained with the IRAM 30 m telescope (Aladro et al. 2013, 2015) to estimate the distributions. The results of the integrated intensity ratios (NRO 45 m/IRAM 30 m) are presented in figure 13. In this figure, the ratios larger than unity indicate that the integrated intensities obtained with the 45 m telescope are stronger than the corresponding values obtained with the 30 m telescope. The ratios larger than unity are for molecules 13CN, HC3N, H13CN, SO, CH3CN, CS, SiO, CN, HCN, and N2H+ in descending order. On the other hand, the ratios smaller than unity are for molecules HCO+, 12CO, C2H, C18O, HNC, CH3OH, 13CO, and C34S in descending order.
The similar ratios in NGC 253 were overlaid in figure 13 for comparison. The ratios in NGC 253 are between 0.3–1.3 except for upper limits. This trend is significantly different from that in NGC 1068. The obtained ratios in both of the galaxies and their relation to the distributions are discussed later in the section 5.4.
5 Discussion
5.1 Implication for detection and non-detection
-
-
Hydrogen recombination lines (H39 and H40) are detected in NGC 253, but not detected in NGC 1068 and IC 342. In NGC 253 their detections have already been reported with single-dish telescopes and interferometers (e.g., Puxley et al. 1997; Martín et al. 2006; Aladro et al. 2015; Bendo et al. 2015; Meier et al. 2015; Nakanishi et al. 2015). In NGC 1068 no lines had been detected so far at the millimeter or submillimeter wavelength (Puxley et al. 1991; Izumi et al. 2016b), but very recently Qiu et al. (2018) reported a detection of the H42 line at 85695.0 MHz, which is in the gap of our frequency settings, observed with the IRAM 30 m telescope. They suggested that the H42 line comes likely from the spiral arms considering its central velocity and the results of Izumi et al. (2016b). In IC 342 recombination lines in the 5 and 6.7 GHz regions (C-band) and in the 34 and 35 GHz regions (Ka-band) were detected recently by averaging the spectra obtained with the Jansky Very Large Array (Balser et al. 2017).
It is interesting to note that the ionized gas in or close to the CND of NGC 1068 does not emit the radio recombination lines with detectable intensity, and that the HII regions in the starburst regions in NGC 253 emit the significantly strong lines. The expected intensity of the lines at the submillimeter wavelength from the broad line region in NGC 1068 can be detectable according to a model (Scoville & Murchikova 2013), although no detection is reported so far as shown by Izumi et al. (2016b).
The limited observations of the recombination lines in IC 342 could be due to the relatively small amount of the total activity of the HII regions: The H emission in IC 342 is about 4.9 times weaker than that in NGC 253 (Kennicutt et al. 2008).
-
-
CH3CCH is often detected in starburst galaxies, but not in galaxies with AGNs (e.g., Mauersberger & Henkel 1991; Martín et al. 2006; Aladro et al. 2011a, b, 2013, 2015). In the present study, CH3CCH is not detected in NGC 1068 with the relatively small beam of the NRO 45 m telescope as single-dish telescopes, but it is detected in NGC 253 and IC 342. Consequently it is possible to conclude more strictly than before that the CND in NGC 1068 is not in favorable condition to maintain the abundance of CH3CCH. Therefore, CH3CCH can be a useful molecule to judge whether the origin of activity in galaxies is starburst or AGN, as already discussed in Aladro et al. (2013, 2015) and Nakajima et al. (2018). As mentioned in the section 4.1.3, Qiu et al. (2018) reported the detection of CH3CCH ( = 50–40) with the IRAM 30 m telescope. In the context above, its emission may come from the starburst ring, which is covered with the beam of the IRAM 30 m telescope. The high spatial resolution data will be necessary to study the distribution of CH3CCH.
Recently Watanabe et al. (2017) and Nishimura et al. (2017) reported mapping spectral line surveys toward the Galactic active star-forming regions W51 and W3(OH), respectively. They detected CH3CCH in the active regions such as the hot core in W51 and W3(OH), but its line is found to be missing in the averaged spectra over all the observed areas. The areas are 39 pc 47 pc for W51 and 9.0 pc 9.0 pc for W3(OH). On the other hand, our beam at 86 GHz corresponds to the linear scales of 320 pc for NGC 253 and 360 pc for IC 342. These results suggest that the starburst regions in NGC 253 and IC 342 are not collections of the Galactic active star-forming regions like W51 and W3(OH): The starburst regions are suggested to be collections of the Galactic hot core like regions.
5.2 Characteristics of integrated intensity (Normalized by CS or 13CO)
5.2.1 HCN ( = 1–0) and H13CN ( = 1–0) intensities
In NGC 1068 HCN ( = 1–0) is distributed mainly in the CND as already reported with the interferometric observations including both the CND and the starburst ring in the field of view (e.g., Kohno et al. 2008) (see also section 5.4).
The enhancement of the HCN abundance in X-ray irradiated regions such as the CND is predicted by model calculations (e.g., Lepp & Dalgarno 1996). In addition, Harada et al. (2010) pointed out that the HCN abundance is enhanced under high-temperature conditions via the hydrogenation of CN (reaction barrier of 820 K):
On the other hand, Meijerink et al. (2011) reported model calculations in extreme environments with the effects of cosmic rays and mechanical heating (e.g., supernova driven turbulence). According to their results, the HCN abundance does not show a strong response to enhanced cosmic ray rates, but the abundance enhances with mechanical heating.
These situations are almost in accord with the proposed high-temperature chemistry in another Seyfert galaxy NGC 1097 based on the enhanced HCN ( = 4–3) line intensity (Izumi et al. 2013). Since this galaxy has the low X-ray luminosity AGN ( = 4.41040 erg s-1, Nemmen et al. 2006), the effect of X-rays is thought to be not efficient (cf. = 11043–1044 erg s-1 for NGC 1068, Iwasawa et al. 1997; Colbert et al. 2002).
Our results of the enhancement of the normalized intensity of HCN and H13CN in NGC 1068 could also be interpreted with these mechanisms above. One of the origins of the mechanical heating in the CND in NGC 1068 can be an AGN driven outflow, which was identified by García-Burillo et al. (2014) based on the analysis of the velocity field of CO ( = 3–2).
Izumi et al. (2013) proposed that the intensity ratio of HCN ( = 4–3)/CS ( = 7–6) can be used to distinguish the power sources of galaxies, AGN or starburst. Our intensities shown in the columns in the left side in table 5 are normalized by the intensities of CS ( = 2–1) instead of CS ( = 7–6). As already shown, the intensity ratios of HCN ( = 1–0)/CS ( = 2–1) are higher in NGC 1068 than those in NGC 253 and IC 342. Therefore, the intensity ratio of HCN/CS is generally useful, but we should note that the ratios obtained from the high excitation lines, HCN ( = 4–3)/CS ( = 7–6), are more sensitive to excitation conditions than those obtained from the low excitation lines, HCN ( = 1–0)/CS ( = 2–1), as already discussed by Martín et al. (2015).
5.2.2 CN ( = 1–0) and 13CN ( = 1–0) intensities
The normalized integrated intensities of CN are significantly stronger in NGC 1068 than the corresponding intensities in NGC 253 and IC 342 as already reported in the section 4.2.2. The enhancement of the CN abundance in X-ray irradiated regions is predicted by model calculations (e.g., Krolik & Kallman 1983; Lepp & Dalgarno 1996; Harada et al. 2013). On the other hand, the CN abundance does not enhance under high-temperature conditions (Harada et al. 2010, 2013). Therefore, the present results of the strong intensity of CN and 13CN can be mainly due to X-ray radiation. According to the ALMA observations of CN ( = 3–2) in NGC 1068 (Nakajima et al. 2015), which resolves the CND and the starburst ring, CN is distributed only in the CND. This result does not contradict to the formation mechanism above. We are analyzing the = 1–0 lines of CN in NGC 1068 obtained with ALMA, and the results will be presented elsewhere.
5.2.3 HC3N intensities
As explained in the section 4.2.3, the normalized integrated intensity of HC3N can be relatively strong in NGC 1068. According to the model calculations in high-temperature and/or with AGN (Harada et al. 2010, 2013), the abundance of HC3N is high in the mid-plane in the CND shielded from X-ray radiation. The relatively strong HC3N intensity in the present study can be qualitatively explained with such models.
Aladro et al. (2015) carried out line survey observations with the IRAM 30 m telescope toward eight galaxies with starbursts, AGNs, and/or ultra-luminous infrared emission (ULIRGs), and reported that the abundances of HC3N are enhanced in Arp 220 and Mrk 231 in their sample of galaxies. They mentioned that this could be related to larger amount of dense gas and warm dust. Costagliola et al. (2011) also discussed that the emission of HC3N would be coming from hot core-like regions based on line intensities obtained from their line survey observations toward 23 galaxies. These conditions may be similar to those in the CND in NGC 1068. On the other hand, HC3N is relatively not abundant in NGC 1068 in the observations of Aladro et al. (2015). The different results between the IRAM 30 m and the NRO 45 m telescopes can be due to the relatively small beam size of the 45 m telescope, which observes the CND more selectively. Actually, the HC3N lines ( = 11-10 and 12-11) were found to be concentrated in the CND based on the ALMA observations (Takano et al. 2014). The concentration in the CND would support the HC3N formation in the mid-plane.
5.3 Characteristics of integrated intensity ratio
5.3.1 HCN ( = 1–0)/HCO+ ( = 1–0) intensity ratios
As explained in the section 4.3.1, the HCN/HCO+ integrated intensity ratios obtained are significantly higher in NGC 1068 than those in NGC 253 and IC 342. This tendency is consistent with the results toward the central regions observed with the Nobeyama Millimeter Array (NMA) (Kohno et al. 2001). Our ratio in NGC 1068, 1.980.11, is significantly higher than the ratio of 1.640.03 obtained with the IRAM 30 m telescope (Aladro et al. 2015) (table 6), where the errors are 1, because the NRO 45 m telescope is probing more selectively the central region, where the ratio is high as shown below. These ratios in the central region obtained with interferometers are 2.3 (NMA with the beam size of \timeform6.3”\timeform4.9”, Kohno et al. 2001) and 2.5 (Plateau de Bure interferometer with the beam size of \timeform6.6”\timeform5.1”, Viti et al. 2014).
Meijerink et al. (2007) reported detailed model calculations for PDR and XDR regions. HCN ( = 1–0)/HCO+ ( = 1–0) intensity ratios are included in their results. The ratios depend on the density and the column density: In high density ( cm-3) and high column density ( cm-2) conditions the ratios for the XDR regions are smaller than unity, which is not consistent with our results, if the emission lines are mainly coming from the XDR regions. Considering the situations above, the mechanical heating mentioned in the section 5.2.1 can be an efficient mechanism to enhance the HCN abundance.
In the starburst galaxy NGC 253, the HCN/HCO+ integrated intensity ratios obtained with the NRO 45 m and the IRAM 30 m telescopes are similar, 1.190.03 and 1.180.02 (Aladro et al. 2015), respectively (table 6), where the errors are 1. Therefore, the situation is different from that in NGC 1068, and the ratio seems to be spatially rather uniform in the dense gas in NGC 253. In such case, the ratio is expected to be insensitive to the beam sizes. Actually, Meier et al. (2015) reported that the HCO+/HCN intensity ratios are 1 in the regions 4–10, which they defined in the central \timeform35” in NGC 253.
Another factor to affect the HCN/HCO+ integrated intensity ratios is metallicity. In low-metallicity galaxies such as IC 10, Large Magellanic Cloud, and M 33, the HCN/HCO+ integrated intensity ratios (mainly from the = 1–0 transition) are smaller than unity (e.g., Chin et al. 1997; Paron et al. 2014; Nishimura et al. 2016b, a; Braine et al. 2017).
In the cases of NGC 1068, NGC 253, and IC 342, the oxygen abundances relative to hydrogen, 12+log(O/H), are 8.87 (Kraemer et al. 2015), 8.5–9.0, and 8.3–9.25 (Vila Costas & Edmunds 1993, from their figure 2), respectively, where the solar value (solar photosphere) is 8.66 (Asplund et al. 2006). The nitrogen abundances relative to hydrogen, 12+log(N/H), are 8.64 (Kraemer et al. 2015), 7.25–8.0, and 7.05–9.0 (Vila Costas & Edmunds 1993, from their figure 2) for NGC 1068, NGC 253, and IC 342, respectively, where the solar value (solar photosphere) is 7.78 (Asplund et al. 2006). The values from Kraemer et al. (2015) are based on X-ray observations in the central region (100”), and those from Vila Costas & Edmunds (1993) are based on optical observations toward giant HII regions. The values of oxygen abundances in NGC 253 and IC 342 show scatter, but the averaged values in NGC 253 and IC 342 and the value in NGC 1068 are similar to the solar value. Furthermore, the values of nitrogen abundances in NGC 253 and IC 342 also show scatter, but the averaged values are similar to the solar value. On the other hand, the nitrogen abundance in NGC 1068 is likely to be higher than the solar value. In general each galaxy has gradient and scatter of metallicity. Therefore, the effect of metallicity viewed with the beam size of the NRO 45 m telescope may not be significant. Observations with high spatial resolution are necessary for further study of the effect of metallicity. The details are discussed in Nakajima et al. (2018).
Watanabe et al. (2014) carried out spectral line surveys toward the two positions (called P1 and P2) in the spiral arm of M51 in the 3 mm and 2 mm bands. Their results can be used as one of the references for studies of molecular abundances in CNDs and starburst galaxies. The HCN ( = 1–0)/HCO+ ( = 1–0) integrated intensity ratios are calculated from their data to be 1.340.07 for the P1 position and 1.230.11 for the P2 position, where the errors are 1. These ratios are similar to those of the starburst galaxies, 1.190.03 and 1.380.02 for NGC 253 and IC 342, respectively (table A molecular line survey toward the nearby galaxies NGC 1068, NGC 253, and IC 342 at 3 mm with the Nobeyama 45 m radio telescope: The data ). Thus, the ratios may not significantly depend on the scale of the star formation activities (starburst or not) in the case where there is no significant effects of mechanical heating.
5.3.2 Integrated intensity ratios between isotopic species ( = 1–0)
The integrated intensity ratios between isotopic species, are listed in table A molecular line survey toward the nearby galaxies NGC 1068, NGC 253, and IC 342 at 3 mm with the Nobeyama 45 m radio telescope: The data and already introduced in section 4.3.2. The different ratios in NGC 1068 obtained with the NRO 45 m telescope and IRAM 30 m telescope, for example, 17.40.4 and 6.20.1 for CO/13CO, where the errors are 1, indicate that the distributions of the intensities of the isotopic species are different each other. Such different distributions are actually found with the high spatial resolution data obtained with interferometers including ALMA. The CO emission is distributed both in the CND and the starburst ring (e.g., Schinnerer et al. 2000), but 13CO and C18O show weak emission lines in the CND and mainly distributed in the starburst ring (e.g., Helfer & Blitz 1995; Papadopoulos et al. 1996; Takano et al. 2014; Tosaki et al. 2017). Therefore, the ratios are higher with the small beam of the 45 m telescope than those with the 30 m telescope. The situation is contrary in the case of the ratio HCN/H13CN. The ratio obtained with the 45 m telescope is lower than that obtained with the 30 m telescope. These ratios indicate that the distribution of HCN is expected to have more significant detectable fraction in the starburst ring than that of H13CN. Detailed distributions of HCN and H13CN are necessary to directly interpret this case.
On the other hand, the similar ratios obtained in NGC 253 with both of the telescopes indicate that the distributions of the emission lines of the species are similar each other (CO and 13CO, CO and C18O, HCN and H13CN). Actually similar distributions between HCN and H13CN are reported based on high spatial resolution observations with ALMA (Meier et al. 2015). The different situation shown above between NGC 1068 and NGC 253 is probably due to the existence of the CND, which significantly affects the molecular abundance and excitation, in NGC 1068.
5.4 Integrated intensity ratios in NGC 1068 between NRO 45 m and IRAM 30 m telescopes
The integrated intensity ratios (NRO 45 m/IRAM 30 m) in NGC 1068 were compared in the section 4.4. The molecules with the ratios larger than unity are expected to have concentration mainly in the CND, because such molecules are observed with relatively small beam dilution with the small beam of the NRO 45 m telescope. On the other hand, the molecules with the ratios smaller than unity are expected to be distributed significantly in the starburst ring. These expectations are now becoming possible to study directly with high spatial resolution data obtained with sensitive interferometers including ALMA.
The molecules with the ratios larger than unity and with their interferometric data available are actually found to have significant concentration in the CND: HC3N ( = 11–10, 12–11), SO ( = 32–21), CH3CN ( = 6K–5K) (Takano et al. 2014), CS ( = 2–1) (Tacconi et al. 1997; Takano et al. 2014; Tosaki et al. 2017). SiO ( = 2–1) (García-Burillo et al. 2010), and HCN ( = 1–0) (e.g., Kohno et al. 2008). The degree of the concentration in the CND depends on the ratio. For example, the ratio is about 1.4 in the case of CS. The emission of CS is significantly concentrated in the CND, and in addition the emission is also clear enough to trace the starburst ring.
On the other hand, the molecules with the ratios smaller than unity and with their interferometric data available are found to be distributed mainly in the starburst ring: 12CO ( = 1–0) (e.g., Schinnerer et al. 2000), 13CO ( = 1–0) and C18O ( = 1–0) (e.g., Takano et al. 2014; Tosaki et al. 2017). C2H ( = 1–0) and CH3OH (=2K-1K) also show the ratios smaller than unity, and these molecular lines are found to be distributed significantly both in the CND and the starburst ring (García-Burillo et al. (2017) for C2H; Takano et al. (2014) and Tosaki et al. (2017) for CH3OH).
Nakajima et al. (2011) has already suggested that C2H ( = 1–0) is insusceptible to AGN or is tracing cold molecular gas rather than the X-ray irradiated hot gas based on their observations toward NGC 1068 and NGC 253 in the early stage of this line survey. Their suggestion does not contradict to the discussion above. Furthermore, Aladro et al. (2015) has also mentioned the possibility that significant emission of C2H ( = 1–0) arises from the star forming ring in NGC 1068 and NGC 7469 similar to the case in NGC 1097 (Martín et al. 2015).
In the case of C34S ( = 2–1) the upper limit of the ratio is much lower than unity, which is not consistent with the ratio (1.4) of CS ( = 2–1). Since the intensity of CS ( = 2–1) in NGC 1068 is much weaker than those in NGC 253 and IC 342, detection of C34S ( = 2–1) in NGC 1068 is rather difficult: The detection of C34S ( = 2–1) is tentative with the 30 m telescope, and it is not detected with the 45 m telescope. Therefore, the data with high quality are necessary to study the integrated intensity ratio of C34S in detail.
Based on the discussion above with the interferometric data, the estimates of the distributions using data obtained with the single-dish telescopes are demonstrated to be possible. In figure 13 the integrated intensity ratios in NGC 253 were overlaid for comparison. In contrast to the ratios in NGC 1068, the ratios in NGC 253 are at around unity, which means that the variation of the ratios in NGC 253 is significantly smaller than that in NGC 1068. These results in NGC 253 probably indicate that there is no distinct structure comparable to that in NGC 1068 resolved with the beams of the NRO 45 m and/or the IRAM 30 m telescopes.
5.5 General comments for IC 342
This article reports the first high quality results of line survey observations toward IC 342 in the 3 mm wavelength region as mentioned in the introduction. Generally the intensities of lines show similar trend with those of NGC 253 as shown in figures 11 and 12. This trend may be originated from the fact that both NGC 253 and IC 342 are starburst galaxies with no significant indication of the AGN. Non-detection of recombination lines in IC 342 indicates lower activity of star-formation than that in NGC 253 as mentioned in the section 5.1. Actually the star formation rate in the central \timeform10” region in IC 342 is reported to be 0.15 yr-1 (Balser et al. 2017). This rate is much smaller than 1.730.12 yr-1 in the central \timeform20”\timeform10” region in NGC 253 (Bendo et al. 2015). The star formation rates in these galaxies were obtained based on the observations of recombination lines and continuum emission, which are not affected by dust extinction.
The linewidths of non-blended lines in IC 342 are 38–74 km s-1, which are significantly smaller than the corresponding widths of 123–218 km s-1 in NGC 253. Note that these widths are severely affected by the SN of the lines. As generally known, the important factor for the difference in the linewidths is the inclination angles, 316\degree(Crosthwaite et al. 2000) for IC 342 (nearly face-on) and 78.5\degree(Pence 1980, 1981) for NGC 253 (nearly edge-on).
5.6 Future prospects
In the present line survey observations data of molecular gas in NGC 1068, NGC 253, and IC 342 in the 3 mm wavelength regions was obtained with rather high spatial resolutions as single-dish telescopes. Higher spatial resolution images with interferometers are essential for further study by directly resolving the central structures such as the CND and the starburst ring in the case of NGC 1068. We have already obtained the corresponding imaging line survey data of NGC 1068 with ALMA, and the results will be published in near future.
6 Summary
In the present line survey observations data of molecular gas in the Seyfert galaxy NGC 1068 and the prototypical starburst galaxies NGC 253 and IC 342 in the 3 mm wavelength regions were obtained. The results and discussion are summarized as follows.
-
1.
The observations were carried out with the Nobeyama 45 m radio telescope and with the wide-band observing system, which became available during our project. The beam size was 15′′.2–19′′.1, which is rather small among single-dish telescopes. This beam size can mainly probe the circumnuclear disk (CND) in NGC 1068 selectively.
-
2.
The numbers of lines detected were 25, 34, and 31 for NGC 1068, NGC 253, and IC 342, respectively. The numbers of atomic and molecular species (distinguishing isotopologues) identified were 19, 24, and 22 for NGC 1068, NGC 253, and IC 342, respectively. The hydrogen recombination lines were detected only in NGC 253.
-
3.
The integrated intensities normalized by that of CS ( = 2–1) or 13CO ( = 1–0) were compared among the galaxies. As a result, the normalized intensities of HCN (and H13CN) ( = 1–0), CN (and 13CN) ( = 1–0), and HC3N (e.g., = 11–10) in NGC 1068 were found to be stronger than those in NGC 253 and IC 342 with our beam. These results were discussed based on already reported mechanisms of mechanical heating for HCN, effect of X-rays on CN, and the high-temperature mid-plane shielded from X-rays for HC3N.
-
4.
The HCN ( = 1–0)/HCO+ ( = 1–0) integrated intensity ratios were found to be higher in NGC 1068 than those in NGC 253 and IC 342. The mechanical heating can be an important factor to affect the ratio. Along with the non-detection of CH3CCH in NGC 1068, but detection in NGC 253 and IC 342, these molecules are confirmed with our small beam to be good tracers to distinguish the power source in galaxies.
-
5.
The present integrated intensities in NGC 1068 and those obtained with the IRAM 30 m radio telescope by Aladro et al. (2013, 2015) in NGC 1068 were compared (Nobeyama 45 m/IRAM 30 m) to estimate the spatial distributions of molecules. As a result, the above ratios were demonstrated to be useful to estimate the distributions of molecules in the CND and/or the starburst ring.
-
6.
The first high quality results of line survey observations toward IC 342 in the 3 mm wavelength region were reported in this study. Cyclic-C3H2, SO, and C17O were detected for the first time. Generally the relative intensities of lines show a similar trend with those in NGC 253.
We are grateful to the members of the line survey project, which is one of the legacy projects with the Nobeyama 45 m telescope. We thank the staff members of Nobeyama Radio Observatory for their support of the observations and for the development of the new wide-band observing system, which enabled us rapid survey of lines. In particular, we thank Ryohei Kawabe for his encouragement to this project. We thank Hirofumi Inoue for his contribution to the initial stage of this project. We also thank Nanase Harada for useful comments to the initial stage of the manuscript. We also acknowledge Tomoka Tosaki for sending the original reduced data for the figure 1. This study was supported by the MEXT Grant-in-Aid for Specially Promoted Research JP20001003. We used excellent databases of molecular spectroscopy: CDMS, JPL Catalog, NIST Recommended Rest Frequencies, and Splatalogue. Data analysis was in part carried out on the open use computer system at the Astronomy Data Center of the National Astronomical Observatory of Japan.
References
- Aladro et al. (2011a) Aladro, R., Martín, S., Martín-Pintado, J., Mauersberger, R., Henkel, C., Ocaña Flaquer, B., & Amo-Baladrón, M. A. 2011a, A&A, 535, A84
- Aladro et al. (2015) Aladro, R., et al. 2015, A&A, 579, A101
- Aladro et al. (2011b) Aladro, R., Martín-Pintado, J., Martín, S., Mauersberger, R., & Bayet, E. 2011b, A&A, 525, A89
- Aladro et al. (2013) Aladro, R., et al. 2013, A&A, 549, A39
- Asplund et al. (2006) Asplund, M., Grevesse, N., & Jacques Sauval, A. 2006, Nuclear Physics A, 777, 1
- Balser et al. (2017) Balser, D. S., Wenger, T. V., Goss, W. M., Johnson, K. E., & Kepley, A. A. 2017, ApJ, 844, 73
- Bendo et al. (2015) Bendo, G. J., Beswick, R. J., D’Cruze, M. J., Dickinson, C., Fuller, G. A., & Muxlow, T. W. B. 2015, MNRAS, 450, L80
- Bland-Hawthorn et al. (1997) Bland-Hawthorn, J., Gallimore, J. F., Tacconi, L. J., Brinks, E., Baum, S. A., Antonucci, R. R. J., & Cecil, G. N. 1997, Ap&SS, 248, 9
- Braine et al. (2017) Braine, J., Shimajiri, Y., André, P., Bontemps, S., Gao, Y., Chen, H., & Kramer, C. 2017, A&A, 597, A44
- Chin et al. (1997) Chin, Y.-N., Henkel, C., Whiteoak, J. B., Millar, T. J., Hunt, M. R., & Lemme, C. 1997, A&A, 317, 548
- Colbert et al. (2002) Colbert, E. J. M., Weaver, K. A., Krolik, J. H., Mulchaey, J. S., & Mushotzky, R. F. 2002, ApJ, 581, 182
- Costagliola et al. (2011) Costagliola, F., et al. 2011, A&A, 528, A30
- Crosthwaite et al. (2000) Crosthwaite, L. P., Turner, J. L., & Ho, P. T. P. 2000, AJ, 119, 1720
- de Vaucouleurs et al. (1991) de Vaucouleurs, G., de Vaucouleurs, A., Corwin, Jr., H. G., Buta, R. J., Paturel, G., & Fouqué, P. 1991, Third Reference Catalogue of Bright Galaxies. Volume I: Explanations and references. Volume II: Data for galaxies between 0h and 12h. Volume III: Data for galaxies between 12h and 24h.
- Endres et al. (2016) Endres, C. P., Schlemmer, S., Schilke, P., Stutzki, J., & Müller, H. S. P. 2016, Journal of Molecular Spectroscopy, 327, 95
- Espada et al. (2017) Espada, D., et al. 2017, ApJ, 843, 136
- Falco et al. (1999) Falco, E. E., et al. 1999, PASP, 111, 438
- García-Burillo et al. (2014) García-Burillo, S., et al. 2014, A&A, 567, A125
- García-Burillo et al. (2010) García-Burillo, S., et al. 2010, A&A, 519, A2
- García-Burillo et al. (2017) García-Burillo, S., et al. 2017, ArXiv e-prints, 1709.05895
- Harada et al. (2010) Harada, N., Herbst, E., & Wakelam, V. 2010, ApJ, 721, 1570
- Harada et al. (2013) Harada, N., Thompson, T. A., & Herbst, E. 2013, ApJ, 765, 108
- Helfer & Blitz (1995) Helfer, T. T. & Blitz, L. 1995, ApJ, 450, 90
- Henkel et al. (1988) Henkel, C., Schilke, P., & Mauersberger, R. 1988, A&A, 201, L23
- Ikeda et al. (2001) Ikeda, M., Nishiyama, K., Ohishi, M., & Tatematsu, K. 2001, in Astronomical Society of the Pacific Conference Series, Vol. 238, Astronomical Data Analysis Software and Systems X, ed. F. R. Harnden, Jr., F. A. Primini, & H. E. Payne, 522
- Imanishi et al. (2016) Imanishi, M., Nakanishi, K., & Izumi, T. 2016, ApJ, 822, L10
- Iono et al. (2012) Iono, D., et al. 2012, PASJ, 64, L2
- Iwasawa et al. (1997) Iwasawa, K., Fabian, A. C., & Matt, G. 1997, MNRAS, 289, 443
- Izumi et al. (2016a) Izumi, T., et al. 2016a, ApJ, 818, 42
- Izumi et al. (2013) Izumi, T., et al. 2013, PASJ, 65, 100
- Izumi et al. (2016b) Izumi, T., Nakanishi, K., Imanishi, M., & Kohno, K. 2016b, MNRAS, 459, 3629
- Jackson et al. (1993) Jackson, J. M., Paglione, T. A. D., Ishizuki, S., & Nguyen-Q-Rieu. 1993, ApJ, 418, L13
- Kamazaki et al. (2012) Kamazaki, T., et al. 2012, PASJ, 64, 29
- Kamenetzky et al. (2011) Kamenetzky, J., et al. 2011, ApJ, 731, 83
- Kelly et al. (2017) Kelly, G., Viti, S., García-Burillo, S., Fuente, A., Usero, A., Krips, M., & Neri, R. 2017, A&A, 597, A11
- Kennicutt et al. (2008) Kennicutt, Jr., R. C., Lee, J. C., Funes, J. G., J., S., Sakai, S., & Akiyama, S. 2008, ApJS, 178, 247
- Kohno et al. (2003) Kohno, K., Ishizuki, S., Matsushita, S., Vila-Vilaró, B., & Kawabe, R. 2003, PASJ, 55, L1
- Kohno et al. (1996) Kohno, K., Kawabe, R., Tosaki, T., & Okumura, S. K. 1996, ApJ, 461, L29
- Kohno et al. (2001) Kohno, K., Matsushita, S., Vila-Vilaró, B., Okumura, S. K., Shibatsuka, T., Okiura, M., Ishizuki, S., & Kawabe, R. 2001, in Astronomical Society of the Pacific Conference Series, Vol. 249, The Central Kiloparsec of Starbursts and AGN: The La Palma Connection, ed. J. H. Knapen, J. E. Beckman, I. Shlosman, & T. J. Mahoney, 672
- Kohno et al. (2008) Kohno, K., Nakanishi, K., Tosaki, T., Muraoka, K., Miura, R., Ezawa, H., & Kawabe, R. 2008, Ap&SS, 313, 279
- Kraemer et al. (2015) Kraemer, S. B., Sharma, N., Turner, T. J., George, I. M., & Crenshaw, D. M. 2015, ApJ, 798, 53
- Krips et al. (2008) Krips, M., Neri, R., García-Burillo, S., Martín, S., Combes, F., Graciá-Carpio, J., & Eckart, A. 2008, ApJ, 677, 262
- Krolik & Kallman (1983) Krolik, J. H. & Kallman, T. R. 1983, ApJ, 267, 610
- Kuno et al. (2011) Kuno, N., et al. 2011, in 2011 XXXth URSI General Assembly and Scientific Symposium, JP2–19
- Lepp & Dalgarno (1996) Lepp, S. & Dalgarno, A. 1996, A&A, 306, L21
- Lilley & Palmer (1968) Lilley, A. E. & Palmer, P. 1968, ApJS, 16, 143
- Liu et al. (2013) Liu, S.-Y., Takano, S., & Line Survey Team. 2013, in Astronomical Society of the Pacific Conference Series, Vol. 476, New Trends in Radio Astronomy in the ALMA Era: The 30th Anniversary of Nobeyama Radio Observatory, ed. R. Kawabe, N. Kuno, & S. Yamamoto, 367
- Lovas (2004) Lovas, F. J. 2004, Journal of Physical and Chemical Reference Data, 33, 177
- Martín et al. (2015) Martín, S., et al. 2015, A&A, 573, A116
- Martín et al. (2006) Martín, S., Mauersberger, R., Martín-Pintado, J., Henkel, C., & García-Burillo, S. 2006, ApJS, 164, 450
- Mauersberger & Henkel (1991) Mauersberger, R. & Henkel, C. 1991, A&A, 245, 457
- Meier & Turner (2005) Meier, D. S. & Turner, J. L. 2005, ApJ, 618, 259
- Meier & Turner (2012) Meier, D. S. & Turner, J. L. 2012, ApJ, 755, 104
- Meier et al. (2015) Meier, D. S., et al. 2015, ApJ, 801, 63
- Meijerink et al. (2007) Meijerink, R., Spaans, M., & Israel, F. P. 2007, A&A, 461, 793
- Meijerink et al. (2011) Meijerink, R., Spaans, M., Loenen, A. F., & van der Werf, P. P. 2011, A&A, 525, A119
- Mouhcine et al. (2005) Mouhcine, M., Ferguson, H. C., Rich, R. M., Brown, T. M., & Smith, T. E. 2005, ApJ, 633, 810
- Müller et al. (2005) Müller, H. S. P., Schlöder, F., Stutzki, J., & Winnewisser, G. 2005, Journal of Molecular Structure, 742, 215
- Müller et al. (2001) Müller, H. S. P., Thorwirth, S., Roth, D. A., & Winnewisser, G. 2001, A&A, 370, L49
- Muxlow et al. (1996) Muxlow, T. W. B., Pedlar, A., Holloway, A. J., Gallimore, J. F., & Antonucci, R. R. J. 1996, MNRAS, 278, 854
- Nakajima et al. (2008) Nakajima, T., et al. 2008, PASJ, 60, 435
- Nakajima et al. (2010) Nakajima, T., Sakai, T., Kuno, N., & Ogawa, H. 2010, Journal of Infrared, Millimeter, and Terahertz Waves, 31, 143
- Nakajima et al. (2018) Nakajima, T., Takano, S., Kohno, K., Harada, N., & Herbst, E. 2018, PASJ, 70, 7
- Nakajima et al. (2015) Nakajima, T., et al. 2015, PASJ, 67, 8
- Nakajima et al. (2011) Nakajima, T., Takano, S., Kohno, K., & Inoue, H. 2011, ApJ, 728, L38
- Nakanishi et al. (2015) Nakanishi, K., et al. 2015, in Astronomical Society of the Pacific Conference Series, Vol. 499, Revolution in Astronomy with ALMA: The Third Year, ed. D. Iono, K. Tatematsu, A. Wootten, & L. Testi, 117
- Nemmen et al. (2006) Nemmen, R. S., Storchi-Bergmann, T., Yuan, F., Eracleous, M., Terashima, Y., & Wilson, A. S. 2006, ApJ, 643, 652
- Nishimura et al. (2016a) Nishimura, Y., Shimonishi, T., Watanabe, Y., Sakai, N., Aikawa, Y., Kawamura, A., & Yamamoto, S. 2016a, ApJ, 829, 94
- Nishimura et al. (2016b) Nishimura, Y., Shimonishi, T., Watanabe, Y., Sakai, N., Aikawa, Y., Kawamura, A., & Yamamoto, S. 2016b, ApJ, 818, 161
- Nishimura et al. (2017) Nishimura, Y., Watanabe, Y., Harada, N., Shimonishi, T., Sakai, N., Aikawa, Y., Kawamura, A., & Yamamoto, S. 2017, ApJ, 848, 17
- Papadopoulos et al. (1996) Papadopoulos, P. P., Seaquist, E. R., & Scoville, N. Z. 1996, ApJ, 465, 173
- Paron et al. (2014) Paron, S., Ortega, M. E., Cunningham, M., Jones, P. A., Rubio, M., Fariña, C., & Komugi, S. 2014, A&A, 572, A56
- Pence (1980) Pence, W. D. 1980, ApJ, 239, 54
- Pence (1981) Pence, W. D. 1981, ApJ, 247, 473
- Pickett et al. (1998) Pickett, H. M., Poynter, R. L., Cohen, E. A., Delitsky, M. L., Pearson, J. C., & Müller, H. S. P. 1998, J. Quant. Spec. Radiat. Transf., 60, 883
- Puxley et al. (1991) Puxley, P. J., Brand, P. W. J. L., Moore, T. J. T., Mountain, C. M., & Nakai, N. 1991, MNRAS, 248, 585
- Puxley et al. (1997) Puxley, P. J., Mountain, C. M., Brand, P. W. J. L., Moore, T. J. T., & Nakai, N. 1997, ApJ, 485, 143
- Qiu et al. (2018) Qiu, J., Wang, J., Shi, Y., Zhang, J., Fang, M., & Li, F. 2018, A&A, 613, A3
- Rangwala et al. (2014) Rangwala, N., Maloney, P. R., Glenn, J., Wilson, C. D., Kamenetzky, J., Schirm, M. R. P., Spinoglio, L., & Pereira Santaella, M. 2014, ApJ, 788, 147
- Rangwala et al. (2011) Rangwala, N., et al. 2011, ApJ, 743, 94
- Rekola et al. (2005) Rekola, R., Richer, M. G., McCall, M. L., Valtonen, M. J., Kotilainen, J. K., & Flynn, C. 2005, MNRAS, 361, 330
- Remijan et al. (2016) Remijan, A., Seifert, N. A., & McGuire, B. A. 2016, in 71st International Symposium on Molecular Spectroscopy
- Rigopoulou et al. (2013) Rigopoulou, D., et al. 2013, MNRAS, 434, 2051
- Rosenberg et al. (2014) Rosenberg, M. J. F., Kazandjian, M. V., van der Werf, P. P., Israel, F. P., Meijerink, R., Weiß, A., Requena-Torres, M. A., & Güsten, R. 2014, A&A, 564, A126
- Salak et al. (2018) Salak, D., Tomiyasu, Y., Nakai, N., Kuno, N., Miyamoto, Y., & Kaneko, H. 2018, ApJ, 856, 97
- Schinnerer et al. (2000) Schinnerer, E., Eckart, A., Tacconi, L. J., Genzel, R., & Downes, D. 2000, ApJ, 533, 850
- Scoville & Murchikova (2013) Scoville, N. & Murchikova, L. 2013, ApJ, 779, 75
- Snell et al. (2011) Snell, R. L., Narayanan, G., Yun, M. S., Heyer, M., Chung, A., Irvine, W. M., Erickson, N. R., & Liu, G. 2011, AJ, 141, 38
- Sorai et al. (2000) Sorai, K., Sunada, K., Okumura, S. K., Tetsuro, I., Tanaka, A., Natori, K., & Onuki, H. 2000, in Proc. SPIE, Vol. 4015, Radio Telescopes, ed. H. R. Butcher, 86–95
- Spinoglio et al. (2012) Spinoglio, L., et al. 2012, ApJ, 758, 108
- Sugimura et al. (2011) Sugimura, M., et al. 2011, PASJ, 63, 459
- Tacconi et al. (1997) Tacconi, L. J., Gallimore, J. F., Genzel, R., Schinnerer, E., & Downes, D. 1997, Ap&SS, 248, 59
- Takahashi et al. (2010) Takahashi, S., Takano, S., Iono, D., Kuno, N., Sakai, T., Horigome, O., & Yanagisawa, K. 2010, in Astronomical Society of the Pacific Conference Series, Vol. 434, Astronomical Data Analysis Software and Systems XIX, ed. Y. Mizumoto, K.-I. Morita, & M. Ohishi, 425
- Takano et al. (2013) Takano, S., et al. 2013, in Astronomical Society of the Pacific Conference Series, Vol. 476, New Trends in Radio Astronomy in the ALMA Era: The 30th Anniversary of Nobeyama Radio Observatory, ed. R. Kawabe, N. Kuno, & S. Yamamoto, 193
- Takano et al. (1995) Takano, S., Nakai, N., & Kawaguchi, K. 1995, PASJ, 47, 801
- Takano et al. (2014) Takano, S., et al. 2014, PASJ, 66, 75
- Tikhonov & Galazutdinova (2010) Tikhonov, N. A. & Galazutdinova, O. A. 2010, Astronomy Letters, 36, 167
- Tosaki et al. (2017) Tosaki, T., et al. 2017, PASJ, 69, 18
- Towle et al. (1996) Towle, J. P., Feldman, P. A., & Watson, J. K. G. 1996, ApJS, 107, 747
- Tully (1988) Tully, R. B. 1988, Nearby galaxies catalog (Cambridge and New York: Cambridge University Press)
- Usero et al. (2004) Usero, A., García-Burillo, S., Fuente, A., Martín-Pintado, J., & Rodríguez-Fernández, N. J. 2004, A&A, 419, 897
- van der Werf et al. (2010) van der Werf, P. P., et al. 2010, A&A, 518, L42
- Vila Costas & Edmunds (1993) Vila Costas, M. B. & Edmunds, M. G. 1993, MNRAS, 265, 199
- Viti et al. (2014) Viti, S., et al. 2014, A&A, 570, A28
- Watanabe et al. (2017) Watanabe, Y., Nishimura, Y., Harada, N., Sakai, N., Shimonishi, T., Aikawa, Y., Kawamura, A., & Yamamoto, S. 2017, ApJ, 845, 116
- Watanabe et al. (2014) Watanabe, Y., Sakai, N., Sorai, K., & Yamamoto, S. 2014, ApJ, 788, 4
- Wilson et al. (2013) Wilson, T. L., Rohlfs, K., & Hüttemeister, S. 2013, Tools of Radio Astronomy (Springer Verlag)
- Yamaguchi et al. (2011) Yamaguchi, T., et al. 2011, PASJ, 63, L37
- Yamaguchi et al. (2012) Yamaguchi, T., et al. 2012, PASJ, 64, 105
- Young et al. (1995) Young, J. S., et al. 1995, ApJS, 98, 219
Properties of the observed galaxies
Galaxy
(J2000.0)
(J2000.0)
Distance
Morphology
Activity
(Mpc)
(km s-1)
NGC 1068
\timeform2h42m40s.798∗
\timeform-00D00’47”.938∗
14.4†
1150∗
SA(rs)b‡
AGN and circumnuclear starburst
NGC 253
\timeform00h47m33s.3§
\timeform-25D17’23”§
3.5∥
230
SAB(s)c‡
nuclear starburst
IC 342
\timeform03h46m48s.9#
\timeform68D5’46.0”#
3.93∗∗
32††
SAB(rs)cd‡
nuclear starburst
{tabnote}
∗Schinnerer et al. (2000) : See also the footnote in the section of the observations.
†Tully (1988); Bland-Hawthorn et al. (1997)
‡de Vaucouleurs et al. (1991)
§Martín et al. (2006)
∥e.g., Rekola et al. (2005); Mouhcine et al. (2005)
#Falco et al. (1999)
∗∗Tikhonov & Galazutdinova (2010)
††Crosthwaite et al. (2000)
llllllll
Parameters of the lines in NGC 1068∗
Frequency† Molecule Transition
FWHM
Comment
(MHz)
(mK) (km s-1) (km s-1) (K km s-1)
\endhead\endfoot∗∗footnotemark: ∗
Errors correspond to 1.
††footnotemark: †
Frequencies are taken from Lovas (2004). In the case of a blended line due to fine and/or hyperfine structures,
a frequency of the strongest component is listed.
\endlastfoot
85338.906 cyclic-C3H2 21,2-10,1
51 114817 17640 1.20.1
85457.299 CH3CCH =5K–4K
— — — 0.14
upper limit
86340.167 H13CN = 1–0
71 11269 19620 1.40.2
86754.330 H13CO+ = 1–0
— — — 0.15
upper limit
86847.010 SiO = 2–1
51 109219 17646 0.80.2
87316.925 C2H = 1–0
202 111711 18724 4.40.3
partially blended
= 3/2–1/2
with = 1/2–1/2
87402.004 C2H = 1–0
91 111031 31380 2.60.3
= 1/2–1/2
87925.238 HNCO 40,4–30,3
63 113457 250134 1.60.2
88631.847 HCN = 1–0
1082 11173 2336 26.40.6
89188.526 HCO+ = 1–0
552 11325 23611 13.30.7
90663.574 HNC = 1–0
282 11387 20017 5.60.4
90978.989 HC3N = 10–9
164 107833 25477 4.71.0
93173.777 N2H+ = 1–0
81 111216 24537 2.10.4
96741.377 CH3OH = 2K–1K
51 110416 22540 1.10.2
97980.953 CS = 2–1
221 11235 24212 5.40.2
99299.905 SO = 32–21
41 119426 21962 0.80.2
100076.385 HC3N = 11–10
92 109419 17146 1.60.3
108651.297 13CN = 1–0
21 107621 19150 0.40.1
= 1/2–1/2
108780.201 13CN = 1–0
31 109921 19750 0.50.1
= 3/2–1/2
109173.638 HC3N = 12–11
51 110316 22936 1.30.1
109782.173 C18O = 1–0
111 112710 32024 3.30.2
109905.753 HNCO 50,5–40,4
41 113315 20948 0.90.1
110201.353 13CO = 1–0
361 11435 24111 8.90.2
110383.522 CH3CN =6K–5K
31 112331 28773 1.00.2
112358.988 C17O = 1–0
5 — — —
tentative detection
113191.317 CN = 1–0
631 11913 2757 18.50.3
= 1/2–1/2
113490.982 CN = 1–0
1102 11192 2395 27.60.4
= 3/2–1/2
115271.202 CO = 1–0
63816 11433 2377 1551
llllllll
Parameters of the lines in NGC 253∗
Frequency† Molecule Transition
FWHM
Comment
(MHz)
(mK) (km s-1) (km s-1) (K km s-1)
\endhead\endfoot∗∗footnotemark: ∗
Errors correspond to 1.
††footnotemark: †
Frequencies are taken from Lovas (2004). In the case of a blended line due to fine and/or hyperfine structures,
a frequency of the strongest component is listed. Frequencies of the recombination
lines are taken from Lilley & Palmer (1968) and Towle et al. (1996).
\endlastfoot
85338.906 cyclic-C3H2 21,2-10,1
332 2306 15513 5.10.4
85457.299 CH3CCH =5K–4K
102 20820 21848 2.30.2
86340.167 H13CN = 1–0
242 2508 18418 4.40.7
86754.330 H13CO+ = 1–0
124 26818 12343 1.60.3
86847.010 SiO = 2–1
172 22712 17928 3.00.3
87316.925 C2H = 1–0
1223 2522 1766 241
partially blended
= 3/2–1/2
with = 1/2–1/2
87402.004 C2H = 1–0
672 2005 28614 191
= 1/2–1/2
87925.238 HNCO 40,4–30,3
234 27911 17228 4.20.7
88631.847 HCN = 1–0
3417 2682 1944 701
89188.526 HCO+ = 1–0
2796 2642 2005 591
90663.574 HNC = 1–0
1465 2463 1957 301
90978.989 HC3N = 10–9
323 25110 21424 7.60.8
93173.777 N2H+ = 1–0
755 2376 17513 141
95169.516 CH3OH 80,8–7
113 24921 17049 2.00.3
96412.961 C34S = 2–1
172 25810 15824 2.90.3
96741.377 CH3OH = 2K–1K
703 2645 20211 14.50.3
97980.953 CS = 2–1
2085 2452 1975 42.80.4
99022.96 H atom H40
101 22415 24435 2.50.2
99299.905 SO = 32–21
252 2475 16812 4.20.3
100076.385 HC3N = 11–10
553 2375 17611 9.90.2
102547.983 CH3CCH =6K–5K
223 2839 14422 2.80.5
106737.36 H atom H39
114 21928 16266 2.00.3
108651.297 13CN = 1–0
62 22414 9833 0.50.3
= 1/2–1/2
108780.201 13CN = 1–0
61 23411 11123 0.90.2
= 3/2–1/2
108893.929 CH3OH 00,0–1
112 28916 17737 1.90.5
109173.638 HC3N = 12–11
423 2396 16614 7.00.3
109782.173 C18O = 1–0
904 2684 1989 191
109905.753 HNCO 50,5–40,4
253 2818 16220 4.20.3
110201.353 13CO = 1–0
2998 2672 1966 60.60.4
110383.522 CH3CN =6K–5K
162 25812 18929 3.20.2
112358.988 C17O = 1–0 135 23823 12155 1.50.6
113191.317 CN = 1–0
2436 2933 2366 611
= 1/2–1/2
113490.982 CN = 1–0
4229 2472 2005 891
= 3/2–1/2
115271.202 CO = 1–0
424171 2772 1934 8703
115556.253 NS = 5/2–3/2 ()
— — — —
tentative detection
partially blended with CO
llllllll
Parameters of the lines in IC 342∗
Frequency† Molecule Transition
FWHM
Comment
(MHz)
(mK) (km s-1) (km s-1) (K km s-1)
\endhead\endfoot∗∗footnotemark: ∗
Errors correspond to 1.
††footnotemark: †
Frequencies are taken from Lovas (2004). In the case of a blended line due to fine and/or hyperfine structures,
a frequency of the strongest component is listed.
‡‡footnotemark: ‡
Five detected fine and hyperfine components of
C2H are Gaussian fitted with a common and linewidth.
The differences in frequency were fixed in the fitting.
§§footnotemark: §
Sum of the (partially) blended features.
\endlastfoot
84521.206 CH3OH 5-1-40
72 259 6722 0.50.1
85338.906 cyclic-C3H2 21,2-10,1
151 303 597 0.90.4
85457.299 CH3CCH =5K–4K
81 485 5311 0.50.1
86340.167 H13CN = 1–0
141 332 556 0.80.1
86754.330 H13CO+ = 1–0
72 395 4913 0.40.1
86847.010 SiO = 2–1
81 516 7111 0.70.1
87316.925 C2H‡ = 1–0
282 324 505 2.10.1§
partially blended
= 3/2–1/2
with = 1–0
= 2–1
87328.624 C2H‡ = 1–0
114 324 505 —
= 3/2–1/2
= 1–0
87402.004 C2H‡ = 1–0
155 324 505 1.10.1§
blended with = 0–1
= 1/2–1/2
= 1–1
87407.165 C2H‡ = 1–0
66 324 505 —
= 1/2–1/2
= 0–1
87446.512 C2H‡ = 1–0
42 324 505 0.30.1
= 1/2–1/2
= 1–0
87925.238 HNCO 40,4–30,3
374 393 496 1.90.1
88631.847 HCN = 1–0
1833 331 591 11.60.1
89188.526 HCO+ = 1–0
1403 331 552 8.40.1
89487.414 HOC+ = 1–0
10 — — —
tentative detection
90663.574 HNC = 1–0
823 291 502 4.50.1
90978.989 HC3N = 10–9
173 415 5812 1.10.2
93173.777 N2H+ = 1–0
403 372 605 2.70.2
96412.961 C34S = 2–1
101 352 406 0.40.1
96741.377 CH3OH = 2K–1K
531 361 532 2.80.1
97980.953 CS = 2–1
961 32.60.3 511 5.10.1
99299.905 SO = 32–21
131 302 605 0.90.1
100076.385 HC3N = 11–10
172 372 385 0.70.1
102547.983 CH3CCH =6K–5K
81 547 7216 0.60.1
108893.929 CH3OH 00,0–1
71 356 7415 0.60.1
109173.638 HC3N = 12–11
131 393 536 0.70.1
109782.173 C18O = 1–0
772 321 511 4.20.1
109905.753 HNCO 50,5–40,4
302 401 463 1.50.1
110201.353 13CO = 1–0
2943 32.40.3 521 16.20.1
110383.522 CH3CN =6K–5K
82 396 6615 0.60.1
112358.988 C17O = 1–0
93 269 6520 0.70.2
113191.317 CN = 1–0
233 — 7413 —
3 hyperfine components
= 1/2–1/2
582 — 1037 8.20.3§
are partially blended
113490.982 CN = 1–0
1494 211 772 12.20.2
= 3/2–1/2
115271.202 CO = 1–0
267118 32.30.2 56.30.4 160.00.4
lllllll
Normalized integrated intensity∗
Molecule Normalized by CS ( = 2–1)
Normalized by 13CO ( = 1–0)
NGC 1068 NGC 253 IC 342 NGC 1068 NGC 253 IC 342
\endhead\endfoot∗∗footnotemark: ∗
Errors correspond to 1.
††footnotemark: †
Low signal to noise ratio of HC3N ( = 10–9)
in NGC 1068.
\endlastfootHCN ( = 1–0) 4.90.2 1.640.03 2.270.05
2.970.09 1.160.02 0.720.01
HCO+ ( = 1–0) 2.50.2 1.380.03 1.650.04
1.490.09 0.970.02 0.520.01
H13CN ( = 1–0) 0.260.04 0.100.02 0.160.02
0.160.02 0.070.01 0.050.01
CN ( = 1–0, = 3/2-1/2) 5.10.2 2.080.03 2.390.06
3.100.08 1.470.02 0.750.01
13CN ( = 1–0, = 3/2-1/2) 0.090.02 0.0210.005 —
0.060.01 0.0150.003 —
HC3N ( = 10-9) 0.90.2† 0.180.02 0.220.04
0.50.1† 0.130.01 0.070.01
HC3N ( = 11-10) 0.300.06 0.230.01 0.140.02
0.180.03 0.1630.004 0.040.01
HC3N ( = 12-11) 0.240.02 0.160.01 0.140.02
0.150.01 0.120.01 0.040.01
llllll
Integrated intensity ratio of HCN/HCO+ and ratios
between isotopic species∗
Ratio ( = 1–0) NRO 45 m (Present study)
IRAM 30 m (Aladro et al. 2015)
NGC 1068 NGC 253 IC 342 NGC 1068 NGC 253
\endhead\endfoot∗∗footnotemark: ∗
Errors correspond to 1.
††footnotemark: †
An upper limit of the H13CO+ ( = 1–0)
integrated intensity is used.
See the section 4.1.3.
‡‡footnotemark: ‡
H13CO+ ( = 1–0)
is not detcted (or blended with SiO ( = 2–1)).
\endlastfootHCN/HCO+
1.980.11 1.190.03 1.380.02
1.640.03 1.180.02
H13CN/H13CO+
3.1† 2.80.7 2.00.6
—‡ 1.20.1
CO/13CO 17.40.4 14.40.1 9.880.07
6.20.1 13.20.2
CO/C18O 473 462 38.10.9
20.80.5 481
HCN/H13CN 193 163 152
303 14.50.4