Long-term optical spectral monitoring of a changing-look AGN NGC 3516 I: Continuum and broad-line flux variability
Abstract
Here we present the long-term optical spectral monitoring of a changing-look active galactic nuclei (AGN) NGC 3516 that covers 22 years (from 1996 to 2018). We explore a variability in the broad lines and continuum, finding that the continuum is changing by more than a factor of 2, while the broad lines are varying by more than a factor of 10. The minimum of activity is observed in 2014, when the broad lines almost disappeared. We confirm that NGC 3516 is a changing-look AGN, and the absorption seen in the UV and X-ray may indicate that there is an obscuring region which is responsible for this.
The line profiles are also changing. The mean profiles of the broad H and H lines show shoulder-like structure in the wings, and enhanced peak, that may indicate a complex BLR. The rms-profiles of both lines seem to have the same shape and width of around 4200 km s-1, indicating practically the same kinematics in the H and H emitting regions.
Measured time-lags between the continuum and H and H broad-line variability are 15 and 17 days, respectively, that in combination with the broad lines width allows us to estimate the NGC 3516 central black hole mass. We find that the black hole mass is (4.731.40) which is in agreement with previous estimates.
keywords:
galaxies: active – galaxies: quasar: individual (NGC 3516) – galaxies: Seyfert – galaxies: quasars: emission lines – line: profiles1 Introduction
The nature of the "central engine" of active galactic nuclei (AGN) is still an open question. However, usually it is assumed that the nuclear activity is caused by the accretion of matter on a super-massive black hole (SMBH, see Rees, 1984; Begelman, 1985). The radiation from the accretion disc is ionizing the surrounding gas, that forms a so called broad line region (BLR), which is located very close to the central SMBH (r0.1 pc). The BLR is very compact (several 10s to several 100s light days), i.e. dimensions of the BLR correspond to approximately 10-4 arcsec in the nearest AGN, which is a great challenge to resolve with the current largest telescopes, e.g. for now only the BLR of a quasar 3C 273 is resolved using the GRAVITY interferometer (Sturm et al., 2018). Therefore, spectroscopy and/or spectro-polarimetry can give valuable information about the BLR structure in a larger number of AGN (see Afanasiev et al., 2018). Over the past 40 years, the variability of broad emission lines and continuum in the majority of AGN has been detected. Already from the pioneering works in the seventies (see Cherepashchuk & Lyutyi, 1973; Boksenberg et al., 1978) it became clear that the intensities of the broad emission lines in AGN change with a time delay of 1-3 weeks with respect to the continuum change. The time delay depends on the time of passage of light through the BLR and on the BLR geometry and kinematics (Bochkarev & Antokhin, 1982; Blandford & McKee, 1982) This can be used for investigations of the BLR structure and dimension, i.e. by finding correlations between changes in the continuum and broad-line fluxes it is possible to "map" the BLR structure. This method is a so called reverberation method (see Peterson, 1993, and references therein). Additionally, one can explore the BLR evolution by studying the variability of the broad emission lines on a long time scale, i.e. study the changes in the BLR physics, kinematics and geometry as a function of time. Finally, the BLR is supposed to be near to the SMBH in AGN and may hold basic information about the formation and fueling of AGN, and especially can give information about the central black hole mass in the case of the BLR virialization.
Here we study the variability of the broad emission lines and continuum of active galaxy NGC 3516 on a long time scale (1996–2018). NGC 3516 was one of the first observed active galaxies that showed a variable flux in the broad lines (Andrillat & Souffrin, 1968) The galaxy is a close (z0.009), bright (V12.5 magnitude, but also variable) object with the morphological type SBO. The optical spectrum of the NGC 3516 nucleus was studied repeatedly (see Collin-Souffrin et al., 1973; Adams & Weedman, 1975; Boksenberg & Netzer, 1977; Osterbrock, 1977; Crenshaw, 1986; Wanders et al., 1993, and reference therein). Strong variations in the intensity of the broad lines and optical Fe II lines were reported in several papers (Souffrin, 1968; Andrillat, 1971; Collin-Souffrin et al., 1973; Boksenberg & Netzer, 1977; Collin-Souffrin, 1980; Bochkarev et al., 1990). In NGC 3516 the contribution of the absorption spectrum of the galactic nucleus stellar component is very significant (Crenshaw & Peterson, 1985), and in addition, NGC 3516 shows a strong intrinsic UV absorption, which is blueshifted (Goad et al., 1999). The absorption lines width and ionization state are consistent with one expected in the narrow line region (NLR), i.e. it seems that the origin of the UV absorption in NGC 3516 is in the NLR (see Goad et al., 1999).
This significant contribution of the stellar population to the AGN continuum, estimated from the aperture of the size of 1.0, is 70% to the continuum flux in the H wavelength region (Bochkarev et al., 1990). This makes NGC 3516 potentially a very interesting AGN, since there is a huge contribution of the circum-nuclear component, and in addition, in the center resides a low luminosity AGN that emits the broad Hydrogen emission which is strongly time-variable. The observed H/H (5, see e.g. Devereux, 2016) is larger than the theoretical Case B value, which is expected from the pure photoionization model (Osterbrock & Ferland, 2006). However, a special case of photoionizaton model could explain the observed Balmer lines ratio (Devereux, 2016), as well as some alternative approaches (Popović et al., 2002). In addition, the effects of collisional excitation and dust extinction could be the reason of such large deviation of the Balmer decrement.
In 1990 the first tight spectral and photometric optical monitoring during 5 months was performed as part of the LAG (Lovers of Active Galaxies) collaboration (Wanders et al., 1993; Wanders & Horne, 1994; Onken et al., 2003). A large amplitude of variability of broad lines and continuum, variable asymmetric line profiles, and a variable dip in the blue wing of H were detected, and time-lags were also estimated (H-14 and H-7 days Wanders & Horne, 1994). In 2007 a high sampling rate, 6-month optical reverberation mapping campaign of NGC 3516, was undertaken at MDM Observatory with the support of observations at several telescopes (Denney et al., 2010). They showed that the H emission region within the BLR of NGC 3516 has complex kinematics (clearly see evidence for outflowing, infalling, and virialized BLR) and reported an updated time-delay of the broad H line (11.7 days). Additionally, the line shape investigation given by Popović et al. (2002) indicated a presence of a disc-like BLR which emits mostly in the line wings, and another BLR component (so called intermediate BLR - IBLR) which emits narrower lines and contributes to the line core. Recently, De Rosa et al. (2018) found that the time delay between the continuum and H is 4-8 days, that in combination with the measured root-mean-square (rms) profile of H width (around 2440 km s-1) gives the central black hole mass of . Finally, NGC 3516 was under the simultaneous monitoring in the X-ray and optical B-band in 2013–2014 (Noda et al., 2016), when the object was detected in its faint phase.
In this paper (Paper I), we present the results of the long-term photometric (B,V,R) and spectral (in the H and H wavelength band) monitoring of NGC 3516 during the period between 1996 and 2018, and discuss the broad line and continuum flux variability. In Paper II we are going to investigate the changes in the BLR, i.e. in the shape of broad lines. The paper is organized as follows: in Section 2 we report on our observations and describe the data reduction; in Section 3 we describe the performed data analysis, and in Section 4 we discuss our results; finally in Section 5 we outline our conclusions.
| N | MJD | Seeing | mB | mV | mR |
| 2400000+ | [arcsec] | ||||
| 1 | 2 | 3 | 4 | 5 | 6 |
| 1 | 52996.63 | 1.3 | 13.9450.002 | 13.0530.044 | 12.4060.013 |
| 2 | 53031.55 | 2.0 | 14.0230.043 | 13.1150.019 | 12.4710.019 |
| 3 | 53058.48 | 2.5 | 14.0440.007 | 13.1290.039 | 12.4220.081 |
| 4 | 53088.44 | 3.0 | 14.0280.006 | 13.1490.004 | 12.4930.000 |
| 5 | 53122.23 | 3.0 | 13.9210.004 | 13.0620.018 | 12.3860.006 |
| 6 | 53149.33 | 1.5 | 13.7580.022 | 13.0240.008 | 12.3800.015 |
| 7 | 53347.57 | 3.0 | 13.7730.009 | 12.9990.005 | 12.3410.011 |
| 8 | 53386.55 | 1.2 | 13.6110.000 | 12.8690.010 | 12.2380.016 |
| 9 | 53405.49 | 2.2 | 13.6480.007 | 12.9110.012 | 12.2740.007 |
| 10 | 53413.47 | 2.2 | 13.7140.018 | 12.9570.004 | 12.3190.005 |
2 Observations and data reduction
Details about the observations, calibration and unification of the spectral data, and measurements of the spectral fluxes are reported in our previous works (see Shapovalova et al., 2001, 2004, 2008, 2010, 2012, 2013, 2016, 2017, and references therein), and will not be repeated here. However, we give some basic information about photometric and spectral observations of NGC 3516 and data reduction.
| Observatory | Code | Tel.aperture + equipment | Aperture [arcsec] | Focus |
|---|---|---|---|---|
| 1 | 2 | 3 | 4 | 5 |
| SAO (Russia) | L(N) | 6 m + Long slit | 2.06.0 | Nasmith |
| SAO (Russia) | L(U) | 6 m + UAGS | 2.06.0 | Prime |
| GHO (México) | GHO | 2.1 m + B&C | 2.56.0 | Cassegrain |
| SAO (Russia) | Z1 | 1 m + UAGS | 4.019.8 | Cassegrain |
| SAO (Russia) | Z2K | 1 m + UAGS | 4.09.45 | Cassegrain |
| N | UT-date | MJD | Code | Aperture | Sp.range | Seeing |
|---|---|---|---|---|---|---|
| 2400000+ | [arcsec] | [Å] | [arcsec] | |||
| 1 | 2 | 3 | 4 | 5 | 6 | 7 |
| 1 | 14.01.1996 | 50096.63 | Z1 | 4.019.8 | 3738-6901 | 4.0 |
| 2 | 20.01.1996 | 50103.47 | L(N) | 4.019.8 | 5100-7300 | - |
| 3 | 19.03.1996 | 50162.31 | L(N) | 2.06.0 | 3702-5595 | 3.0 |
| 4 | 20.03.1996 | 50163.35 | L(N) | 2.06.0 | 3702-5595 | 4.5 |
| 5 | 05.10.1997 | 50726.62 | L(N) | 2.06.0 | 3845-6288 | 4.0 |
| 6 | 07.10.1997 | 50728.64 | L(N) | 2.06.0 | 3845-6289 | 4.0 |
| 7 | 20.01.1998 | 50834.34 | L(N) | 2.06.0 | 3838-6149 | 2.5 |
| 8 | 28.01.1998 | 50842.44 | L(U) | 2.06.0 | 4540-5348 | 2.8 |
| 9 | 22.02.1998 | 50867.31 | L(N) | 2.06.0 | 3837-6149 | 2.0 |
| 10 | 07.05.1998 | 50940.53 | L(N) | 2.06.0 | 3738-6149 | 3.0 |
| Sample | Years | Aperture | Scale factor | Extended source correction |
|---|---|---|---|---|
| (arcsec) | () | G(g) | ||
| GHO | 1999-2007 | 2.56.0 | 1.000 | 0.000 |
| GHO(m) | 1999-2007 | 2.56.0 | 1.0200.085 | 0.000 |
| L(U,N) | 1999-2010 | 2.06.0 | 1.2300.049 | 1.421.18 |
| Z1K | 1999-2004 | 4.019.8 | 1.3500.110 | 6.580.73 |
| Z2K | 2003-2017 | 4.09.45 | 1.3190.072 | 5.922.45 |
2.1 Photometric observations
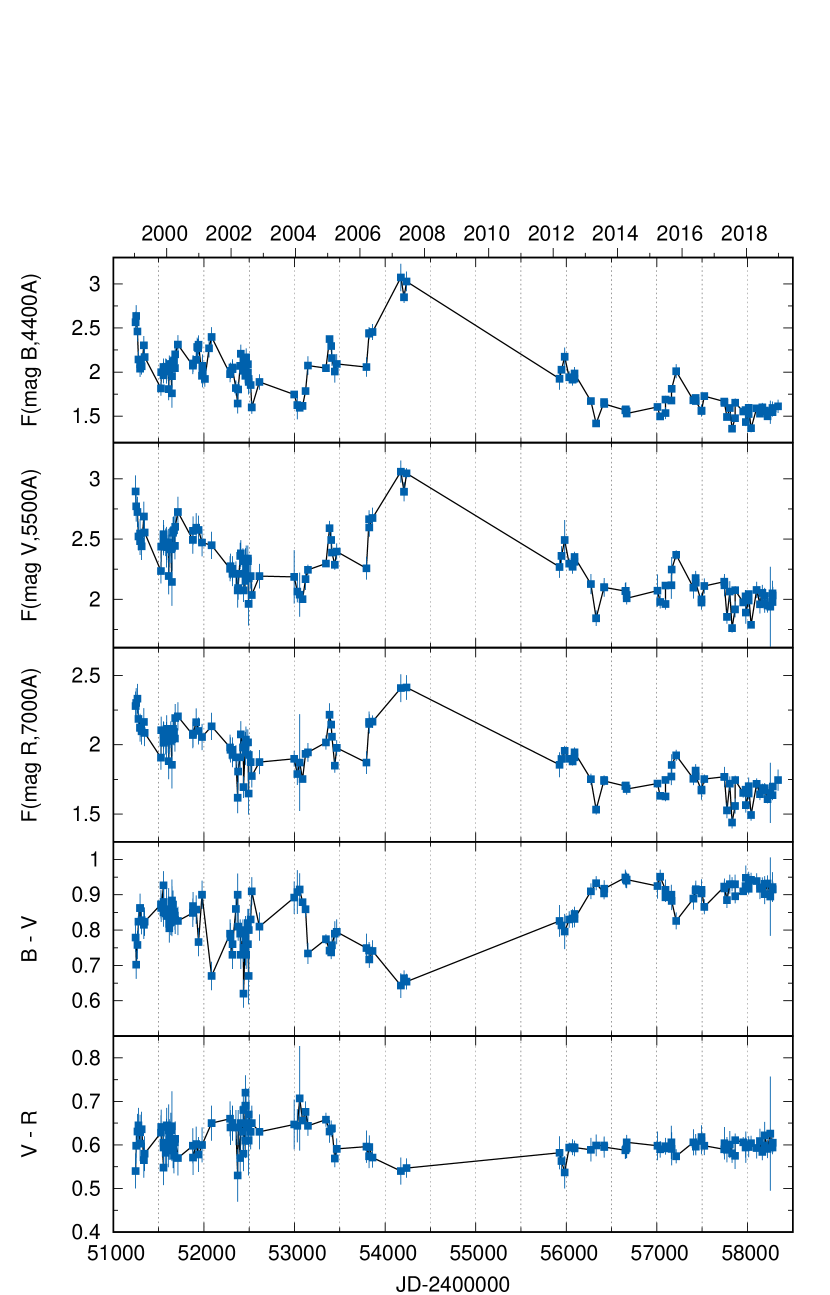
The photometry in the BVR filters of NGC 3516 was performed at the Special Astrophysical Observatory of the Russian Academy of Science (SAO RAS) during the 1999 – 2017 period (139 nights) with CCD-photometers of 1-m and 60-cm Zeiss telescopes. The photometric system is similar to those of Johnson in B and V, and of Cousins in R spectral band (Cousins, 1976). The software developed at SAO RAS by Vlasyuk (1993) was used for the data reduction. Photometric standard stars from Penston et al. (1971), in 1998–2003, and from Doroshenko et al. (2005), in 2004–2017, were used. In Table 1 the photometric BVR-magnitude data for the aperture of 10″are presented. In Figure 1 we plot the light curves in the BVR bands and (B-V), (V-R) color indexes. For the light curves (Fig. 1), the magnitudes [m(B), m(V),m(R)] were transformed into fluxes F(B), F(V) and F(R) in units of 10-15 erg cm-2 s-1 Å-1, using the equations from Dietrich et al. (1998).
2.2 Spectral observations
Spectral monitoring of the galaxy NGC 3516 was carried out in 1996–2007 and 2014–2018 during 160 observing nights. Spectra were taken with the 6 m and 1 m telescopes of the SAO RAS, Russia (1996–2018), and with the 2.1 m telescope of the Instituto Nacional de Astrofísica, Óptica y Electrónica (INAOE) at the "Guillermo Haro Observatory" (GHO) at Cananea, Sonora, Mexico (1998–2007). They were obtained with long-slit spectrographs equipped with CCDs. The typical covered wavelength interval was from 3700 Å to 7700 Å, the spectral resolution was between (8–10) Å or (12–15) Å, and the signal-to-noise (S/N) ratio was 40–50 in the continuum near the H and H lines. Spectrophotometric standard stars were observed every night. Table 2 provides a short information on the source of spectroscopic observations. The log of spectroscopic observations is given in Table 3. The spectrophotometric data reduction was carried out using either the software developed at SAO RAS (Vlasyuk, 1993) or the IRAF package for the spectra obtained at GHO, and it included bias and flat-field corrections, cosmic ray removal, 2D wavelength linearization, sky spectrum subtraction, addition of the spectra for every night, and relative flux calibration based on spectrophotometric standard star observations. In the analysis, about 10% of the spectra were discarded for several different reasons (e.g. high noise level, badly corrected spectral sensitivity, poor spectral resolution 15 Å, etc.). Thus, our final data set consists of 123 blue (covering H) and 89 red (covering H) spectra, taken during 146 nights, which we use in further analysis.
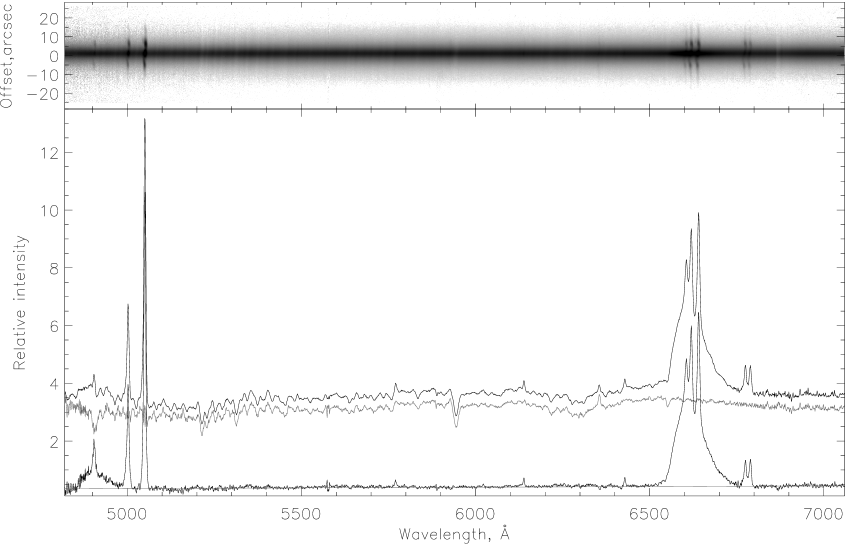
Additionally, we observed NGC 3516 with the 6 m telescope with the SCORPIO-2 spectrograph on February 1, 2017 in the spectral range from 4820 Å to 7060 Å. The observations were done in spectro-polarimetic mode with the grating VPHG1800@590 giving a dispersion of 0.5 Å per px with a spectral resolution of 4.5 Å. The slit width was 2″, and the height was 57″. The exposure time was 3600 s and seeing was 2.3″. The observed spectrum is shown in Figure 2 (top panel), from which, due to its high-quality we could extract the composite spectra (aperture size of 2″4″, top spectrum, bottom panel), the spectrum of the host galaxy (middle spectrum, bottom panel) and the pure AGN spectrum (bottom spectrum, bottom panel). To subtract the host galaxy spectrum from the composite one, we extracted the offset spectra from two regions in the range from -3″to -18″below and from +3″’ to +18″above the center. The averaged values (middle spectrum, bottom panel) is subtracted from the composite spectrum, and we obtained the spectrum of the pure AGN (bottom spectrum, bottom panel), which is showing the presence of weak broad components in the H and H lines. As it can be seen from the Figure 2 the narrow and broad lines are present.
The above procedure for the host-galaxy subtraction, could be done only in the case of the latest high-quality spectrum. In order to test if there is a "hidden" broad-line component in the H and H line profiles in all spectra from our campaign, we estimated the host-galaxy contribution using the spectral principal component analysis (PCA), a statistical method which is described in Francis et al. (1992); Vanden Berk et al. (2006). We applied the PCA to the year-average spectra, obtained from those spectra covering the total wavelength range. Vanden Berk et al. (2006) introduced the application of this statistical method for spectral decomposition of a composite spectrum into a pure-host and pure-AGN part. The PCA uses eigenspectra of AGN and galaxies, whose linear combination can reproduce the observed spectrum (see Francis et al., 1992; Connolly et al., 1995; Yip et al., 2004a, b, etc.). An example of the PCA decomposition of the year-average observed spectrum (from 1997) to the host-galaxy and pure-AGN spectrum is shown in Figure 3. The obtained host-galaxy spectra were subtracted from the observed year-average spectra in order to obtain the pure AGN component.


2.3 Absolute calibration (scaling) of the spectra
Usually, for the absolute calibration of the spectra of AGN, fluxes in the narrow emission lines are used because it is assumed that they are not variable at intervals of tens of years (Peterson, 1993). All blue spectra of NGC 3516 were thus scaled to the constant flux of F([O III] (5007+4959) = 4.4710-13 erg cm-2 s-1. This value is obtained using the data of Denney et al. (2010) for F([O III] 5007)= 3.3510-13 erg cm-2 s-1 and the flux ratio of F([O III] 5007)/F([O III] 4959) = 3 (see Dimitrijević et al., 2007).
The scaling method of the blue spectra (see Shapovalova et al., 2004) allows us to obtain a homogeneous set of spectra with the same wavelength calibration and the same [O III] 4959+5007 fluxes. The spectra obtained using the SAO 1-m telescope with the resolution of 8-10 Å (UAGS+CCD2K, Table 2) and spectra of 2.1m telescope with the resolution 12-15 Å (Boller&Chivens spectrograph + a grism of 150 l/mm) are covering both the H and H spectral bands. These spectra were scaled using the [O III] 4959+5007 lines, and consequently, the red spectral band was automatically scaled to the flux of these lines.
The blue spectra of NGC 3516 in the wavelength region of (3700–5800) Å and with the spectral resolution of 8 Å, taken with the 6 m and 1 m telescopes of SAO RAS and with the 2.1 m telescope of GHO111Code L(N), L(U), Z1 and GHO from Tables 2 and 3 were also scaled using the flux of the [O III] 4959+5007 lines. The red spectra observed at the same night (or next night) in the wavelength region (5600–7600) Å were first scaled to the fluxes of [S II] 6717+6731 lines, and then the scaling was corrected using the overlapping continuum with the corresponding blue spectrum which was scaled to [O III] 4959+5007. The [S II] 6717+6731 total flux was determined from the scaled spectra covering the entire wavelength range. However, the accuracy of the scaling of the red region depends both on the accuracy of the determination of the [S II] lines flux and on the slope of the continuum. In the spectra of NGC 3516, the fluxes in the [S II] 6717,6731 lines are almost an order of magnitude smaller then the fluxes in the [O III] 4959,5007 lines. Therefore, when scaling to the [S II] 6717+6732 flux, the scaling accuracy varied within 2-10%, depending on the quality of the spectrum. To improve the accuracy of the scaling, we used overlapping sections of the continuum of the blue and red spectra recorded on the same or next night. However, in this case the accuracy of the scaling procedure depends strongly on the determination of the continuum slope in the blue and red spectral band, i.e. one has to carefully account the spectral sensitivity of the equipment. This has been performed by using the comparison stars. In poor photometric conditions (clouds, mist, etc.) the reduction can give a wrong spectral slope (fall or rise) and, consequently, the errors in the scaling procedure for the H wavelength band can be larger. Usually (as a rule), the fluxes in the H line and red continuum determined from the spectra scaled to the [S II] 6717+6731 flux or using the overlapping sections of the continuum show little difference (less than 5%), but in several red spectra (6%) the fluxes differ up to 10%. In the latter case, we used the flux from the average spectrum. Similarly, in the case of spectra that cover the whole wavelength range, which were scaled to [O III] 4959+5007, for better precision, we also scaled the spectra using the flux in [S II] 6717+6731. Then we compared the fluxes in the H line and the red continuum obtained from two differently scaled spectra, and if there were differences of more than 5%, the average flux was used. As it was mentioned at the beginning of Section 2, more details on the scaling can be found in our previously published papers (see e.g. Shapovalova et al., 2001, 2004, 2008, 2010, 2012, 2013, 2016, 2017).
2.4 Measurements of the spectral fluxes, their unification and errors
Using the scaled spectra, we determined the fluxes in the blue and red continuum and in the broad emission lines for each data set (i.e. data with a given aperture and telescope from Table 2). The average flux in the continuum near the H line at the observed wavelength 5145 Å (5100 Å in the rest frame) was obtained by averaging flux in the spectral range of (5130–5160) Å. The continuum near the H line at the observed wavelength 6385 Å (6330 Å in the rest frame), was measured by averaging fluxes in the spectral range of (6370–6400) Å. To measure the observed fluxes of H and H, it is necessary to subtract the underlying continuum. For this goal, a linear continuum was fitted through the windows of 20 Å, located at observed wavelength 4760 Å and 5120 Å for H, and at 6390 Å and 6820 Å for H. After the continuum subtraction, we defined the line fluxes in the following observed wavelength bands: from 4845 Å to 4965 Å for H and from 6490 Å to 6750 Å for H.
In order to investigate the long-term spectral variability of an AGN, it is necessary to gather a consistent and uniformed data set. Since observations were carried out using instruments of different apertures, it is necessary to correct the line and continuum fluxes for these effects (Peterson & Collins, 1983). As reported in our previous papers (Shapovalova et al., 2001, 2004, 2008, 2010, 2012, 2013, 2016, 2017) we determined a point-source correction factor () and an aperture-dependent correction factor to account for the host galaxy contribution to the continuum (G(g)). We used the following expressions (see Peterson et al., 1995)
| (1) | |||
| (2) |
where index "obs" denotes the observed flux, and "true" the aperture corrected flux. The spectra of the 2.1 m telescope at GHO (INAOE, Mexico) within an aperture of 2.5″6.0″were adopted as standard (i.e. = 1.0, G(g)=0 by definition). The correction factors and G(g) are determined empirically by comparing pairs of simultaneous observations from each of given telescope data sets (see Table 4) to that of the standard data set (as it was used in AGN Watch, see e.g. Peterson et al., 1994, 1998, 2002). The time intervals between observations which were defined as quasi-simultaneous are typically of 1-3 days. In Table 5, the fluxes for the continuum at the rest-frame wavelengths at 5100 Å and 6330 Å, as well as the H and H lines and their errors are given. The mean errors of the continuum and line fluxes are in the interval between 3.3% and 4.5%. The error-bars were estimated by comparing measured fluxes from the spectra obtained within the time interval that is shorter than 3 days. The flux errors listed in Table 5 were estimated using the mean errors.
| N | UT-date | MJD | F | F(H) | F | F(H) |
|---|---|---|---|---|---|---|
| 1 | 2 | 3 | 4 | 5 | 6 | 7 |
| 1 | 14.01.1996 | 50096.63 | 26.171.10 | 14.410.62 | - | - |
| 2 | 20.01.1996 | 50103.47 | - | - | 26.710.88 | 64.822.92 |
| 3 | 19.03.1996 | 50162.31 | 23.360.98 | 14.820.64 | 22.680.75 | 62.772.82 |
| 4 | 20.03.1996 | 50163.35 | 26.071.10 | 14.530.62 | 25.150.83 | 61.222.75 |
| 5 | 05.10.1997 | 50726.63 | 24.491.03 | 12.300.53 | 23.940.79 | 54.772.46 |
| 6 | 07.10.1997 | 50728.64 | 24.071.01 | 11.310.49 | 24.200.80 | 54.552.45 |
| 7 | 20.01.1998 | 50834.34 | 23.620.99 | 11.060.48 | 18.600.61 | 44.872.02 |
| 8 | 28.01.1998 | 50842.44 | 22.690.95 | 12.450.54 | 19.500.64 | 45.492.05 |
| 9 | 22.02.1998 | 50867.31 | 20.850.88 | 10.510.45 | - | - |
| 10 | 07.05.1998 | 50940.53 | 20.920.88 | 10.090.43 | - | - |
3 Data analysis and results
In this section we present our results. First we shortly give an analysis of the photometric observations, and then of the spectral observations, which contain the continuum and broad line variations.
3.1 Photometric results
Our photometric results are presented in Figure 1, where we show the observations in B, V, and R filters. As one can see in Figure 1, the photometric observations show the same variability in all three considered filters. Since there is a lack of data between 2008 and 2012, we cannot be sure that the maximum in the light curve was in 2007, but it seems it was close to the maximum. The minimum was in 2014, and also in the following years (2014–2018), there were no large changes in the photometric data.
The color B-V and V-R diagrams (Fig. 1, two bottom panels) show that in the high activity phase (2002–2008), the slope of the spectra from blue to red band was much steeper (bluer) than in the minimum phase (2012–2018), when the continuum was almost flat. It is also evident from Figure 1 that for every increase in the brightness (flux) the colors decreased (i.e. became bluer), which is expected in case of AGN.
| Feature | N | (mean) | () | (max/min) | (var) |
|---|---|---|---|---|---|
| 1 | 2 | 3 | 4 | 5 | 6 |
| cont 6330 | 89 | 19.3 | 3.1 | 2.0 | 0.158 |
| cont 5100 | 122 | 19.0 | 4.1 | 2.7 | 0.167 |
| H - total | 89 | 33.5 | 11.1 | 9.7 | 0.331 |
| H - total | 122 | 7.0 | 3.1 | 13.9 | 0.442 |
3.2 Spectral results
First we inspect the spectra obtained during the whole long-term period, finding that the maximum in the optical spectra was in 2007, and minimum (as also in photometric observations) in 2014. As it is shown in Figure 4 we explore the optical spectra in these two extreme epochs, finding that in the maximum, the continuum is strong, and broad lines are very prominent, showing typical Sy 1 spectrum. In the maximum phase there are Balmer lines from H to H, and also very intense Fe II lines, especially, the Fe II feature between H and H lines (Fig. 4).
On the other hand, in the minimum phase (Fig. 4), the broad lines disappeared, and the spectrum of NGC 3516 is similar to Sy 2 spectrum, without strong continuum and broad lines. Additionally, it is interesting that in contrast to a typical Sy 2 spectrum, in the composite spectrum during the minimum, there is no narrow H line, which is probably absorbed. The absorption lines from the host galaxy are dominant, showing both forbidden and permitted narrow emission lines.
Since we find an extreme difference between the NGC 3516 spectrum in the phase of minimum and maximum activity, we explore how much the result can be affected by some artificial effects (as e.g. slit motion). Therefore, we repeated long-slit observations with 6 m telescope of SAO RAS in Febuary 01, 2017 (Fig. 2), and we find that after subtracting the host galaxy contribution there is a very weak H broad component, which cannot be seen in the composite spectra from our monitoring campaign.
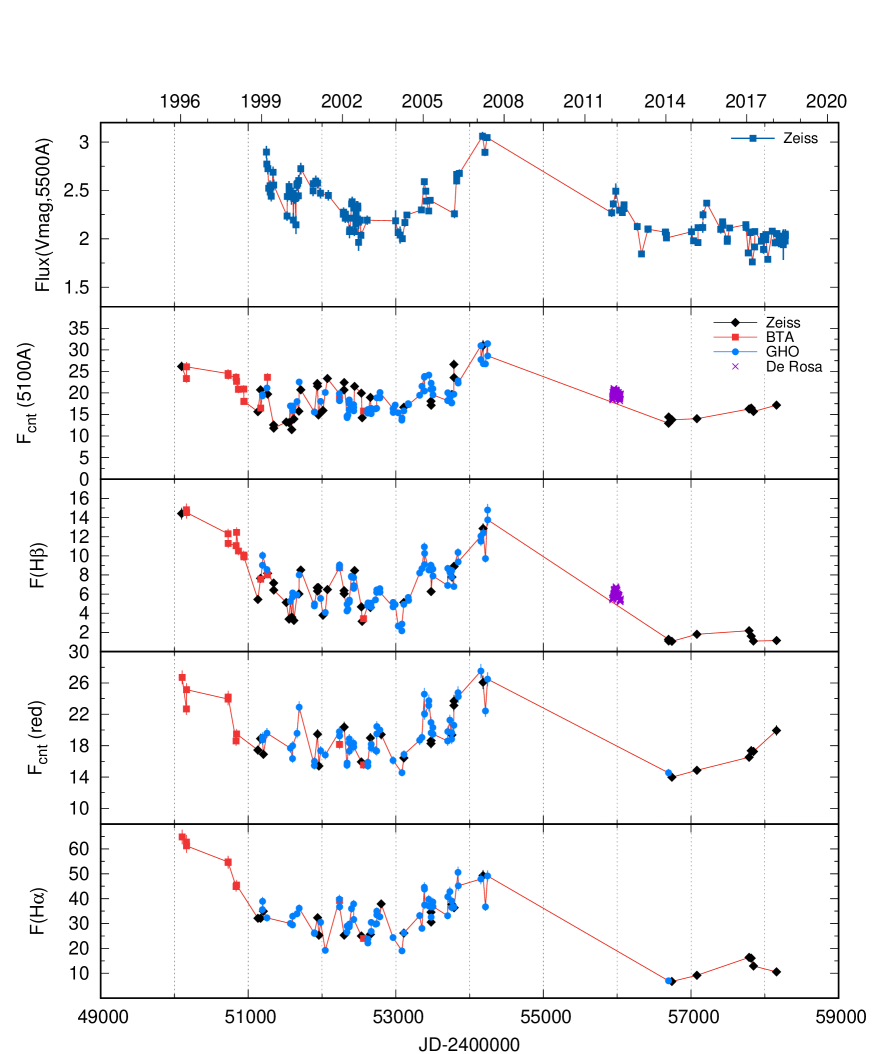
The light curves of broad line and corresponding continuum fluxes are shown in Figure 5, from which it can be seen that the active phase was more-or-less present in the whole monitored period, beside several last years. In Figure 5, we also plot the observed fluxes of H and continuum at 5100Å reported in De Rosa et al. (2018), which cover only a small part of the period uncovered by our monitoring campaign. As it can be seen in Figure 5, the observations of De Rosa et al. (2018) fit very well our photometric and spectral observations.
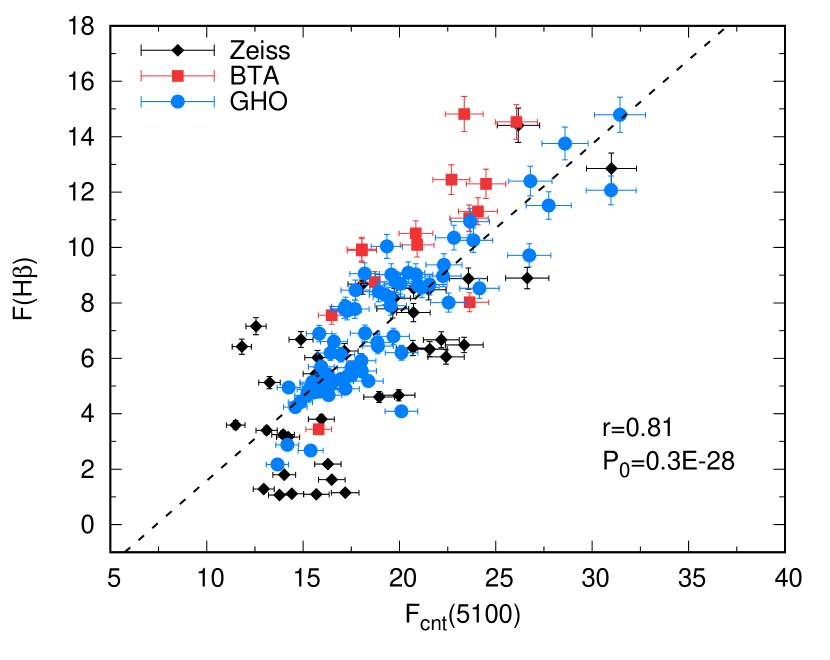
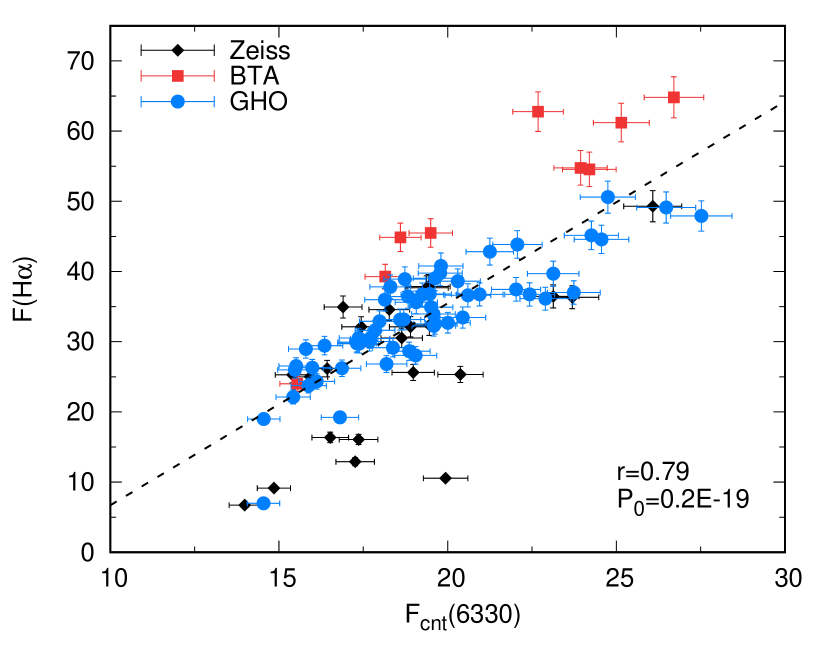
In general it is expected that the line flux variation is well correlated with the continuum flux variation, however in some well-known AGNs this is not the case, e.g. in NGC 4151 (see Shapovalova et al. 2008) or Arp 102B (see Shapovalova et al. 2013). In addition, as it was noted above, NGC 3516 contains a low-luminosity AGN, and it is interesting to explore the response of the line flux to the continuum flux variability. To test this, we plot in Figure 6 the flux of H (left panel) and H (right panel) as a function of the continuum flux at 5100 Å and 6330 Å, respectively. Figure 6 shows that there are good correlations between the line and corresponding continuum (r=0.81 for H, and r=0.79 for H), however there is a large scatter especially in the case of the weak broad line flux. This is expected since in the low activity phase the weakness of broad emission lines is due to the lack of an ionizing continuum from the nucleus (Kim et al., 2018).
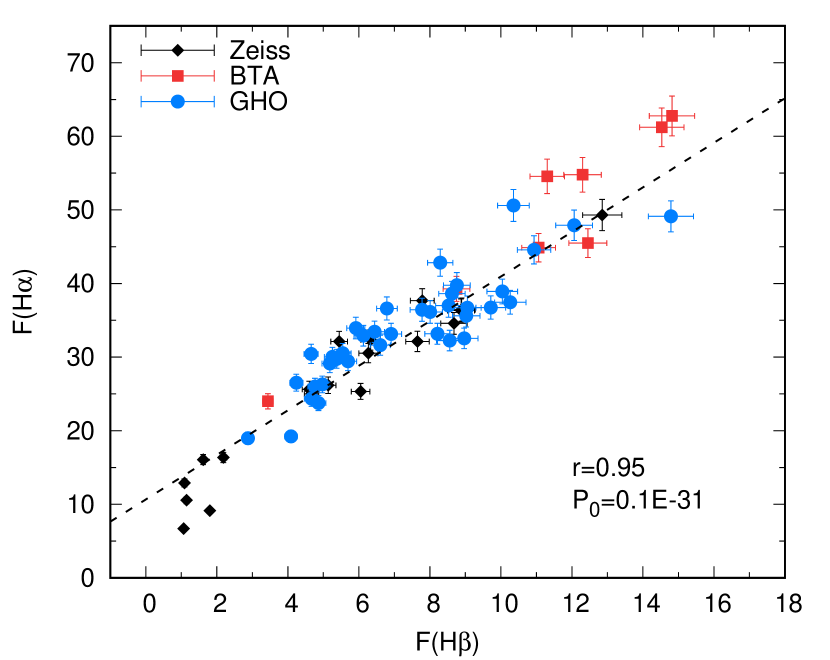
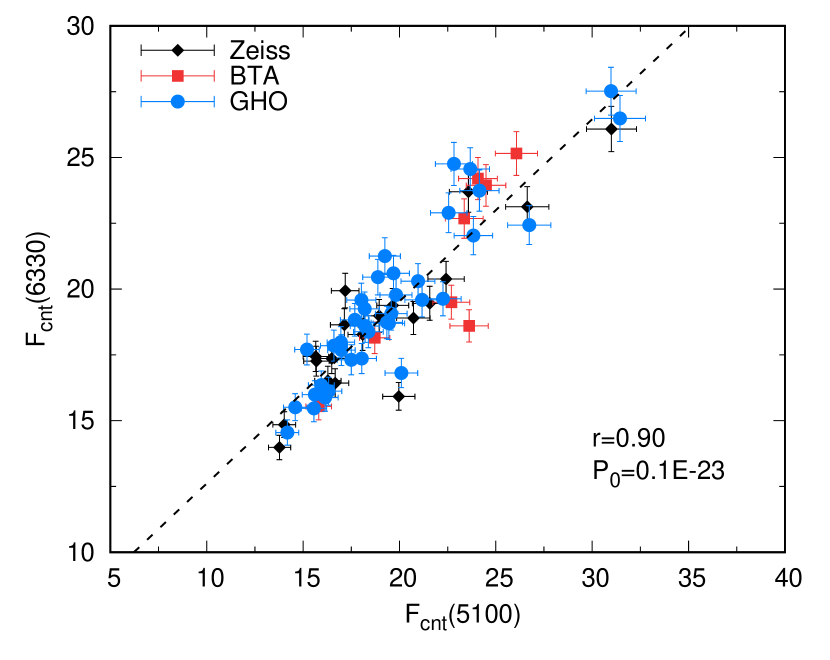
On the other hand, a better correlation is obtained between the broad H and H lines () and between the blue and red continuum (), which is shown in Figure 7. This is expected, and it confirms that the relative flux calibration of the blue and red spectra obtained from different telescopes was done correctly.
3.2.1 Variability of the emission lines and the optical continuum
As it can be seen in Figures 1 and 5, there is a large variability in the spectra during the monitored period. To explore the rate of variability we calculate the variation amplitude using the method given by O’Brien et al. (1998) and present it in Table 6. The changes in the continuum were around two times (2.7 times for 5100 Å and 2 times for 6330 Å), which is usual for Sy 1 galaxies (see e.g. Shapovalova et al., 2017). However, the line flux changed for somewhat more than 10 times (Tab. 6), which is expected in AGN which change their type, as e.g. in Fairall 9 in which broad line fluxes changed by more than an order of magnitude also changed its type from Sy 1 to Sy 1.9 (Kollatschny & Fricke, 1985).
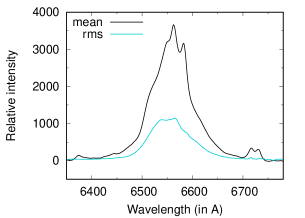
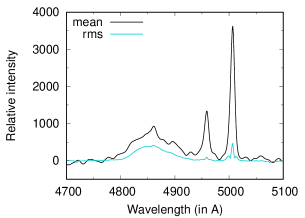
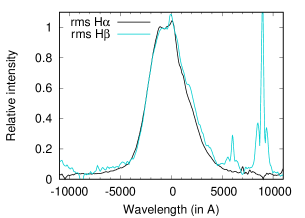
Additionally, there is a big change in the line profiles. We show the mean and rms-profiles of the broad H and H lines in Figure 8, from which it can be seen that the mean profile of H and H lines show structures in the blue and red wing, like shoulders which may indicate a complex BLR (see Popović et al., 2002). We construct the mean and rms-profiles for both lines using only spectra with resolution of 8 Å and find that the full width at half maximum (FWHM) of the mean H is 3560 km s-1 (the FWHM of H rms-profile is 4110 km s-1), whereas the mean H seems to be broader with the FWHM of 5120 km s-1 (the FWHM of H rms-profile is 436080 km s-1). For the FWHM of H rms-profile, which is later used for the black hole mass estimation, we estimated the uncertainty by making several measurements for different levels of the underlying continuum, taking the resulting average for the FHWM and the uncertainty to be 1. Both mean-profiles and their rms show a red asymmetry, that may be caused by the inflow or gravitation redshift (see Jonić et al., 2016), but also other effects can be present, as e.g. it could imply outflow if the inward facing side of the BLR clouds are brighter than the outward face, as it is suggested by photoionization modeling. Both rms-profiles have the same shape (see Figure 8, right panel), which indicates similar kinematics of both regions.
3.3 Time-lag and periodicity analysis
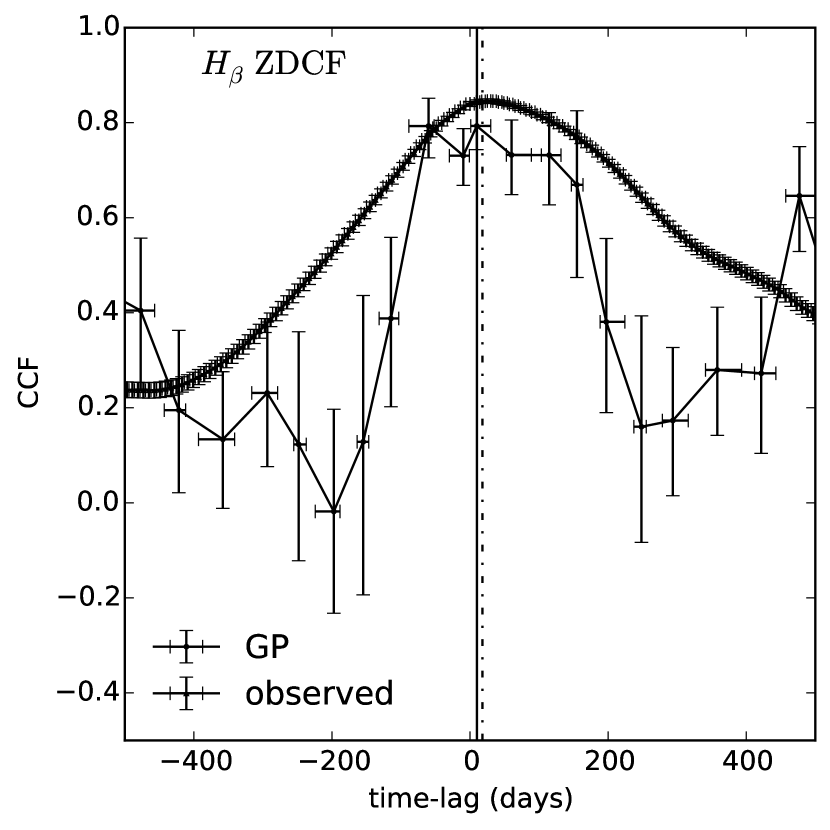
The time-lags between light curves in the H, H lines and corresponding continuum bands are determined from the z-transformed discrete correlation function (ZDCF) analysis (following the technique detailed in Alexander, 1997; Popović et al., 2014; Shapovalova et al., 2016, 2017). Note that the light curves are sampled at the same time, as noted in Edelson, & Krolik (1988)
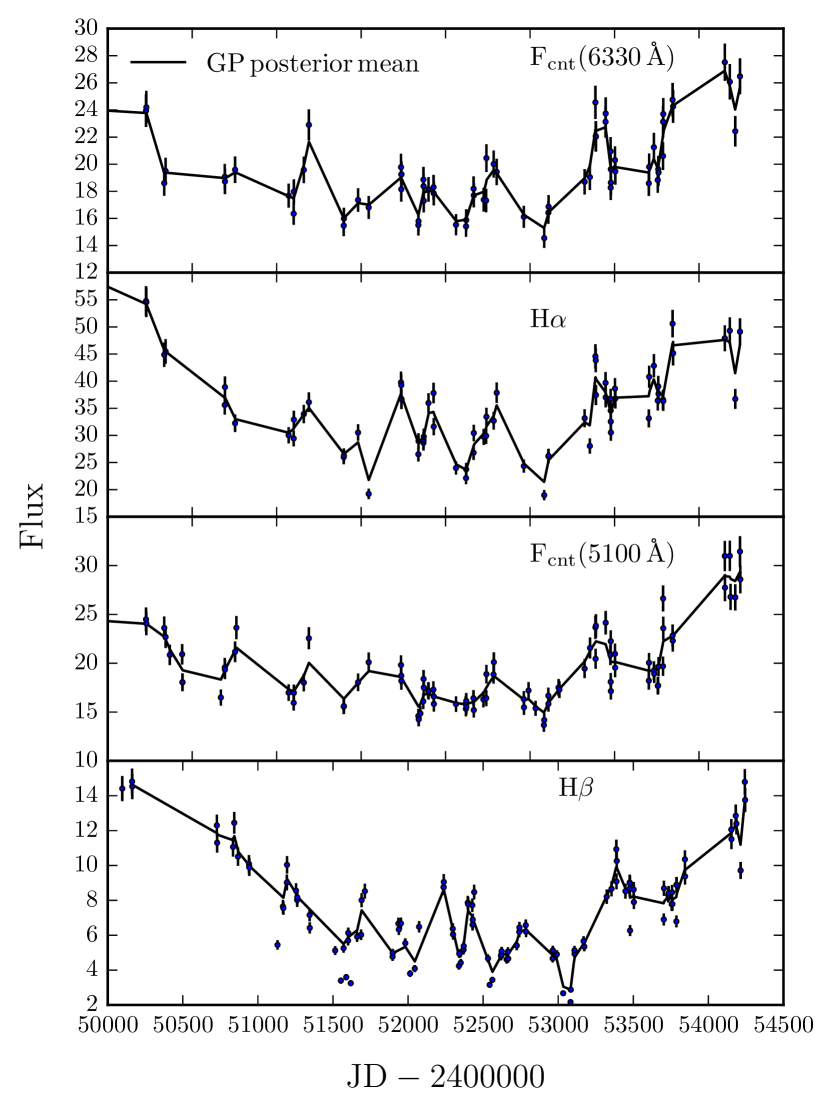
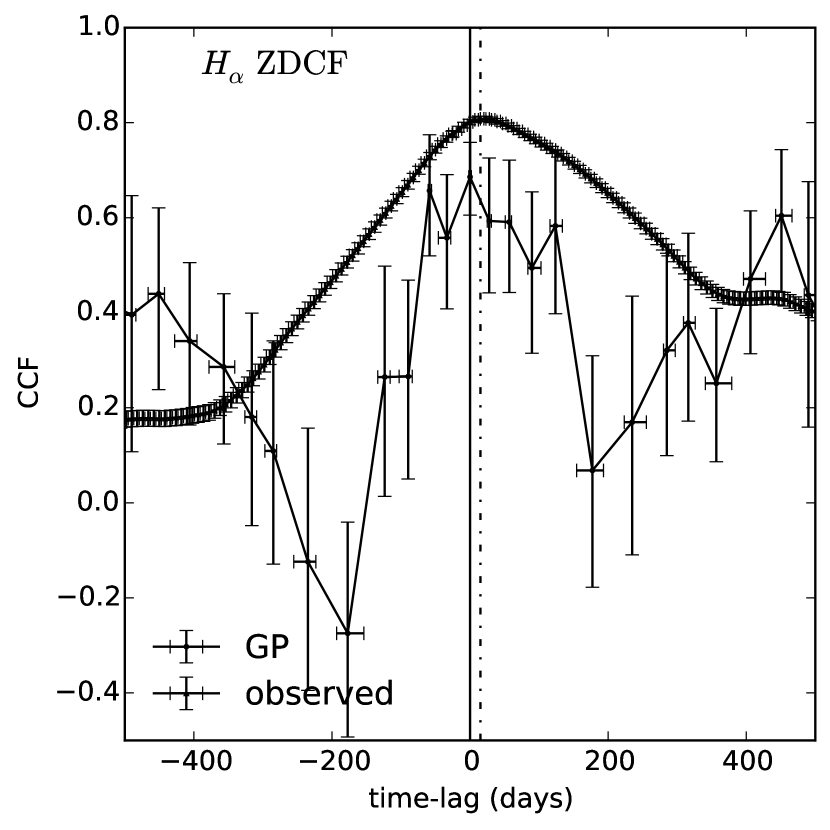
Our long-term observations are covering 22 years, however since there is a large gap after year 2007, in this analysis we used only the part of the light curve up to year 2007 (MJD 54500). In addition, we modeled Gaussian Process (GP) simulated light-curves, which are shown in Figure 9, in order to obtain the time lags in case of light curves with increased sampling rate. The ZDCF analysis applied to both observed and GP simulated light curves, and their ZDCFs are presented in Figure 10. Time-lags with the corresponding ZDCFs are given in Table 7. We find the time-lag of observed H and continuum days and cross correlation coefficient of . Their GP counterparts exhibit larger lag of days and similarly larger values of . In the case of H and its continuum the time-lag for observed light curves is days, which is slightly larger then in the case of observed H (Fig. 10). Their GP counterparts show the largest time-lag days and . Results based on the GP light curve analysis suggest that the time-lag of H could be larger than H with the upper limit of about 20 days.
In addition, the time lags were also calculated with the modified versions of the Interpolated Cross-Correlation Function (ICCF Gaskell & Sparke, 1986), as well as the Discrete Cross-Correlation Function (DCCF Edelson, & Krolik, 1988), as explained in Patiño-Álvarez et al. (2013). Both methods produced almost the same time lags for both H and H lines.
Finally, we generated two artificial light curves of the duration of 4920 days, starting from the power spectral density function, with the 30-days cadence and 15 days time lag between them, added the red noise, and applied the ZDCF method. The ZDCF was able to detect the 15 days time lag with small uncertainty in both cases, with and without red noise. If we randomly extract 70 points from the artificial light curves with red noise, and apply the ZDCF, the obtained time lag is again the same, i.e. (). Therefore we concluded that the sampling rate is influencing more the uncertainty than the estimated time lags. We show that all methods and tests give similar results for the time lags, and later in the text we will use the time lag obtained from the ZDCF method applied on the GP modeled light-curves for the calculation of the mass of the SMBH.
We note that in the case of long term light-curves, the “red noise problem” could affect the estimated time lags, in such a way that in addition to the variations on the reverberation timescale, there are longer term variations that bias the estimated lag to larger values, as it was noted by Peterson et al. (2002) for NGC 5548, which is a binary black hole candidate (Bon et al., 2016; Li et al., 2016). In some cases, the problem of time lag estimates from the "red noise" light curves has been mitigated with the Gaussian process regression (MacLeod et al., 2010; Pancoast et al., 2011; Tewes et al., 2013), which we also applied here. However, we cannot neglect a possibility that true time lag may be somewhat smaller then our analysis indicates.
| Light curves | N | [days] | |
|---|---|---|---|
| 1 | 2 | 3 | 4 |
| GP cnt vs H | 3728 | 15.0 | 0.81 |
| GP cnt vs H | 3728 | 17.0 | 0.85 |
| OBS cnt vs H | 50 | 0.0 | 0.69 |
| OBS cnt vs H | 63 | 9.7 | 0.79 |
3.3.1 Periodicity
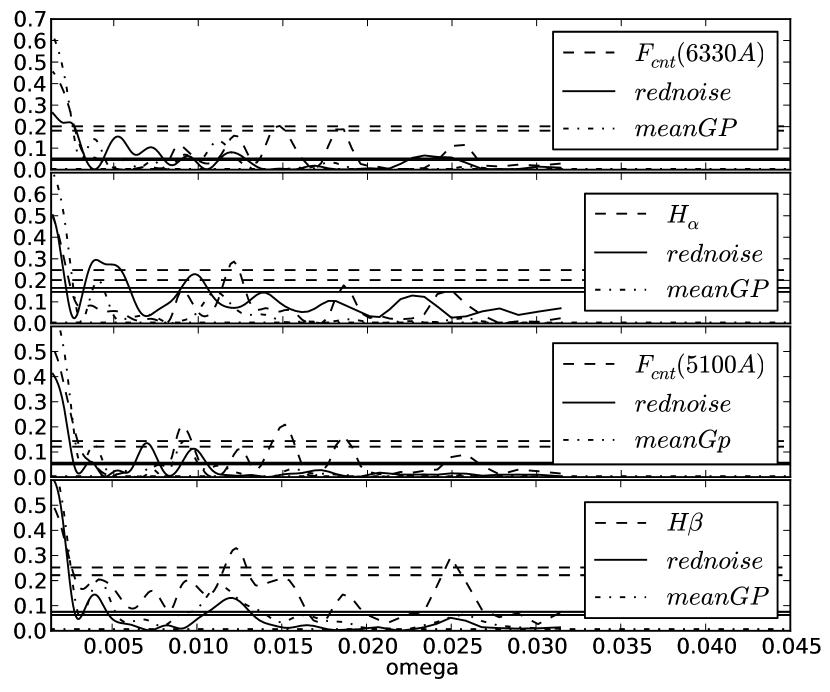
In order to test for any meaningful signal in the light curves, we calculate for observed and GP light curves Lomb-Scargle periodogram with a bootstrap analysis to assess its significance as it is described in Shapovalova et al. (2016, 2017). We test whether a purely red noise model can produce a periodic variability of light curves. We obtain random light curves from the Ornstein–Uhlenbeck (OU) process (red noise) sampled to a regular time interval.
The periodogram analysis (Fig. 11) shows that there are no significant periodic signals. The largest peak of each curve corresponds to the whole observed period However, in the H line one can see a peak at about 523 days, the continuum at 5100 Å has a peak at 698 days, whereas the H line has a peak at 515 days. On the other hand, GP light curves calculated from the observed light curves do not exhibit any significant periodic signal.
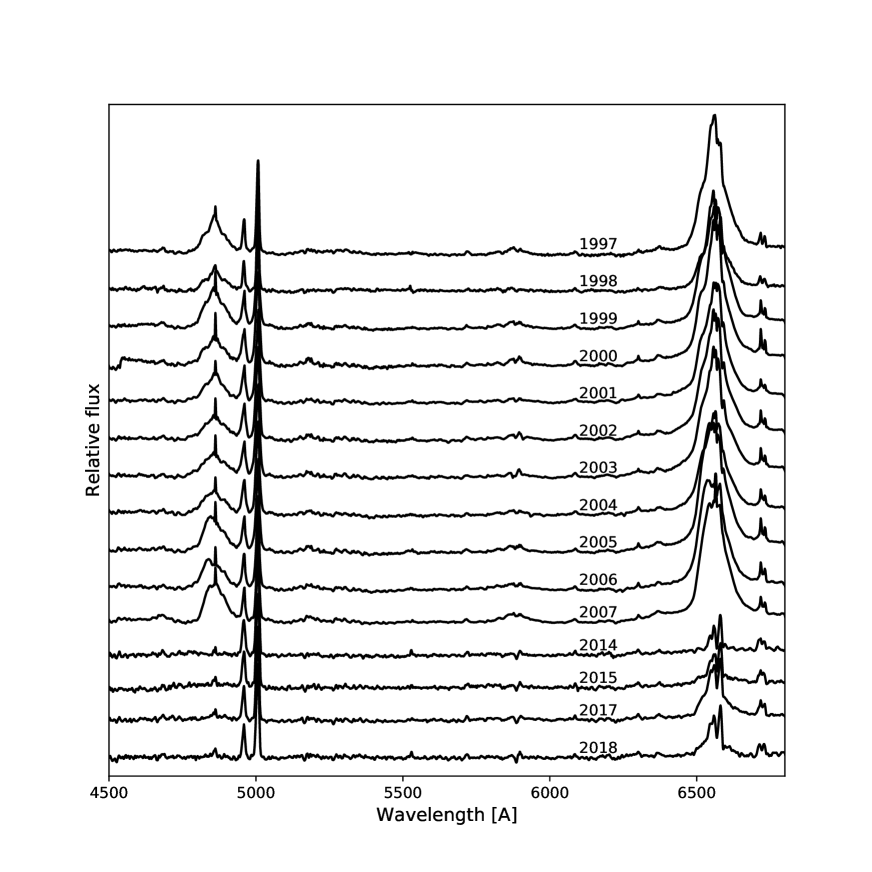
4 Discussion
In this paper we investigate the long-term photometric and spectroscopic variability of NGC 3516 observed with three telescopes in a monitoring campaign that lasted for 22 years (from 1996 to 2018). We find that the intensity in the broad lines as well as in the continuum flux was changing at a rate between two times in the continuum flux, and more than ten times in the broad-line flux. NGC 3516 changed the type of activity during the monitoring campaign, having the typical Sy 1 spectrum in the first period of the campaign, and changing from 2014 to the spectrum which is without broad lines, similar to the spectrum of Sy 2 galaxies, which is clearly visible in Figure 12 where we plot the year-average spectra corrected for the host-galaxy and continuum. We note that, as can be seen in Figure 4, the H narrow line also disappeared in the composite spectrum in 2014. It seems that the stellar absorption of H in the low-state phase is too strong that the narrow emission was absorbed, which is clear from the host-galaxy corrected spectrum in which the narrow H is slightly appearing in 2014 (Fig.12). Such a low-state was also observed in the X-ray (Noda et al., 2016), since observations in 2013–2014 showed that the X-ray emission in this period was at level of just 5% of the average flux observed in 1997–2002 period (Noda et al., 2016).
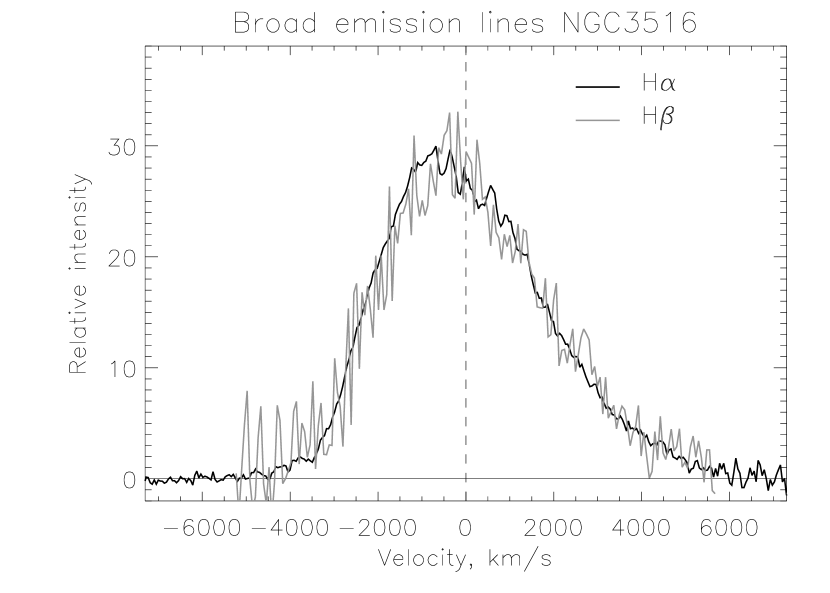
As we noted above, we performed observations in 2017 to get the high resolution spectrum of the AGN in the minimum phase (see §2). Figure 2 shows that after subtracting the host galaxy spectrum, there are very weak broad emission lines (H, but also H). We compare the broad line profiles of H and H (Fig. 13) and find that they have practically the same line profiles. The H and H have also the same FWHM which is around 2000 km s-1 (Fig. 13). The FWHM from this period is around two times smaller than the FWHM of the averaged line profile, and both broad components are significantly shifted to the blue (around 1000 km s-1), which can indicate both the outflow in the minimum phase, and also the disc emission (Popović et al., 2002). The shifted broad H and H with an extensive red wing can be created in an outflowing disc-like BLR (as it was discussed and presented in Figure 19 of Popović et al., 2011). The investigation of the broad line profiles and consequently the model of the BLR structure of NGC 3516 will be given in Paper II.
Additionally, we measure the narrow line ratios in the minimum phase and we obtain [O III]5007/H=10.3, [N II]6583/H=3.8, which indicates the strong shock wave excitation in the narrow line region, that can be in the process of gas outflowing on the edge of the ionization conus (Afanasiev et al., 2007).
Variability in the line profiles of broad Balmer lines is high, as we noted above, the broad component almost disappeared in the last period of the monitoring campaign (in 2014), and after the total minimum, the low-flux broad lines started to appear, as e.g. in 2017. The line variability in the UV spectral range was reported by Goad et al. (1999). They found that high-ionization emission lines (Ly 1215, C IV 1549, N V 1240, and He II 1640) showed significant variation that was of the order of a factor of 2, similar as we find in the H and H lines.
One of the most interesting facts is that NGC 3516 is the changing-look AGN (Fig. 12), and the nature of these objects can be different (see Matt et al., 2003; Bianchi et al., 2005; Kim et al., 2018; Node & Done, 2018, etc.). If an AGN is a changing-look from type 1 to type 1.9 or 2, this can be explained via a variable absorption of matter between an observer and the accretion disc. In that case the obscuring material (e.g. dust clouds) should have a patchy distribution, then the dynamical movement of dust clouds can result in a change of the continuum (and broad line) emission, which affects the current classification.
On the other side, any lack of accretion (that may be caused by different effects) could result in the lack of the ionization continuum, and consequently in the lack of broad emission lines (see Kim et al., 2018; Node & Done, 2018). As e.g. Mrk 1018 changed from type 1.9 to 1 and returned back to 1.9 over a period of 40 years (Kim et al., 2018). From our observations we could not see that there was a change in the past, since 1996, when we started our monitoring campaign. However, from the comparison of the H profile observed in 1943 by Seyfert (1968) and in 1967 by (Andrillat, 1968), it can be clearly seen that the broad H component was present in the observation from 1943, and was absent in the epoch of 1967 (see Fig. 3 in Andrillat, 1968). Therefore we can not exclude that there is some repetition of the changing look of NGC 3516 (with some periodicity) that should be investigated in the future. Additionally, there is something in common with Mrk 1018, since both AGN in the phase of type 1 showed complex broad Balmer lines which indicate more than one emission line region (Popović et al., 2002; Kim et al., 2018). Finally, we note that NGC 3516 showed a strong absorption in the UV lines (Goad et al., 1999), as well as in the X-ray continuum (see Kraemer et al., 2002; Turner et al., 2011; Holczer & Behar, 2012, etc.).
4.1 Black hole mass determination
The SMBH mass () of NGC 3516 can be estimated using the virial theorem (see Peterson, 2014):
| (3) |
where is the line-of-sight orbital velocity at the radius of the BLR, which is estimated from the width of the variable part of the H emission line, and is a factor that depends on the geometry and orientation of the BLR. Different values are obtained for the scale factor , depending whether it was determined statistically (see e.g. Onken et al., 2004; Woo et al., 2015) or by detailed modeling of the reverberation data (see e.g. Pancoast et al., 2014; Grier et al., 2017).
Here we will use the recent result for the factor from Woo et al. (2015) who obtained for the H FWHM-based estimates. Taking into account that the dimension of the H BLR is 17 light days and that the FWHM of the H rms-profile is 4360 km s-1, we obtained that the central SMBH has a mass of (4.731.40) (). The uncertainty in the time lag and FWHM are propagated through to calculate the formal mass uncertainty.
Although we used the FWHM of the H line in our analysis, we obtain the result which is in agreement with the estimates of other authors who calculated the mass based on the line-dispersion, i.e. Peterson et al. (2004) found that the mass is (4.271.46) (), Denney et al. (2010) reported the mass of (3.17)(), and the most recent finding of De Rosa et al. (2018) is the mass of (4.271.35) ().
5 Conclusions
Here we present the long-term (from 1996 to 2018) photometric and spectroscopic monitoring campaign for NGC 3516. We analyze observations in order to explore the long-term variability in spectral characteristics of the object. NGC 3516 is known as variable object from X-ray (Noda et al., 2016) to the optical (Denney et al., 2010; De Rosa et al., 2018) spectra. From our analysis of the long-term monitoring we can outline following conclusions:
-
1.
During more than 20 years of monitoring, the range of continuum flux (blue at 5100 Å and red at 6330 Å) variations exceeded a factor of two, whereas the range of broad lines variations were of the order of magnitude. This causes a huge change in the optical spectrum of NGC 3516, that mostly, during the monitored period has typical Sy 1 spectrum, but from 2014, in the minimum of activity, the broad lines almost disappeared, and NGC 3516 has the spectrum which is typical for Sy 2 galaxies, beside the narrow H line, which also disappeared in the composite spectrum after 2014 (Fig.12). This indicates a strong absorption in this period. The spectrum did not change a lot in the following four years, until the end of the monitoring in 2018, when only a weak broad H and H components are present. These components have the same shape (blue-shifted peaks around 1000 km s-1 and larger red wing) with smaller FWHM (around 2000 km s-1) than averaged broad line profiles (FWHM 4000-5000 km s-1). This indicates that the structure of the BLR was significantly changed.
-
2.
During the main monitoring period (1996–-2007), there is a good correlation between fluxes in the broad lines and the corresponding continuum (). This indicates that the main mechanism for the formation of broad emission lines in the BLR is the photoionization by the continuum from the nucleus. However, in the low activity phase broad-line fluxes are caused mainly by shock excitation as a result of an outflow, and not by photoionization from a pure AGN (see Fig. 5 and discussion).
- 3.
-
4.
The mean and rms line profile indicate a complex BLR, probably with two components (see Popović et al., 2002), however we did not investigate the broad line profile in more details, and we leave the investigation of the broad line structure to Paper II.
Acknowledgements
The authors thank the anonymous referee for useful comments and suggestions. This work was supported by: INTAS (grant N96-0328), RFBR (grants N97-02-17625 N00-02-16272, N03-02-17123, 06-02-16843, N09-02-01136, 12-02-00857a, 12-02-01237a,N15-02-02101), CONACYT research grants 39560, 54480, 151494, and 280789 (México), and the Ministry of Education and Science of Republic of Serbia through the project Astrophysical Spectroscopy of Extragalactic Objects (176001). We especially thank Borisov N.V., Fathulin T., Fioktistova I., Moiseev A., Mikhailov V. ,and Vlasyuk V.V. for taking part in the observations.
References
- Adams & Weedman (1975) Adams, T. E., and Weedman, D. W. 1975. ApJ 199, 19
- Afanasiev et al. (2007) Afanasiev, V. L., Dodonov, S. N., Khrapov, S. S., Mustsevoi, V. V., & Moiseev, A. V. 2007, Astrophysical Bulletin, 62, 1
- Afanasiev et al. (2018) Afanasiev, V. L., Popović, L. Č., & Shapovalova, A. I. 2019, MNRAS, 482, 4985
- Alexander (1997) Alexander, T. 1997, ASSL, 218, 163
- Andrillat (1968) Andrillat, Y. 1968, AJ, 73, 862
- Andrillat & Souffrin (1968) Andrillat Y. & Souffrin S., 1968, ApJL, 1, 111
- Andrillat (1971) Andrillat, Y. 1971, ApJL, 8, 161
- Begelman (1985) Begelman, M. C. 1985, in Astrophysics of Active Galaxies and Quasi-Stellar Objects, ed. J.S.Miller (Mill Valley,CA:University Sciences), 411
- Bianchi et al. (2005) Bianchi, S., Guainazzi, M., Matt, G., Chiaberge, M., Iwasawa, K., Fiore, F., Maiolino, R. 2005, A&A, 442, 185
- Blandford & McKee (1982) Blandford, R. D., and McKee, C. F. 1982, ApJ, 225, 419
- Bochkarev et al. (1990) Bochkarev N.G., Shapovalova A.I., Zhekov S.A. 1990, AJ, 100, 1799
- Bochkarev & Antokhin (1982) Bochkarev, N. G., and Antokhin, L.L. 1982, Sov. Astron. Cirk. No. 1228, 5
- Boksenberg & Netzer (1977) Boksenberg, A., and Netzer, H. 1977, ApJ, 212, 37
- Boksenberg et al. (1978) Boksenberg, A., Snijders, M. A. J., Wilson, R., et al. 1978, Nature, 275, 404
- Bon et al. (2016) Bon, E., Zucker, S., Netzer, H., et al. 2016, ApJS, 225, 29
- Cherepashchuk & Lyutyi (1973) Cherepashchuk, A. M., and Lyutyi, V. M. 1973. ApL, 13, 165
- Collin-Souffrin et al. (1973) Collin-Souffrin, S., Allein, D., and Andrillat, Y. 1973, A&A, 22, 343
- Collin-Souffrin (1980) Collin-Souffrin, S. 1980, In Variability of Stars and Galaxies-Proceedings of the Fifth European Regional Meeting in Astronomy, Institute d’Astrophysics, Liege, Belgium, Cl. 11
- Connolly et al. (1995) Connolly, A. J., Szalay, A. S., Bershady, M. A., Kinney, A. L., & Calzetti, D. 1995, AJ, 110, 1071
- Cousins (1976) Cousins A. W. J. 1976, MNRAS, 81, 25
- Crenshaw (1986) Crenshaw, D. M. 1986, ApJS, 62, 821
- Crenshaw & Peterson (1985) Crenshaw, D. M., and Peterson, B. M. 1985, ApJ, 291, 677
- Denney et al. (2010) Denney, K. D., Peterson, B. M., Pogge, R. W. et al. 2010, ApJ, 721, 715
- De Rosa et al. (2018) De Rosa, G., Fausnaugh, M. M., Grier, C. J., et al. 2018, ApJ, 866, 133
- Devereux (2016) Devereux, N., 2016, ApJ, 822, 69
- Dietrich et al. (1998) Dietrich, M., Peterson, B. M., Albrecht, P., et al. 1998, ApJS, 115, 185
- Dimitrijević et al. (2007) Dimitrijević, M. S., Popović, L. Č., Kovačević, J., Dačić, M., Ilić, D. 2007, MNRAS, 374, 1181
- Doroshenko et al. (2005) Doroshenko V. T., Sergeev S. G., Merkulova N. I., Sergeeva E. A., GolubinskyYu. V., Pronik V. I., Okhmat N. N., 2005, Astrophysics, 48, 304
- Holczer & Behar (2012) Holczer, T., Behar, E. 2012, ApJ, 747, 71
- Edelson, & Krolik (1988) Edelson, R. A., Krolik, J. H. 1988, ApJ, 333, 646
- Francis et al. (1992) Francis, P. J., Hewett, P. C., Foltz, C. B., Chaffee, F. H. 1992, ApJ, 389, 476
- Gaskell & Sparke (1986) Gaskell, C. M., & Sparke, L. S. 1986, ApJ, 305, 175
- Goad et al. (1999) Goad, M. R., Koratkar, A. P., Kim-Quijano, J., Korista, K. T., O’Brien, P. T., Axon, D. J. 1999, ApJ, 524, 707
- Grier et al. (2017) Grier, C. J., Pancoast, A., Barth, A. J., et al. 2017, ApJ, 849, 146
- Jonić et al. (2016) Jonić, S., Kovačević-Dojčinović, J., Ilić, D., Popović, L. Č. 2016, Ap&SS, 361, 101
- Kim et al. (2018) Kim, D.-C., Yoon, I., Evans, A. S. 2018, ApJ, 861, 51
- Kraemer et al. (2002) Kraemer, S. B., Crenshaw, D. M., George, I. M., Netzer, H., Turner, T. J., Gabel, J. R. 2002, ApJ, 577, 98
- Kollatschny & Fricke (1985) Kollatschny, W., & Fricke, K. J. 1985, A&A, 146, L11
- Li et al. (2016) Li, Y.-R., Wang, J.-M., Ho, L. C., et al. 2016, ApJ, 822, 4
- Matt et al. (2003) Matt, G., Guainazzi, M., Maiolino, R. 2003, MNRAS, 342, 422
- MacLeod et al. (2010) MacLeod, C. L., Ivezić, Ž., Kochanek, C. S., et al. 2010, ApJ, 721, 1014
- Node & Done (2018) Noda, H., Done, C. 2018, MNRAS.tmp, 1938
- Noda et al. (2016) Noda, H., Minezaki, T., Watanabe, M. et al. 2016, ApJ, 828, 78
- O’Brien et al. (1998) O’Brien, P.T., Dietrich, M., Leighly, K. et al. 1998, ApJ, 509, 163
- Onken et al. (2004) Onken, C. A., Ferrarese, L., Merritt, D., Peterson, B. M., Pogge, R. W., Vestergaard, M., Wandel, A. 2004, ApJ, 615, 645
- Onken et al. (2003) Onken, C. A., Peterson, B. M., Dietrich, M., Robinson, A., Salamanca, I. M. 2003, ApJ, 585, 121
- Osterbrock (1977) Osterbrock, D. E. 1977, ApJ, 215, 733
- Osterbrock & Ferland (2006) Osterbrock, D. E., & Ferland, G. J. 2006, Astrophysics of gaseous nebulae and active galactic nuclei, 2nd. ed. by D.E. Osterbrock and G.J. Ferland. Sausalito, CA: University Science Books, 2006
- Pancoast et al. (2011) Pancoast, A., Brewer, B. J., & Treu, T. 2011, ApJ, 730, 139
- Pancoast et al. (2014) Pancoast, A., Brewer, B. J., Treu, T., et al. 2014, MNRAS, 445, 3073
- Patiño-Álvarez et al. (2013) Patiño-Álvarez, V., Carramiñana, A., Carrasco, L., & Chavushyan, V. 2013, Fermi Symposium eConf Proceedings, C121028, arXiv:1303.1898
- Penston et al. (1971) Penston M. J., Penston M. V., Sandage A., 1971, PASP, 83, 783
- Peterson (1993) Peterson, B. M. 1993, PASP, 105, 247
- Peterson (2014) Peterson, B. M. 2014, SSRv, 183, 253
- Peterson & Collins (1983) Peterson, B. M., Collins I. I. G.W. 1983, ApJ, 270, 71
- Peterson et al. (1994) Peterson, B. M., Berlind, P., Bertram, R., et al. 1994, ApJ, 425, 622
- Peterson et al. (1995) Peterson, B. M., Pogge, R. W., Wanders, I., Smith, S. M., & Romanishin, W. 1995, PASP, 107, 579
- Peterson et al. (1998) Peterson, B. M., Wanders, I., Bertram, R., et al. 1998, ApJ, 501, 82
- Peterson et al. (2002) Peterson, B. M., Berlind, P., Bertram, R., et al. 2002, ApJ, 581, 197
- Peterson et al. (2004) Peterson, B. M., Ferrarese, L., Gilbert, K. M., et al. 2004, ApJ, 613, 682
- Popović et al. (2002) Popović, L. Č,, Mediavilla, E. G.., Kubičela, A., Jovanović, P. 2002, A&A, 390, 473.
- Popović et al. (2014) Popović, L. Č., Shapovalova, A. I., Ilić, D., Burenkov, A. N., Chavushyan, V. H., Kollatschny, W., 2014, A&A, 572, A66
- Popović et al. (2011) Popović, L. Č., Shapovalova, A. I., Ilić, D., Kovačević, A., Kollatschny, W., Burenkov, A. N., Chavushyan, V. H., Bochkarev, N. G., León-Tavares, J. 2011, A&A, 528A, 130
- Rees (1984) Rees, M.J. 1984 1984, ARA&A, 22, 471
- Shapovalova et al. (2001) Shapovalova, A. I., Burenkov, A. N., Carrasco, L., et al. 2001, A&A, 376, 775
- Shapovalova et al. (2004) Shapovalova, A.I., Doroshenko, V.T., Bochkarev, N.G, et al. 2004, A&A, 422, 925
- Shapovalova et al. (2008) Shapovalova, A.I., Popović, L. Č., Collin, S., et al. 2008, A&A, 486, 99
- Shapovalova et al. (2010) Shapovalova, A. I., Popović, L. Č., Bochkarev, N.G., et al. 2010, A&A, 517A, 42
- Shapovalova et al. (2012) Shapovalova, A.I., Popović, L. Č., Burenkov, A. N., et al. 2012, ApJS, 202, 10
- Shapovalova et al. (2013) Shapovalova, A. I., Popović, L. Č., Bochkarev, N.G., et al., 2013, A&A, 559A, 10S
- Shapovalova et al. (2016) Shapovalova, A.I., Popović, L. Č., Chavushyan, V., et al. 2016, ApJS, 222, 25
- Shapovalova et al. (2017) Shapovalova, A.I., Popović L. Č., Chavushyan V, Afanasiev, V.L., Ilić D., Kovačević A., et al. 2017, MNRAS 466, 4759
- Seyfert (1968) Seyfert, C. K. 1943, ApJ, 97, 28
- Souffrin (1968) Souffrin, S. 1968, AJ, 73, 897
- Sturm et al. (2018) Sturm, E., Dexter, J., Pfuhl, O., et al. 2018, Nature, 563, 657
- Tewes et al. (2013) Tewes, M., Courbin, F., & Meylan, G. 2013, A&A, 553, A120
- Turner et al. (2011) Turner, T. J., Miller, L., Kraemer, S. B., Reeves, J. N. 2011, ApJ, 733, 48
- Vanden Berk et al. (2006) Vanden Berk, D. E., Shen, J., Yip, C.-W. et al. 2006, AJ, 131, 84
- Vlasyuk (1993) Vlasyuk V. V., 1993, Bull. Spec. Astrophys. Obs., 36, 107
- Wanders & Horne (1994) Wanders, I., Horne, K. 1994, A&A, 289, 76
- Wanders et al. (1993) Wanders I. van Groningen, E., Alloin, D., et al., 1993, A&A, 269, 39
- Woo et al. (2015) Woo, J.-H., Yoon, Y., Park, S., Park, D., & Kim, S. C. 2015, ApJ, 801, 38
- Yip et al. (2004a) Yip, C. W., Connolly, A. J., Szalay, A. S. et al. 2004a, AJ, 128, 585
- Yip et al. (2004b) Yip, C. W., Connolly, A. J., Vanden Berk, D. E. et al. 2004b, AJ, 128, 2603