Stellar Parameters for Pulsating B Star Candidates in the Kepler Field
Abstract
The field of asteroseismology has enjoyed a large swath of data coming from recent missions (e.g., CoRoT, Kepler, K2). This wealth of new data has allowed the field to expand beyond the previous limitation of a few extremely bright and evolved stars. Asteroseismology relies on accurate surface measurements for boundary conditions, but the predicted physical parameters in the Kepler Input Catalog (KIC) are unreliable for hot stars. We present stellar parameters of 25 candidate pulsating B star candidates in the Kepler field. We use blue optical spectra to measure the projected rotational velocity (), effective temperature (), and surface gravity () using TLUSTY and Kurucz ATLAS9 model atmospheres. We find a large discrepancy between our spectroscopically derived parameters and those derived from photometry in the KIC and Gaia Data Release 2 (DR2). Using spectral energy distributions, we also measure the radii of these stars and later calculate the luminosities and masses. We find the extinctions () of these stars to be consistent with zero, which is expected for stars of high Galactic latitude.
1 Introduction
Although helioseismology has long proven to be an invaluable tool for calibrating models of the solar interior, general asteroseismological analysis was previously limited to a few extremely bright or evolved stars (Chaplin, 2013). With the wide-field, high-precision, Kepler and K2 missions, astronomers are now able to perform asteroseismology on tens of thousands of stars (Chaplin et al., 2011; Yu et al., 2018) across a broad range of temperatures and evolutionary status. Even in its final months, K2 has continued to provide insight into the pulsations of its target stars.
Despite the high Galactic latitude of the original Kepler field, 85 pulsating B-type candidates have been identified in that field (Balona et al., 2011; McNamara et al., 2012). They exhibit a range of nonradial pulsations (NRPs) with periods consistent with Cephei variables, slowly pulsating B stars (SPB), and hybrids between those two classes. The precision light curves available with Kepler are proving to reveal many high frequency and low-amplitude modes, and with excellent frequency resolution, that are not detectable from the ground.
Asteroseismology of B stars with NRPs is currently being used to improve stellar structure and evolutionary models for hot stars (e.g., Saesen et al. 2010). Their various pulsation frequencies probe different layers of their interiors. Doing so, however requires accurate boundary conditions at the stellar surface (e.g., Huber et al. 2012). Spectroscopy allows accurate measurements of effective temperature, , and surface gravity, , that are essential in constraining stellar radii, ages, and evolutionary spin-down rates. Knowledge of the projected rotational velocity, , is key for studying the angular momentum of NRPs.
One hurdle for the asteroseismic analysis of B-type pulsators in the Kepler field is the lack of accurate physical parameters for these stars. The KIC uses the SDSS color as a temperature indicator, but the Rayleigh-Jeans slope of the hot star spectral energy distributions means that the color is largely insensitive to temperature for B-type stars. The KIC photometric measurements are likewise poor since the index does not sample the Balmer jump, which is strongly dependent on atmospheric pressure and thus . Balona et al. (2011) used spectroscopic line profile fitting to measure of 30 B stars in the Kepler field and found substantial differences from the predicted of the same stars in the KIC (Brown et al. 2011). Pinsonneault et al. (2012) published revised temperature scales for the KIC, but only for stars with K, which is substantially cooler than the stars considered in this work.
We present here the results of the measurements of , , and of 25 candidate Cephei, SPB, and hybrid pulsating B stars in the Kepler field with . Section 2 details our observations and data reduction of the spectra. In Section 3, we describe our measurements of , , and of these stars using the Tlusty BSTAR2006 grid and Kurucz ATLAS9 model atmospheres. Comparing and to the evolutionary tracks of Ekström et al. (2012), we also measure the mass, radius, and age. Section 4 compares our results with the KIC and the Gaia Data Release 2 as well as other published works. Calculated distances from Bailer-Jones et al. (2018) using the Gaia parallaxes are also included in order to estimate extinctions () for these stars.
2 Observations
We observed each target using the KPNO 4m Mayall telescope with the RC spectrograph from 2014 May 9-13. We used the grating BL 380 in order, a order sorting filter, a 1.5 arcsec slit, and the T2KA CCD to achieve resolving power . With a central wavelength of 4340 Å, this setup allowed us to observe the range 4,060–4,620 Å, covering several useful helium and hydrogen lines. We reduced the raw spectra with the doslit package of IRAF. All spectra were wavelength calibrated using an FeAr arc lamp.
3 Spectral Modeling
Two grids of synthetic spectra were used in our modeling process to measure , , and . First, we used a grid of line blanketed, plane-parallel, local thermodynamic equilibrium (LTE) models generated using the ATLAS9 code (Kurucz, 1994) for stars with K. The non-LTE (NLTE) Tlusty BSTAR2006 (Lanz & Hubeny, 2007) model spectra were used for stars with K. We adopted grids of (Z/Z⊙ = 1) and a microturbulent velocity of Vt = 2 km s-1.
Before fitting, we estimated and of the stars based on the strength and shapes of the Balmer and helium lines. We measured the projected rotational velocity () by using custom IDL codes to compare the observed profiles of He II 4026, He I 4387, 4471, and Mg II 4481 to limb darkened, rotationally broadened, and instrumentally broadened model profiles using steps of 10 km s-1. For each step, we compared (O-C)2,the sum of the squares of the residuals, and determined the minimal value of a parabolic fit as the value for . The error in was determined by allowing a 5% tolerance in (O-C)2. Table 1 lists the measurements of for all of the helium lines as well as their weighted averages.
We then modeled H lines for and using broadened models according to our measured along each point in our generated ATLAS9 grid or BSTAR2006 gird. Once we found the closest match with the grid, we used linear interpolation between the grid points to find the best fit for and . The errors in and were determined by allowing 5% tolerance of the (O-C)2. Our and measurements are recorded in Table 2.
4 Discussion
As expected, we find large discrepancies between photometrically derived and and our measurements. In columns 2 and 3 of Table 3, we show the derived and from the KIC for our observed stars (Brown et al., 2011). We include in column 4 of Table 3 the from the recently released DR2 (Andrae et al., 2018). Columns 7 and 8 of this table give our measurements using spectroscopic fitting as well as the uncertainties for these values.
We also include in columns 5 and 6 of Table 3 some revised measurements from Balona et al. (2011) and Pápics et al. (2017). Balona et al. (2011) used metal-line blanketed LTE models to model their stars following the methods described by Østensen et al. (2010). The biggest reason for the discrepancy with our results and those from Balona et al. (2011) is that they assume 0 km s-1 for all of their measurements. As a result, they overestimate and significantly for stars with large , which leads to wider, shallower hydrogen lines which peak in strength around 10,000 K. Pápics et al. (2017) used the BSTAR2006 synthetic spectra (Lanz & Hubeny, 2007) to measure the fundamental parameters of KIC 3459297. They also find = 109 14 km s-1 for KIC 3459297, which agrees with our measurements. Figure 1 compares our results for and with those from Balona et al. (2011) and Pápics et al. (2017). To emphasize the dependency on , the sizes of the symbols are proportional to our measured value of .
Using our measured and , we can compare model spectral energy distributions (SED) to photometric data to calculate the radii of our stars using
| (1) |
where is the apparent monochromatic flux, is the absolute flux at the surface of the star, and is the distance to the star. was calculated by converting the J, H, and K band magnitudes from the Two Micron All-Sky Survey (2MASS, Skrutskie et al. (2006)) to fluxes using the zero-points from Cohen et al. (2003). was determined using model SEDs with our measured and . We assumed no interstellar extinction () during this process, as these stars are above the Galactic plane where we would expect low values and they would have negligible effects in the J, H, and K bands. We used the BSTAR2006 models (Lanz & Hubeny, 2007) for stars with K and ATLAS models (Castelli & Kurucz, 2004) for stars with K. The distances were calculated by Bailer-Jones et al. (2018) by converting the parallaxes measured in DR2 using Bayesian statistics. Our error bars were calculated by propagating the errors from , and . We then used our measured and to calculate the masses () of our stars. KIC 11293898 likely has an underestimated mass, for reasons we discuss later in this work.
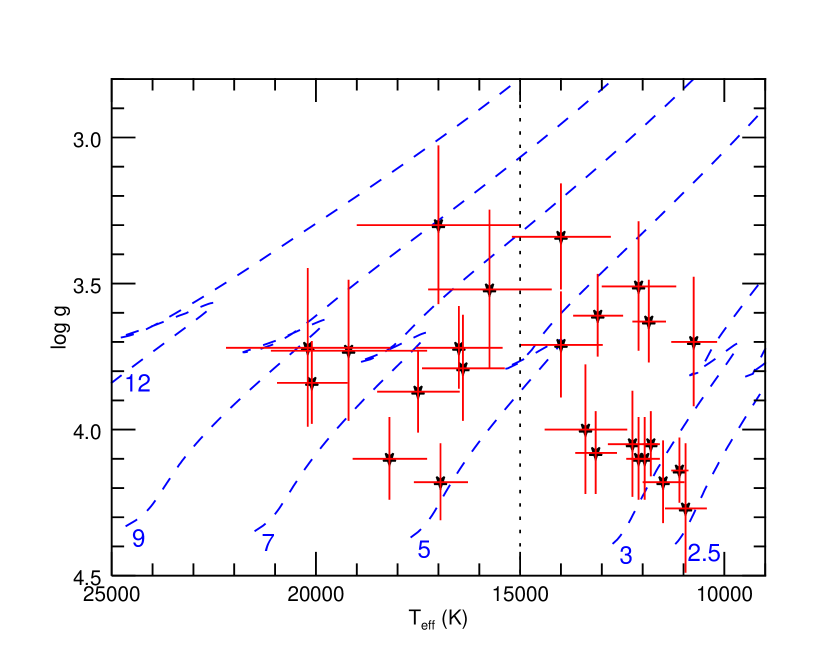
Using the non-rotating evolutionary tracks of Ekström et al. (2012), we calculated an approximate age of the stars by interpolating between tracks using and . In Table 2, we include our measured , and age (), as well as the calculated bolometric luminosity () and the distances from Bailer-Jones et al. (2018). We compare our and to the non-rotating evolutionary tracks of Ekström et al. (2012) in Figure 2. Our measured and are consistent with their positions along these evolutionary tracks for most stars.
The apparent magnitudes (V), bolometric absolute magnitudes (Mbol), bolometric corrections (BC), absolute magnitudes (), and calculated are all listed in Table 4. The values in column 6 are from the SIMBAD database with an assumed uncertainty of 0.1 mag, and the BC values in column 3 are interpolated from Flower (1996) and Torres (2010). Using , , and our measurements, we can estimate . The extinctions are calculated using
| (2) |
We find that is consistent with the 3D dust map provided by Green et al. (2018).
As mentioned before, we noticed our calculated mass for KIC 11293898 to be extremely low compared to its measured effective temperature. Using the non-rotated evolutionary tracks from Ekström et al. (2012), we can measure and based on and . We find = 5.16 and = 5.98 for KIC 11293898. Using this , we find = 9752 pc, which is well over twice the value calculated by Bailer-Jones et al. (2018).
Our goal with this publication is to improve the measurements of fundamental parameters for pulsating B-type stars in the Kepler survey. Using model fitting with the Tlusty BSTAR2006 grid and Kurucz ATLAS9 model atmospheres, as well as use of evolutionary tracks from Ekström et al. (2012), we measured , , , , , , and for 25 pulsating B-type stars . We find that the and measurements from KIC and DR2 are unreliable for these hot stars and that improved stellar parameters are required to continue asteroseismic analysis of these stars.
References
- Andrae et al. (2018) Andrae, R., Fouesneau, M., Creevey, O., et al. 2018, A&A, 616, A8
- Bailer-Jones et al. (2018) Bailer-Jones, C. A. L., Rybizki, J., Fouesneau, M., Mantelet, G., & Andrae, R. 2018, AJ, 156, 58
- Balona et al. (2011) Balona, L. A., Pigulski, A., Cat, P. D., et al. 2011, MNRAS, 413, 2403
- Brown et al. (2011) Brown, T. M., Latham, D. W., Everett, M. E., & Esquerdo, G. A. 2011, AJ, 142, 112
- Castelli & Kurucz (2004) Castelli, F., & Kurucz, R. L. 2004, arXiv:astro-ph/0405087
- Chaplin (2013) Chaplin, W. J. 2013, Astronomische Nachrichten, 334, 133
- Chaplin et al. (2011) Chaplin, W. J., Kjeldsen, H., Christensen-Dalsgaard, J., et al. 2011, Science, 332, 213
- Cohen et al. (2003) Cohen, M., Wheaton, W. A., & Megeath, S. T. 2003, AJ, 126, 1090
- Ekström et al. (2012) Ekström, S., Georgy, C., Eggenberger, P., et al. 2012, A&A, 537, A146
- Flower (1996) Flower, P. J. 1996, ApJ, 469, 355
- Green et al. (2018) Green, G. M., Schlafly, E. F., Finkbeiner, D., et al. 2018, MNRAS, 478, 651
- Huber et al. (2012) Huber, D., Ireland, M. J., Bedding, T. R., et al. 2012, ApJ, 760, 32
- Kurucz (1994) Kurucz, R. L. 1994, Kurucz CD-ROM 19, Solar Abundance Model Atmospheres for 0, 1, 2, 4, 8 km/s (Cambridge: SAO)
- Lanz & Hubeny (2007) Lanz, T., & Hubeny, I. 2007, ApJS, 169, 83
- McNamara et al. (2012) McNamara, B. J., Jackiewicz, J., & McKeever, J. 2012, AJ, 143, 101
- Østensen et al. (2010) Østensen, R. H., Silvotti, R., Charpinet, S., et al. 2010, MNRAS, 409, 1470
- Pápics et al. (2017) Pápics, P. I., Tkachenko, A., Van Reeth, T., et al. 2017, A&A, 598, A74
- Pinsonneault et al. (2012) Pinsonneault, M. H., An, D., Molenda-Żakowicz, J., et al. 2012, ApJS, 199, 30
- Saesen et al. (2010) Saesen, S., Carrier, F., Pigulski, A., et al. 2010, A&A, 515, A16
- Skrutskie et al. (2006) Skrutskie, M. F., Cutri, R. M., Stiening, R., et al. 2006, AJ, 131, 1163
- Torres (2010) Torres, G. 2010, AJ, 140, 1158
- Yu et al. (2018) Yu, J., Huber, D., Bedding, T. R., et al. 2018, ApJS, 236, 42
| KIC | V i4026 | V i | V i4388 | V i | V i4471 | V i | V i4481 | V i | V i | V i |
|---|---|---|---|---|---|---|---|---|---|---|
| ID | (km s-1) | (km s-1) | (km s-1) | (km s-1) | (km s-1) | (km s-1) | (km s-1) | (km s-1) | (km s-1) | (km s-1) |
| 1430353 | 190 | 20 | 195 | 10 | 195 | 12 | 235 | 7 | 210 | 26 |
| 3459297 | 114 | 10 | 130 | 7 | 123 | 12 | ||||
| 3839930 | 60 | 5 | 50 | 2 | 50 | 2 | 50 | 2 | 51 | 6 |
| 3862353 | 80 | 12 | 55 | 10 | 60 | 5 | 80 | 10 | 64 | 15 |
| 4077252 | 77 | 22 | 62 | 5 | 65 | 23 | ||||
| 4936089 | 51 | 6 | 46 | 3 | 48 | 7 | ||||
| 4939281 | 115 | 12 | 100 | 5 | 100 | 15 | 135 | 5 | 115 | 20 |
| 5477601 | 98 | 11 | 86 | 2 | 88 | 11 | ||||
| 7630417 | 135 | 7 | 130 | 7 | 145 | 12 | 135 | 16 | ||
| 8167938 | 70 | 3 | 70 | 3 | ||||||
| 8264293 | 284 | 5 | 283 | 12 | 284 | 13 | ||||
| 8381949 | 245 | 10 | 245 | 10 | 245 | 15 | 245 | 21 | ||
| 8714886 | 75 | 7 | 45 | 5 | 50 | 2 | 50 | 2 | 52 | 9 |
| 9227988 | 52 | 2 | 48 | 2 | 50 | 3 | ||||
| 9278405 | 115 | 16 | 108 | 7 | 110 | 17 | ||||
| 9468611 | 282 | 29 | 258 | 8 | 263 | 30 | ||||
| 9715425 | 125 | 7 | 125 | 7 | 115 | 7 | 122 | 12 | ||
| 9910544 | 72 | 4 | 72 | 3 | 72 | 5 | ||||
| 9964614 | 85 | 5 | 65 | 5 | 75 | 7 | 85 | 10 | 77 | 14 |
| 10118750 | 271 | 16 | 271 | 16 | ||||||
| 10526294 | 37 | 9 | 35 | 4 | 36 | 10 | ||||
| 10790075 | 74 | 5 | 70 | 2 | 71 | 5 | ||||
| 11293898 | 355 | 27 | 360 | 17 | 350 | 15 | 355 | 35 | ||
| 11360704 | 300 | 7 | 300 | 7 | 300 | 7 | 310 | 7 | 303 | 12 |
| 11671923 | 89 | 6 | 92 | 5 | 91 | 8 |
| KIC | Teff | Teff | log g | log g | M⋆ | R⋆ | Lbol | r | |
|---|---|---|---|---|---|---|---|---|---|
| ID | (K) | (K) | (dex) | (dex) | (M⊙) | (R⊙) | (L⊙) | (Myr) | (pc) |
| 1430353 | 17000 | 2000 | 3.30 | 0.27 | 3.88 | 7.31 | 4015 | 42 | 7760 |
| 3459297 | 13100 | 600 | 3.61 | 0.14 | 1.84 | 3.52 | 329 | 130 | 3463 |
| 3839930 | 16950 | 650 | 4.18 | 0.13 | 4.70 | 2.92 | 634 | 32 | 1763 |
| 3862353 | 14000 | 1000 | 3.71 | 0.18 | 2.98 | 3.99 | 551 | 102 | 9448 |
| 4077252 | 12100 | 900 | 3.51 | 0.22 | 1.49 | 3.56 | 244 | 179 | 2752 |
| 4936089 | 12250 | 600 | 4.05 | 0.18 | 1.94 | 2.18 | 96 | 103 | 1596 |
| 4939281 | 17500 | 1000 | 3.87 | 0.14 | 4.77 | 4.20 | 1492 | 49 | 4103 |
| 5477601 | 11950 | 350 | 4.10 | 0.14 | 2.39 | 2.28 | 96 | 136 | 2134 |
| 7630417 | 19200 | 1900 | 3.73 | 0.24 | 4.71 | 4.91 | 2947 | 33 | 10346 |
| 8167938 | 13400 | 1000 | 4.00 | 0.22 | 9.14 | 5.01 | 728 | 111 | 1859 |
| 8264293 | 13150 | 500 | 4.08 | 0.14 | 2.62 | 2.44 | 161 | 105 | 1328 |
| 8381949 | 20200 | 2000 | 3.72 | 0.27 | 6.74 | 5.94 | 5282 | 28 | 4019 |
| 8714886 | 18200 | 900 | 4.10 | 0.14 | 3.47 | 2.75 | 747 | 16 | 1560 |
| 9227988 | 14000 | 1200 | 3.34 | 0.18 | 2.57 | 5.68 | 1114 | 93 | 6799 |
| 9278405 | 11100 | 200 | 4.14 | 0.11 | 2.11 | 2.05 | 57 | 173 | 654 |
| 9468611 | 11200 | 600 | 3.90 | 0.22 | 1.85 | 2.53 | 90 | 224 | 2729 |
| 9715425 | 15750 | 750 | 3.52 | 0.27 | 2.14 | 4.21 | 982 | 67 | 6059 |
| 9910544 | 12100 | 300 | 4.10 | 0.14 | 4.21 | 3.03 | 177 | 184 | 1294 |
| 9964614 | 20100 | 850 | 3.84 | 0.14 | 6.62 | 5.13 | 3862 | 29 | 3407 |
| 10118750 | 10950 | 500 | 4.27 | 0.22 | 2.94 | 2.08 | 56 | 196 | 3319 |
| 10526294 | 11500 | 500 | 4.18 | 0.14 | 3.26 | 2.43 | 93 | 189 | 3025 |
| 10790075 | 11850 | 400 | 3.63 | 0.14 | 2.28 | 3.83 | 260 | 184 | 4153 |
| 11293898 | 16400 | 1000 | 3.79 | 0.18 | 0.92 | 2.02 | 266 | 58 | 3823 |
| 11360704 | 16500 | 1050 | 3.72 | 0.14 | 7.26 | 6.16 | 2532 | 52 | 3428 |
| 11671923 | 11800 | 200 | 4.05 | 0.11 | 2.96 | 2.69 | 127 | 188 | 1065 |
| KIC | DR2 | Other | This Work | ||||
|---|---|---|---|---|---|---|---|
| KIC | |||||||
| ID | (K) | (dex) | (K) | (K) | (dex) | (K) | (dex) |
| 1430353 | 10765 | 3.653 | 9585 | 17000 2000 | 3.30 0.27 | ||
| 3459297 | 10592 | 4.629 | 9365 | 13430 250aaPápics et al. 2017 | 3.8 0.1aaPápics et al. 2017 | 13100 600 | 3.61 0.14 |
| 3839930 | 11272 | 4.277 | 8712 | 16500 1000bbBalona et al. 2011 | 4.2 0.3bbBalona et al. 2011 | 16950 650 | 4.18 0.13 |
| 3862353 | 10738 | 4.025 | 9623 | 14000 1000 | 3.71 0.18 | ||
| 4077252 | 10514 | 3.948 | 9312 | 12100 900 | 3.51 0.22 | ||
| 4936089 | 11295 | 4.275 | 9554 | 12250 600 | 4.05 0.18 | ||
| 4939281 | 11298 | 4.316 | 8726 | 17500 1000 | 3.87 0.14 | ||
| 5477601 | 10906 | 4.138 | 9304 | 11950 350 | 4.10 0.14 | ||
| 7630417 | 10449 | 4.581 | 9613 | 19200 1900 | 3.73 0.24 | ||
| 8167938 | 11167 | 4.228 | 9453 | 12300 800bbBalona et al. 2011 | 4.0 0.3bbBalona et al. 2011 | 13400 1000 | 4.00 0.22 |
| 8264293 | 10038 | 4.458 | 9530 | 13150 500 | 4.08 0.14 | ||
| 8381949 | 9782 | 4.394 | 9020 | 24500 1400bbBalona et al. 2011 | 4.3 0.3bbBalona et al. 2011 | 20200 2000 | 3.72 0.27 |
| 8714886 | 9142 | 4.093 | 9351 | 19000 1200bbBalona et al. 2011 | 4.3 0.3bbBalona et al. 2011 | 18200 900 | 4.10 0.14 |
| 9227988 | 10890 | 4.023 | 9546 | 14000 1200 | 3.34 0.18 | ||
| 9278405 | 11486 | 4.199 | 8614 | 11100 200 | 4.14 0.11 | ||
| 9468611 | 11063 | 3.735 | 9365 | 10750 550 | 3.70 0.22 | ||
| 9715425 | 11199 | 4.114 | 8728 | 15750 1500 | 3.52 0.27 | ||
| 9910544 | 10698 | 4.079 | 9540 | 12100 300 | 4.10 0.14 | ||
| 9964614 | 8915 | 4.067 | 8869 | 20300 1200bbBalona et al. 2011 | 3.9 0.2bbBalona et al. 2011 | 20100 850 | 3.84 0.14 |
| 10118750 | 11147 | 3.751 | 9045 | 10950 500 | 4.27 0.22 | ||
| 10526294 | 11072 | 3.743 | 8983 | 11500 500 | 4.18 0.14 | ||
| 10790075 | 11396 | 3.771 | 9055 | 11850 400 | 3.63 0.14 | ||
| 11293898 | 15072 | 4.932 | 8599 | 16400 1000 | 3.79 0.18 | ||
| 11360704 | 12400 | 4.934 | 8869 | 20700 1200bbBalona et al. 2011 | 4.1 0.3bbBalona et al. 2011 | 16500 1050 | 3.72 0.14 |
| 11671923 | 10044 | 4.237 | 9285 | 11800 200 | 4.05 0.11 | ||
| KIC | Mbol | BC | BC | MV | V | AV |
|---|---|---|---|---|---|---|
| ID | (mag) | (mag) | (mag) | (mag) | (mag) | (mag) |
| 1430353 | -4.28 | -1.53 | 0.61 | -2.75 | 12.71 | 1.01 |
| 3459297 | -1.56 | -0.90 | 0.27 | -0.66 | ||
| 3839930 | -2.27 | -1.52 | 0.20 | -0.75 | 10.79 | 0.31 |
| 3862353 | -2.12 | -1.07 | 0.41 | -1.05 | ||
| 4077252 | -1.24 | -0.70 | 0.43 | -0.54 | 12.29 | 0.63 |
| 4936089 | -0.23 | -0.73 | 0.29 | 0.51 | 11.93 | 0.41 |
| 4939281 | -3.2 | -1.60 | 0.30 | -1.61 | ||
| 5477601 | -0.22 | -0.67 | 0.17 | 0.45 | ||
| 7630417 | -3.94 | -1.80 | 0.50 | -2.14 | ||
| 8167938 | -2.43 | -0.96 | 0.43 | -1.46 | 10.77 | 0.89 |
| 8264293 | -0.79 | -0.91 | 0.22 | 0.13 | 11.26 | 0.52 |
| 8381949 | -4.58 | -1.91 | 0.50 | -2.66 | 10.96 | 0.6 |
| 8714886 | -2.45 | -1.68 | 0.25 | -0.77 | 10.86 | 0.66 |
| 9227988 | -2.89 | -1.07 | 0.49 | -1.82 | 12.54 | 0.19 |
| 9278405 | 0.33 | -0.49 | 0.10 | 0.82 | 10.16 | 0.26 |
| 9468611 | -0.16 | -0.51 | 0.30 | 0.35 | ||
| 9715425 | -2.75 | -1.35 | 0.51 | -1.4 | ||
| 9910544 | -0.89 | -0.70 | 0.14 | -0.19 | 10.80 | 0.43 |
| 9964614 | -4.24 | -1.90 | 0.22 | -2.33 | 10.61 | 0.28 |
| 10118750 | 0.36 | -0.46 | 0.25 | 0.81 | ||
| 10526294 | -0.19 | -0.58 | 0.25 | 0.38 | ||
| 10790075 | -1.31 | -0.65 | 0.20 | -0.66 | 12.96 | 0.53 |
| 11293898 | -1.33 | -1.45 | 0.32 | 0.12 | ||
| 11360704 | -3.78 | -1.46 | 0.34 | -2.32 | 10.62 | 0.26 |
| 11671923 | -0.53 | -0.64 | 0.10 | 0.11 | 10.58 | 0.33 |