The spin-1/2 coupled tetramer system Ba(TiO)Cu4(PO4)4 probed by magnetization, specific heat, and 31P-NMR
Abstract
We present the synthesis and a detailed investigation of structural and magnetic properties of polycrystalline Ba(TiO)Cu4(PO4)4 (BTCPO) via x-ray diffraction, magnetic susceptibility, heat capacity, and 31P Nuclear Magnetic Resonance (NMR) measurements. BTCPO has a 2D layered structure with interlinked Cu4O12 tetramer units. A broad maximum is observed around 16.5 K in our magnetization data accompanied by a sharp anomaly around = 9.5 K in the heat capacity. An anomaly at about = 10 K is also found in the temperature dependence of the 31P NMR spin-lattice relaxation rate . A power law behavior for the heat capacity as well as for the 31P below the ordering temperature could be obtained. The 31P NMR lineshape is asymmetric and the NMR shift tracks the bulk spin-susceptibility. We estimated the isotropic and axial components of the hyperfine coupling tensor to be as the and , respectively.
I Introduction
Low-dimensional quantum spin systems have been the harbinger of high- superconductivity in the cuprates. On their own as well, they evidence exotic magnetic ground states and excitations. This has lead to an enduring interest in quantum magnets and efforts continue to be made to obtain a better understanding of the diversity of the underlying physics in actual experimental realizations.
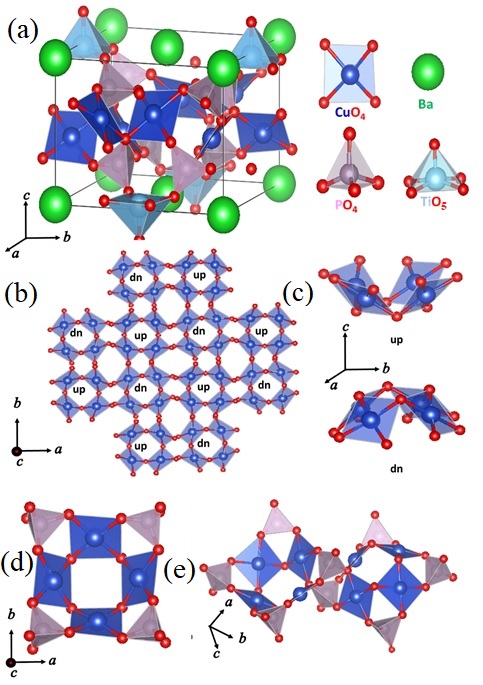
Ba(TiO)Cu4(PO4)4 (BTCPO) has a tetragonal structure in which Cu4O12 assemblies are formed by four corner sharing square planar CuO4 units. Each cluster of four CuO4 units buckles from its planar orientation and gives rise to cupolas (see Fig.1). These Cu cupolas interact with each other through PO4 pyramids. In the recent past, interesting work has been reported on the system BTCPO where quadrupolar magnetic moments arise due to buckling of the plaquettes made up of four corner-sharing square-planar CuO4 units which give rise to magnetoelectric activityKimura et al. (2016a). The magnetic susceptibility of BTCPO exhibits a broad maximum ( 17 K) possibly due to short range order in the layers or possibly within the cupola. Finally, three-dimensional (3D) long range order (LRO) sets in at 9.5 K due to interlayer interactionsKimura et al. (2016a).
Detailed work pertaining to magnetism and magnetoelectricity of BTCPO (and on Sr as well as on Pb analogs) as also neutron diffraction and dielectric measurements have been reportedKimura et al. (2016b); Babkevich et al. (2017); Kimura et al. (2018). Further, magnetization, heat capacity, 31P NMR and density functional theory calculations have been reported in Sr(TiO)Cu4(PO4)4Islam et al. (2018)(STCPO). STCPO was found to order antiferromagnetically at a lower temperature of K and a spin gap of K was found. Recently in Ref.Kato et al. (2019) a combined experimental and theoretical magnetoelectric properties of STCPO, BTCPO and Pb(TiO)Cu4(PO4)4 (PTCPO) has been reported in detail.
In this paper, we present the structural and magnetic properties of BTCPO together with heat capacity and 31P Nuclear Magnetic Resonance (NMR) measurements. We find a broad peak in the susceptibility () around 16.5 K. No sharp anomaly is seen in below 16.5 K which is in strong contrast to the heat capacity which shows a clear -like anomaly characteristic of three-dimensional (3D) long-range order (LRO). The 31P NMR shift () shows a broad maximum at 15 K. We obtain power-law dependencies for the heat capacity and the 31P NMR below the ordering temperature.
II Experimental Details
A polycrystalline sample of BTCPO was prepared by conventional solid state reaction method using high purity initial materials: BaCO3 (Alfa Aesar 99.95% ), TiO2 (Alfa Aesar 99.9%), NH4H2PO4 (Loba Chemie ultra pure) and CuO (Alfa Aesar 99.995%). Powder x-ray diffraction (XRD) measurements were performed at room temperature with Cu radiation ( Å) on a PANalytical X’PertPRO diffractometer. Magnetization measurements were carried out in the temperature range 2-400 K and the field range 0-70 kOe using a Quantum Design SVSM. Heat capacity measurements were done in the temperature range 2-295 K in the field range 0-90 kOe using the heat capacity option of a Quantum Design PPMS. 31P NMR measurements have been done using pulsed NMR techniques in a fixed magnetic field of 93.954 kOe with a Tecmag spectrometer. The temperature was varied between 4-300 K using an Oxford continuous flow cryostat.
III Results and discussion
In this section, we present the results of our XRD, magnetization, heat capacity and 31P NMR measurements followed by a discussion of the obtained data.
III.1 Crystal structure
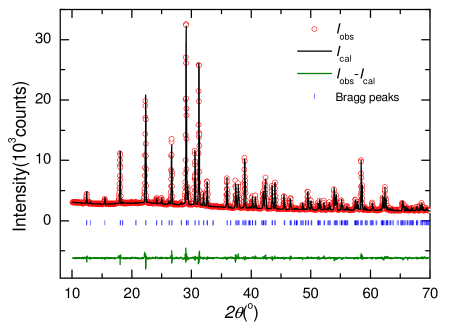
The powder XRD pattern of BTCPO (see Fig.2) could be indexed within the space group 4 21 2 (space group no. 90) without any impurity peaks. The refinement was carried out with the FULLPROF SUITERodríguez-Carvajal . The refinement parameters are shown in Table 1. The lattice parameters for BTCPO are = = 9.6084 Å, = 7.1236 Å. The refined atomic coordinates are shown in Table 2. Our results are in agreement with those of Ref. Kimura et al. (2016b).
| Space group | 4 21 2 |
|---|---|
| Crystal system | Tetragonal |
| Lattice parameters | 9.6084 Å, =7.1236 Å |
| Refinement parameters | |
| Atom | Wyk. Pos. | x | y | z | Occ. | B() |
| Ba | 2a | 0.0000 | 0.0000 | 0.0000 | 1 | 1.6(2) |
| Cu | 8 | 0.2662 | 0.9928 | 0.4007 | 1 | 2.4(2) |
| Ti | 2c | 0.5000 | 0.0000 | 0.9717 | 1 | 1.7(3) |
| P | 8 | 0.2839 | 0.1930 | 0.7458 | 1 | 2.7(4) |
| O1 | 8 | 0.3558 | 0.1302 | 0.5581 | 1 | 0.734298 |
| O2 | 8 | 0.1237 | 0.1474 | 0.7254 | 1 | 0.884316 |
| O3 | 8 | 0.3315 | 0.1201 | 0.9256 | 1 | 0.868525 |
| O4 | 2c | 0.5000 | 0.0000 | 0.2074 | 1 | 0.947482 |
| O5 | 8 | 0.3056 | 0.3384 | 0.7635 | 1 | 0.836942 |
The unit cell of BTCPO is shown in Fig.1(a) with CuO4 plaquettes connected to TiO5 pyramids through PO4 tetrahedra. In Fig.1(b) the (buckled) upward and downward facing Cu4O12 square cupolas have been shown. Individual up facing and down facing Cu4O12 Cupola is shown in Fig.1(c). How a Cu is coupled with P via O is shown in Fig.1(d and e), where one Cu atom is connected with P through three different O atoms. The Cu-O bond length varies from 1.921 to 2.011 and the O-P bond length has values from 1.418 to 1.621 . The bond angle Cu-O-P has values between 56.8∘ to 122.8∘.
| Bond length (Å) | Bond angle (∘) |
|---|---|
III.2 Magnetic Susceptibility
Fig.3 shows the magnetization () divided by the magnetic field () () for BTCPO as a function of temperature along with the inverse susceptibility . A fit to the high-temperature data (150-390 K) using the Curie-Weiss law ()) yields a Curie-Weiss temperature K which indicates antiferromagnetic interaction between the Cu2+ ions. The value for BTCPO is higher than that of the isostructural STCPO compound which is 18.7 K. The temperature independent susceptibility is obtained to be . Furthermore, the effective magnetic moment is which is typical for Cu2+ ion with a small spin-orbit coupling. On cooling, a broad maximum appears around 16.5 K in . The broad maximum is likely due to short range correlation within each cupola or within the two dimensional Cu-O layer.
We have further fitted the susceptibility, after subtracting the temperature independent susceptibility (), to a uniform tetramer model with nearest neighbor interaction in the Heisenberg model
| (1) |
The expression for susceptibility Haraldsen et al. (2005) () in this case is:
| (2) |
where , is Boltzmann constant, is the Bohr magneton, and is the electron -factor.
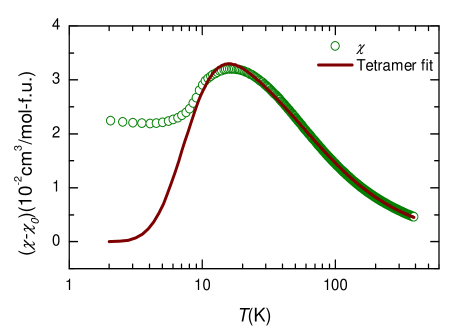
Our fit (see Fig.4) yields K and . Although the simple tetramer model fits the data well even a little below the broad maximum, non-zero intralayer and interlayer interactions among Cu2+ ions were inferred from the analysis of the inelastic neutron scattering dataKimura et al. (2018); Kato et al. (2017). Therefore a complete analysis which includes other intra-tetramer/cupola and inter-cupola interactions is needed.
III.3 Heat Capacity
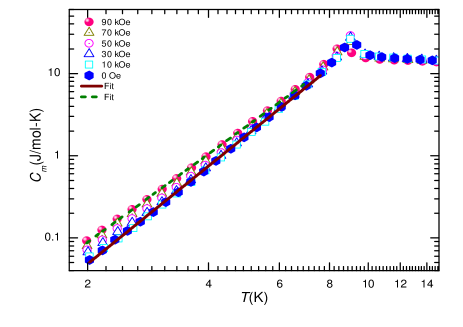
To explore further the ground state and low energy excitations of BTCPO, we have measured the heat capacity as a function of temperature in various fields (0-90 kOe) as shown in Fig.5. Here it is clear that there is a sharp peak at = 9.5 K, which assures long-range ordering in the system. To inspect the behavior of below , variation of against is shown in the inset of Fig.5. From this it becomes evident that in contrast to the Sr homologue of BTCPO is rather robust in a magnetic field and only a small shift of with field is observed.
The specific heat of a magnetic insulator comprises of the specific heat due to the lattice () and the specific heat due to the magnetic entities ()E.S.R. (2012).
To estimate the lattice contribution () in the absence of a suitable non-magnetic analog for BTCPO, a combination of Debye and Einstein terms, given below, have been used.
| (3) |
where, and
.
One formula unit of Ba(TiO)Cu4(PO4)4 has 27 atoms. Hence in each crystallographic direction there will be one acoustic and 26 optical modes of atomic vibrationsAshcroft and Mermin (1976). The Debye integral term in Eq.(3) represents three accoustic vibrational modes and the Einstein term in Eq.(3) accounts for 78 optical vibrational modes of phonons. This amounts to the condition and or for each direction. The experimental data were found to be fitted well (see Fig.5) with the weightage factors corresponding to Debye model and Einstein model. Taking , our fit yields , K, , K, , K, , K . Here it is worth to mention that this is a simple model to extract the basic characteristics of lattice dynamics which is complex in nature.
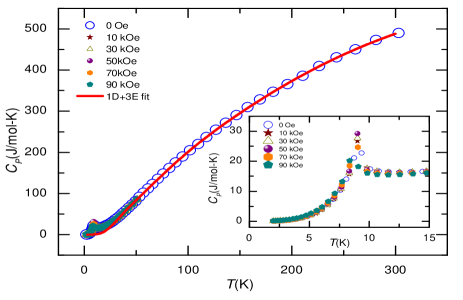
The magnetic specific heat (()) has been extracted by subtracting from data. In Fig.6, () at different applied fields has been shown. One can notice that the peak position is nearly field dependent and the peak shifts by 1 K at 90 kOe . A power law ( ) behavior is observed below . From the Fig.6 the extracted values of the power law exponent are 3.9 and 3.6 for zero field and 90 kOe respectively. The high power law exponent is due to 3D orderingJoshua (1998) among Cu2+ ions, which are interacting antiferromagnetically and due to phonon-magnon couplingPincus and Winter (1961). A gap of 11.5 K has been seen in neutron scattering measurementsKimura et al. (2016a). An exponential decrease of magnetic heat capacity is expected for a system with an excitation gap. Given the limited temperature range of our data, it may not be easy to distinguish exponential behavior from a (large) power law behavior.
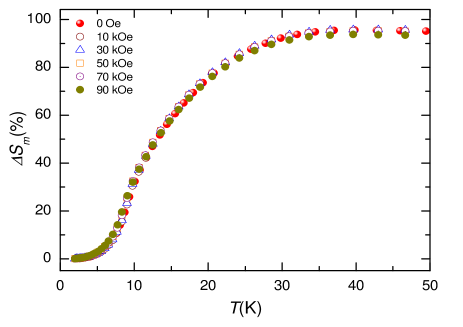
After calculating , the magnetic entropy change can be calculated simply by integrating with respect to temperature . In Fig.7 as a function of at different magnetic fields has been shown. It is notable that most of the entropy decrease has taken place above ( 9.5 K). The calculated in zero field was found to be (J/K-mol-Cu) upto 50 K, which is 95 % of ln(2) , expected for a system. This clearly confirms the magnetic order in BTCPO is of long ranged nature. The apparent missing entropy probably is due to the uncertainty in the estimation of the phonon reference .
III.4 31P NMR
III.4.1 NMR shift
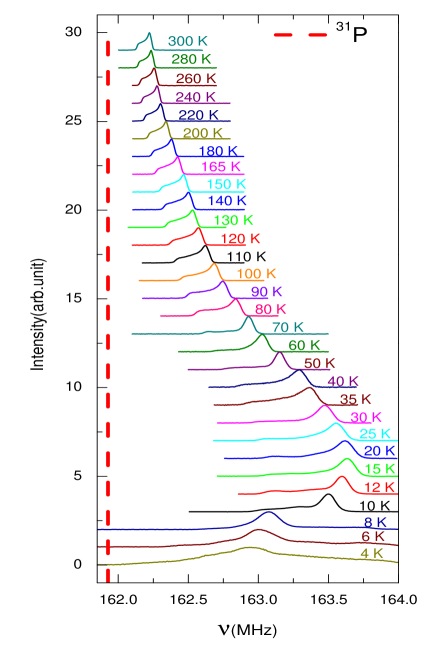
NMR is a robust local probe to study the static and dynamic properties of the magnetic systems. In BTCPO 31P nuclei are coupled to the magnetic spins of Cu2+ through a transferred hyperfine coupling. As the 31P is a spin 1/2 nucleus, a single spectral line is expected for 31P NMR. Respective spectra of BTCPO at selected temperatures have been shown in Fig.8. We can see an asymmetric line shape which shifts with temperature. The asymmetric line shape is either due to an anisotropy of the spin susceptibility and/or anisotropy of the hyperfine coupling. As shown in Fig.8 the peak position of the spectrum shifts to higher frequencies as temperature is lowered, levels off around 15 K and then it shifts to lower frequencies with the further decrease of temperature down to 4 K.
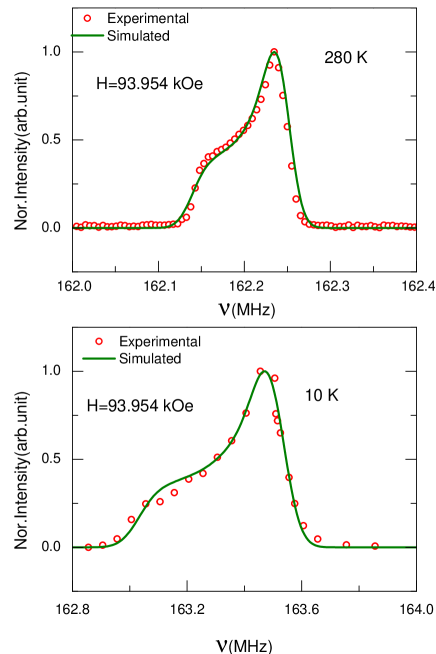
In order to estimate the 31P NMR powder averaged line shifts (, and ) from our experimentally taken spectra as a function of temperature, we compared the measured spectra with simulated lineshapes here.
| (4) |
| (5) |
| (6) |
where , and denote the principal components of the shift tensor .
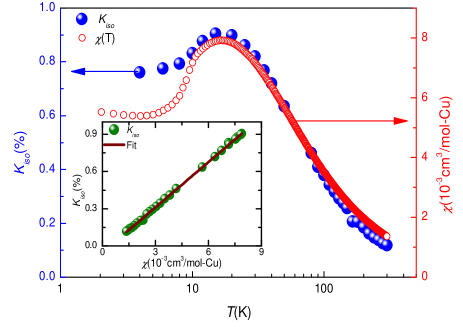
Fixing and taking , as variable parameters, we looked for good agreement between the simulated and experimental spectra. A few simulated spectra as a function of frequency at selected temperatures are shown in Fig.9. With , provides the average intrinsic susceptibility, which is proportional to for an axially symmetric shift ( = and ). Here means that the external field is parallel to the direction and corresponds to the external field perpendicular to the direction. To scrutinize the behavior of intrinsic susceptibility (static susceptibility) has been plotted as a function of temperature in Fig.10 (left -axis). The for the 31P site shows a broad maximum 15 K, which indicates short-range ordering in BTCPO and the right -axis in Fig.10 shows for BTCPO which follows same as . Here for BTCPO ordering temperature and maximum is at higher temperature comparative to STCPO. We note that reflects explicitly and it can be written
| (7) |
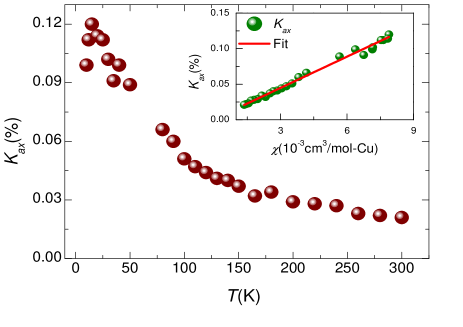
Here, is the temperature independent chemical shift and is the total hyperfine coupling between 31P nuclei and Cu2+ spins. Fig.10 shows the comparison of NMR-shift as a function of temperature with susceptibility as a function of temperature and it is clear that the shift tracks the susceptibility. In the inset of Fig.10, is plotted as a function of by taking temperature () as an implicit parameter. The linear fit of the data for T 10, yields the isotropic part of hyperfine coupling . In Fig.11 the axial 31P NMR shift is shown as a function of temperature and it also has a broad maximum around 15 K. To extract the axial part of the hyperfine coupling linear fit of vs is shown in inset of Fig.11 and . These values are comparable to the hyperfine coupling constants for isostructural STCPO Islam et al. (2018), which are 6539 and 952 for and respectively. It is noteworthy to mention that the NMR shift directly explore and is free from impurity.
III.4.2 Spin-lattice relaxation rate,
The spin-lattice relaxation rate probes the low energy spin excitationsMoriya (1956). We have monitored the recovery of the longitudinal nuclear magnetization of 31P following a saturating pulse sequence. The recovery fits well to a single exponential function as expected for a nucleus.
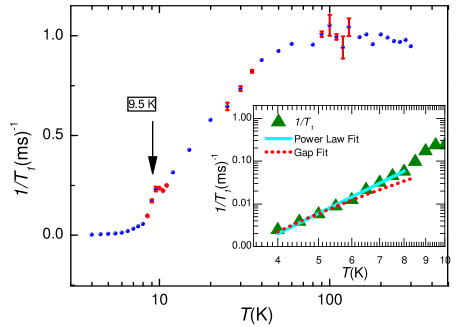
The values estimated from the single exponential function fit are plotted in Fig.12 as a function of temperature. At high temperatures , is temperature independent and on lowering temperature down to 4 decreases rapidly towards zero.
In the paramagnetic state, the is expected to be -independent as the fluctuation frequency is much greater than the NMR frequency. On lowering the temperature, decreases (below 80 K) for BTCPO and after going through an anomaly/plateau at about 10 K, it drops zero on further decreasing the temperature. Generally is expected to rise on approach to LRO and exhibit a divergence near the ordering temperature but here no sharp divergence is seen which is likely due to filtering of antiferromagnetic fluctuation at 31P site which is symmetrically located between the Cu. So this anomaly at 9.5 K is due to LRO in BTCPO .
The local moment contribution to the spin-lattice relaxation rate () is given byMoriya (1963); Mahajan et al. (1998)
| (8) |
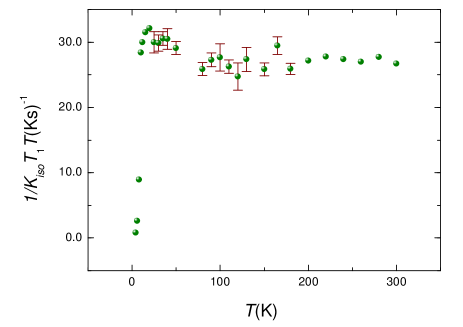
where the sum is over the wave vector , is the nuclear gyromagnetic ratio, is the electron gyromagnetic ratio, is assumed independent hyperfine coupling constant, is the dependent imaginary part of the dynamical susceptibility at the nuclear Larmor frequency and the summation is over all wave vectors. In the limit the summation is given by , where is the static local moment susceptibility per mole per atom and is electron fluctuation frequency. In the high- limit the susceptibility is Curie-like () and the relaxation rate becomes -independent and is , where the electron fluctuation frequency is rad/s where we assume uncorrelated fluctuations of 4 Cu neighbors of P. The number of nearest neighbors is taken as 4 and the exchange coupling is obtained (in a mean field approach) to be about 35 K from the value. Using the hyperfine field value 1698.5 Oe/ per Cu2+ (1/4 of total hyperfine coupling constant, 6794 Oe/) in Eq. 8 , we obtain ms-1. This is around one order of magnitude smaller than the experimentally measured rate of about 1 ms-1. A similar calculation of 31P NMR value in the paramagnetic region of STCPOIslam et al. (2018) yields 0.12 ms-1. This is also around one order of magnitude smaller than the experimentally measured rate of about 2 ms-1. However the expected ratio of the spin-lattice relaxation rate () for BTCPO to STCPO is based on the Moria formula which is comparable to the experimentally inferred ratio of about 0.5. In Fig.13, 1/( is plotted as a function of . We see that 1/( temperature independent above K. Based on Moriya formula, temperature independence of 1/( would be expected when fluctuations dominate the relaxation (see Eq. 8). The sharp decrease below 10 K is likely related to development of static moments below the ordering temperature. This dependence of 1/( on is likely due to the development of long-range order below about 10 K.
In the inset of Fig.12, is plotted as a function of and is seen to follow power law behavior () below K. The fit is seen to be good in the temperature range 8.5 - 4.0 K. The obtained exponent value is 4.9 and similar to that seen in our heat capacity data.
On the other hand, a fit to an activated behavior has been done for STCPOIslam et al. (2018), expecting that a two magnon (or Raman)Moriya (1956); Kaplan et al. (1966); Beeman and Pincus (1968) process might be responsible for nuclear spin-lattice relaxation as the spectral line shape is asymmetric. The equation used for such a fit is,
| (9) |
where is the gap. If we fit our data to Eq.9 in the limited temperature range 6.0 - 4.0 K, we get 11 K. Note that in Ref.Islam et al. (2018) as well, a fit to Eq.9 has been performed in the limited temperature range 3.3 - 1.8 K to extract the spin-gap value. Overall, a power law dependence below the ordering temperature appears to be more robust.
IV Conclusion
Using various experimental probes such as XRD, , , and NMR, properties of BTCPO have been explored. Conventional rectangular tetramer model fitting for our magnetization data yields a value of the exchange coupling to be about 47 K. A clear anomaly is seen in our data suggestive of antiferromagnetic ordering around 9.5 K. The inferred entropy change is nearly equal to that expected from the spin entropy. 31P NMR lineshapes are seen to be asymmetric. Analysis of the NMR data based on a hyperfine coupling anisotropy yields the isotropic and axial components of the hyperfine coupling tensor , respectively for BTCPO. The 31P NMR data exhibit an anomaly/plateau at about 10 K and analysis of the data below the ordering temperature suggests a power law variation with temperature. Given the large value of exponent () so obtained, a simple exponential variation would also fit the data. 31P NMR follows a power law below ordering temperature with exponent value 6.8 for STCPOIslam et al. (2018) which is somewhat larger than in BTCPO having exponent value 4.9. Exploration of the effect of dilution of the magnetic lattice on the magnetic and magnetoelectric properties appears to be an interesting direction for future pursuit.
V Acknowledgment
We acknowledge the financial help and central facilities provided by IIT Bombay and IRCC. Vinod Kumar would like to acknowledge Dr. Koteswara Rao Bommisetti for sharing his views.
References
- Kimura et al. (2016a) K. Kimura, P. Babkevich, M. Sera, M. Toyoda, K. Yamauchi, G. S. Tucker, J. Martius, T. Fennell, P. Manuel, D. D. Khalyavin, R. D. Johnson, T. Nakano, Y. Nozue, H. M. Rønnow, and T. Kimura, Nature communications 7, 13039 (2016a).
- Kimura et al. (2016b) K. Kimura, M. Sera, and T. Kimura, Inorganic Chemistry 55, 1002 (2016b).
- Babkevich et al. (2017) P. Babkevich, L. Testa, K. Kimura, T. Kimura, G. Tucker, B. Roessli, and H. Rønnow, Phys. Rev. B 96, 214436 (2017).
- Kimura et al. (2018) K. Kimura, M. Toyoda, P. Babkevich, K. Yamauchi, M. Sera, V. Nassif, H. Rønnow, and T. Kimura, Phys. Rev. B 97, 134418 (2018).
- Islam et al. (2018) S. S. Islam, K. M. Ranjith, M. Baenitz, Y. Skourski, A. A. Tsirlin, and R. Nath, Phys. Rev. B 97, 174432 (2018).
- Kato et al. (2019) Y. Kato, K. Kimura, A. Miyake, M. Tokunaga, A. Matsuo, K. Kindo, M. Akaki, M. Hagiwara, S. Kimura, T. Kimura, and Y. Motome, Phys. Rev. B 99, 024415 (2019).
- (7) J. Rodríguez-Carvajal, FullProf: A Program for Rietveld Refinement and Profile Matching Analysis of Complex Powder Diffraction Pattern (ILL, unpublished) .
- Haraldsen et al. (2005) J. Haraldsen, T. Barnes, and J. Musfeldt, Physical Review B 71, 064403 (2005).
- Kato et al. (2017) Y. Kato, K. Kimura, A. Miyake, M. Tokunaga, A. Matsuo, K. Kindo, M. Akaki, M. Hagiwara, M. Sera, T. Kimura, and Y. Motome, Phys. Rev. Lett. 118, 107601 (2017).
- E.S.R. (2012) G. E.S.R., Specific heats at low temperatures (Springer Science & Business Media, 2012).
- Ashcroft and Mermin (1976) N. Ashcroft and N. Mermin, Solid State Physics, HRW international editions (Holt, Rinehart and Winston, 1976).
- Joshua (1998) S. Joshua, Physica A: Statistical Mechanics and its Applications 261, 135 (1998).
- Pincus and Winter (1961) P. Pincus and J. Winter, Phys. Rev. Lett. 7, 269 (1961).
- Moriya (1956) T. Moriya, Progress of Theoretical Physics 16, 641 (1956).
- Moriya (1963) T. Moriya, Journal of the Physical Society of Japan 18, 516 (1963).
- Mahajan et al. (1998) A. V. Mahajan, R. Sala, E. Lee, F. Borsa, S. Kondo, and D. C. Johnston, Phys. Rev. B 57, 8890 (1998).
- Kaplan et al. (1966) N. Kaplan, R. Loudon, V. Jaccarino, H. J. Guggenheim, D. Beeman, and P. A. Pincus, Phys. Rev. Lett. 17, 357 (1966).
- Beeman and Pincus (1968) D. Beeman and P. Pincus, Phys. Rev. 166, 359 (1968).