From self-organization in relativistic electron bunches to coherent synchrotron light: observation using a photonic time-stretch digitizer
In recent and future synchrotron radiation facilities, relativistic electron bunches with increasingly high charge density are needed for producing brilliant light at various wavelengths, from X-rays to terahertz. In such conditions, interaction of electrons bunches with their own emitted electromagnetic fields leads to instabilities and spontaneous formation of complex spatial structures. Understanding these instabilities is therefore key in most electron accelerators. However, investigations suffer from the lack of non-destructive recording tools for electron bunch shapes. In storage rings, most studies thus focus on the resulting emitted radiation. Here, we present measurements of the electric field in the immediate vicinity of the electron bunch in a storage ring, over many turns. For recording the ultrafast electric field, we designed a photonic time-stretch analog-to-digital converter with terasamples/second acquisition rate. We could thus observe the predicted link between spontaneous pattern formation and giant bursts of coherent synchrotron radiation in a storage ring.
introduction
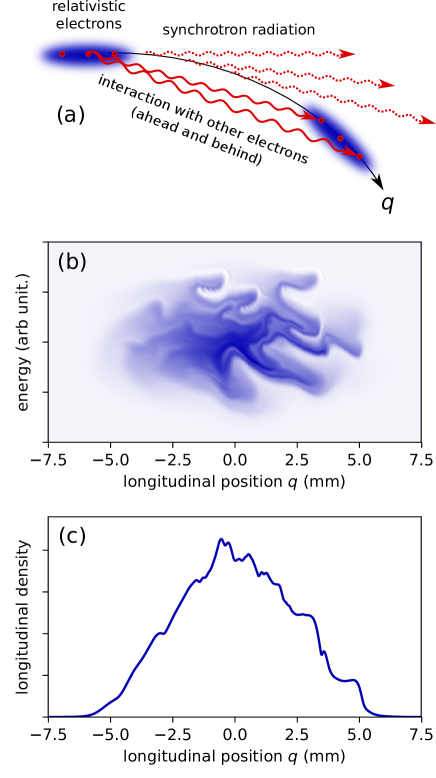
Current storage ring synchrotron radiation facilities involve challenges in photonics, both for understanding the light source and for realizing suitable ultrafast measurement devices. Generation of light for users is performed by using electron bunches in the subnanosecond to picosecond range, with high charge density. This density is so high that the light emitted by the electrons affects the dynamics of neighboring electrons in a dramatic way. In particular, this nonlinear collective effect leads to spontaneous formation of small-scale structures (in the sub-millimeter to centimeter range) in the longitudinal profile of electron bunches hight1997ar ; andersson2000coherent ; byrd2002.PhysRevLett.89.224801 ; abo2002.PhysRevLett.88.254801 ; takashima2005observation ; katoh2007coherent ; Karantzoulis2010300 ; muller2011metrology ; Feikes2011metrology ; cinque2011far ; shields2012.1742-6596-357-1-012037 ; evain2012.0295-5075-98-4-40006 ; mullerexperimentalapects ; barros2015characteristics ; roy.RSI.84.033102.2013 ; PhysRevLett.114.204801 ; steinmann2018continuous . This is known as the microbunching instability venturini2002.PhysRevLett.89.224802 ; stupakov2002.PhysRevSTAB.5.054402 ; byrd2002.PhysRevLett.89.224801 ; abo2002.PhysRevLett.88.254801 (see Figure 1) . This effect is conceptually close to the universal mechanisms of pattern formation in Nature cross1993.RevModPhys.65.851 due to interaction between parts of the same system, such as the modulation instability in optical fibers tai1986observation ; tai1986observation , sand ripple formation induced by the wind or under the sea charru2013sand , or phantom traffic jams helbing2001traffic .
However, besides being a fascinating phenomenon of light and matter self-organization, latest generation light sources must systematically consider these collective effects for very practical reasons. Spontaneous formation of small-scale microstructures can have a deleterious effect on electron bunch stability and emission properties, and they are at the same time a tremendous source of coherent radiation in the terahertz domain byrd2002.PhysRevLett.89.224801 ; abo2002.PhysRevLett.88.254801 ; takashima2005observation ; katoh2007coherent ; Karantzoulis2010300 ; muller2011metrology ; Feikes2011metrology ; cinque2011far ; shields2012.1742-6596-357-1-012037 ; evain2012.0295-5075-98-4-40006 ; mullerexperimentalapects ; barros2015characteristics ; roy.RSI.84.033102.2013 ; PhysRevLett.114.204801 ; steinmann2018continuous , provided the instability can be mastered. This is the reason why understanding and controlling the interplay between Coherent Synchrotron Radiation (CSR) and the microbunching instability has nowadays become a central open question in the development of synchrotron radiation facilities.
To answer this question, it is essential to develop ultrafast photonic devices for electron bunch shape characterization. The challenges for the photonics community is high, given the need for ultrashort (picosecond or femtosecond) temporal resolution, single-shot operation, at high repetition rates (MHz and more), and given the particularly challenging environment near relativistic electron bunches. Recent advances consequently pushed photonics systems beyond the state of the art. Ultrafast electric-field measurement techniques using femtosecond laser pulses (electro-optic sampling EOS_first_spectral_encoding ) have allowed single-shot bunch shape measurement PhysRevLett.88.124801 , and these techniques have then been extensively investigated and improved this last decade casalbuoni2008numerical ; steffen2009electro ; schmidhammer2009single ; PhysRevSTAB.15.070701 ; szwaj2016high . As these techniques require compact femtosecond lasers, this also motivated a specific work on fiber-based sources, using parabolic pulse amplification tamura1996pulse ; fermann2000self . This even led to new record spectral widths for parabolic pulse amplifiers feurer2009ytterbium .
Ultrafast diagnostics also recently started to use strategies from the emerging field of ”photonic hardware accelerators” jalali2015tailoring , which aims at increasing the speed of electronic devices by combining them with specially designed photonic front-ends. In particular photonic time-stretch analog to digital converters mahjoubfar2017time ; time_stretch_first_bhushan1998time opened the way to the realization of “single-shot terahertz oscilloscopes” mahjoubfar2017time ; roussel2015.EOS ; kobayashi2016high ; szwaj2016high ; evain2017direct providing up to tens of million traces per second.
The availability of new ultrafast measurement systems led to several milestones in these storage ring investigations. Pioneer experiments using a streak camera could visualize microstructures in the several GHz range at the VUV ring kramermicrowave . More recently, electron bunch shapes have been indirectly characterized in single-shot by using new detectors based on thin films of superconducting YBCO uvsor_MBI_ybco , and high repetition rate electro-optic sampling, using photonic time-stretch roussel2015.EOS . Although this progress enabled to record structures in single-shot up to the THz range, the obtained information concerned only the far-field (i.e., the synchrotron radiation) emitted by the microstructures kramermicrowave ; roussel2015.EOS ; evain2017direct .
In this article, we present a photonic system that enables to observe microstructures and their evolution in a direct way, by monitoring the electric field in the immediate vicinity of the electrons.
Results
Experimental strategy
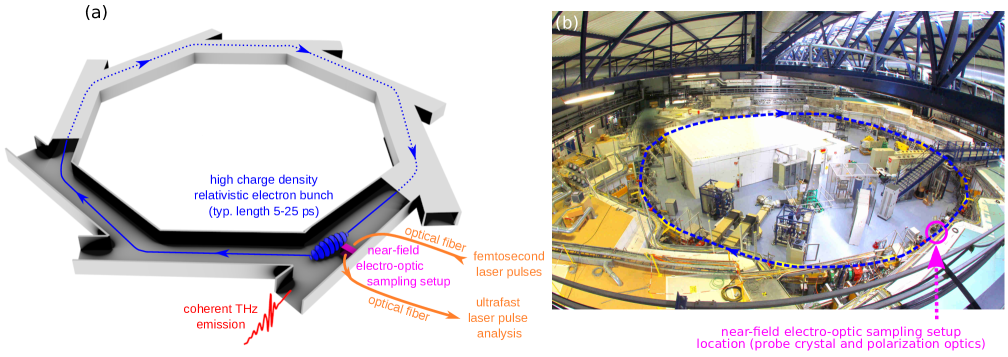
Recording bunch shapes in a non-destructive way required two open problems to be solved. The first one consisted in probing the electric field by approaching an electro-optic crystal at few millimeters from the relativistic electron bunch (Figure 2), without losing the electron bunch or damaging the crystal. By carefully designing the experimental setup ANKA.EOS.IPAC13 ; thesis_hiller , we could demonstrate the possibility to operate the synchrotron facility with an electro-optic crystal at 2-18 millimeters from the electron bunch. This pioneer experiment at the ANKA (now KArlsruhe Research Accelerator – KARA) storage ring thus opened the way to real-time investigations of storage ring electron bunch shapes, under the condition that a suitable photonic ultrafast readout system can be designed.
Optical readout of the crystal birefringence versus time was the second key problem as measurements had to be be performed: (i) in single-shot, (ii) with picosecond or sub-picosecond resolution, (iii) at several MHz acquisition rate. Moreover this ultrafast readout needs to be performed with an important dynamical range because the fast microstructures are expected to appear as a small modulation superimposed on a large slowly-varying background (see Figure 1c). At KARA, we have been exploring two directions in parallel. We have been developing a new generation of fast linear cameras (KALYPSO) with multi-MHz acquisition rates rota2018kalypso ; kalypso_microstructures_first ; kehrer2018synchronous ; funkner2018high . In parallel, we have been developing a second direction consisting in using the so-called photonic time-stretch strategy time_stretch_first_bhushan1998time ; mahjoubfar2017time . The latter strategy allows up to tens of MHz acquisition rate, using an association of commercial detectors and electronics. The results presented in this article are obtained with this strategy.
Photonic time-stretch Analog-to-Digital Converter
The photonic time-stretch digitizer setup is represented in Figure 3. The optical front-end combines two parts. A single-shot electro-optic sampling (EOS) system ANKA.EOS.IPAC13 imprints the electric field shape onto a chirped laser pulse EOS_first_spectral_encoding ; PhysRevLett.88.124801 . Then, the laser pulse exiting the EOS system is stretched in a 2 km dispersive fiber, so that the picosecond information is temporally stretched to the nanosecond range, and can be recorded using a photodetector and a conventional oscilloscope (5 GHz bandwidth is typically used here, see Methods). If we start from a compressed laser pulse, the output signal should be a replica of the ultrafast electric pulse, slowed-down by a factor time_stretch_first_bhushan1998time ; mahjoubfar2017time :
| (1) |
with and the lengths of fiber before and after the crystal (if the fibers are identical). Since an unknown amount of extra-dispersion is also present before the fiber of length , we also measured the stretch factor experimentally. We found , i.e., 1 nanosecond on the oscilloscope corresponds to a real duration of ps at the input for all results presented hereafter.
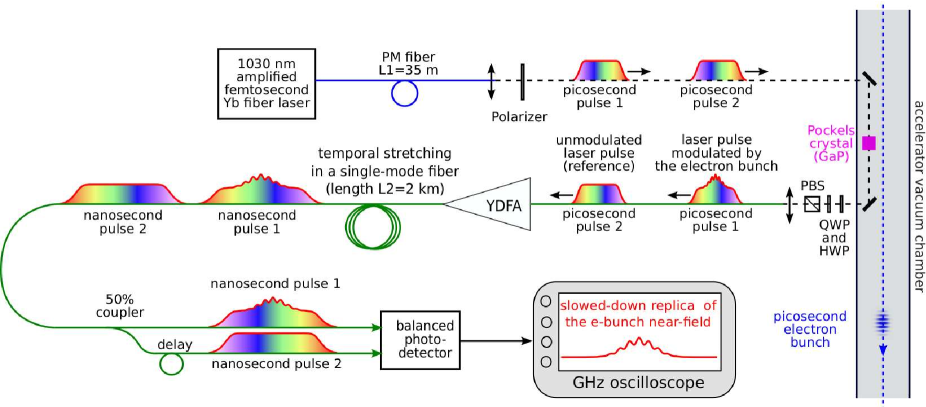
In order to increase the signal-to-noise ratio (and thus the dynamic range), we combined the amplified photonic time-stretch strategy solli2008amplified , with a balanced detection technique. The signal is amplified using a home-made ytterbium-doped fiber amplifier before entering the 2 km fiber. Moreover, at each electron bunch passage, three laser pulses are sent into the system (only one of the pulses being modulated by the electron bunch). The modulated pulse and a reference pulse are subtracted at the analog level, using a balanced photodetector (see Figure 3). Furthermore, the second reference pulse allows a dark reference to be available at the data analysis stage (see Methods section and supplementary material).
Simultaneous measurement of electron bunch shapes and resulting coherent radiation emission
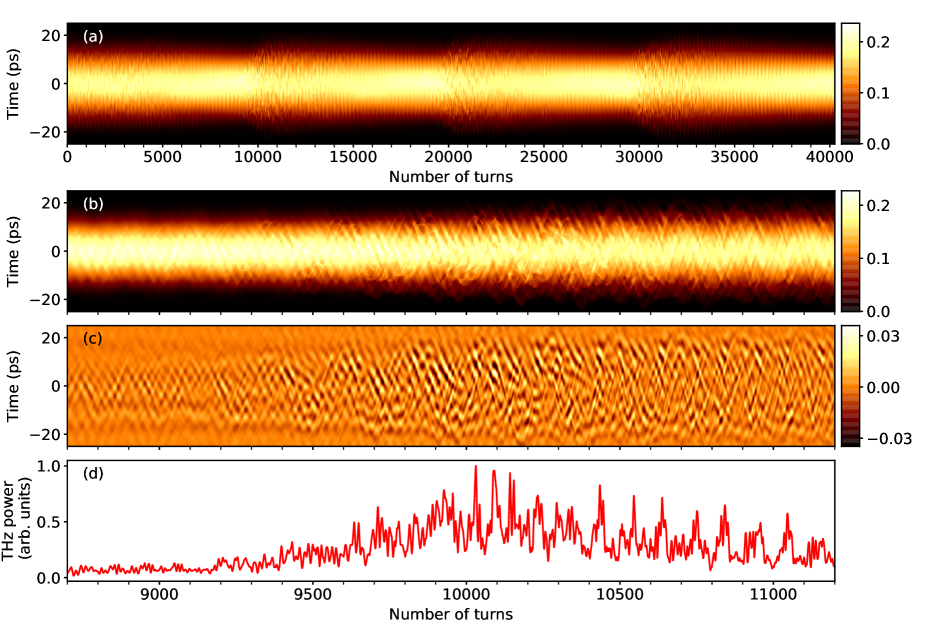
A typical single-shot electro-optic signal is represented in Figure 4a. The data correspond to the longitudinal density profile of the electron bunch (or more precisely to the electric field in its vicinity, see Methods and supplementary material). Detailed analysis reveals two components. As expected, a slowly-varying shape is systematically observed, whose width is of the order of the electron bunch size. When the electron bunch is “compressed” below a threshold size (technically, by decreasing the momentum compaction factor of the storage ring), a fast modulation appears on the electro-optic sampling signal.
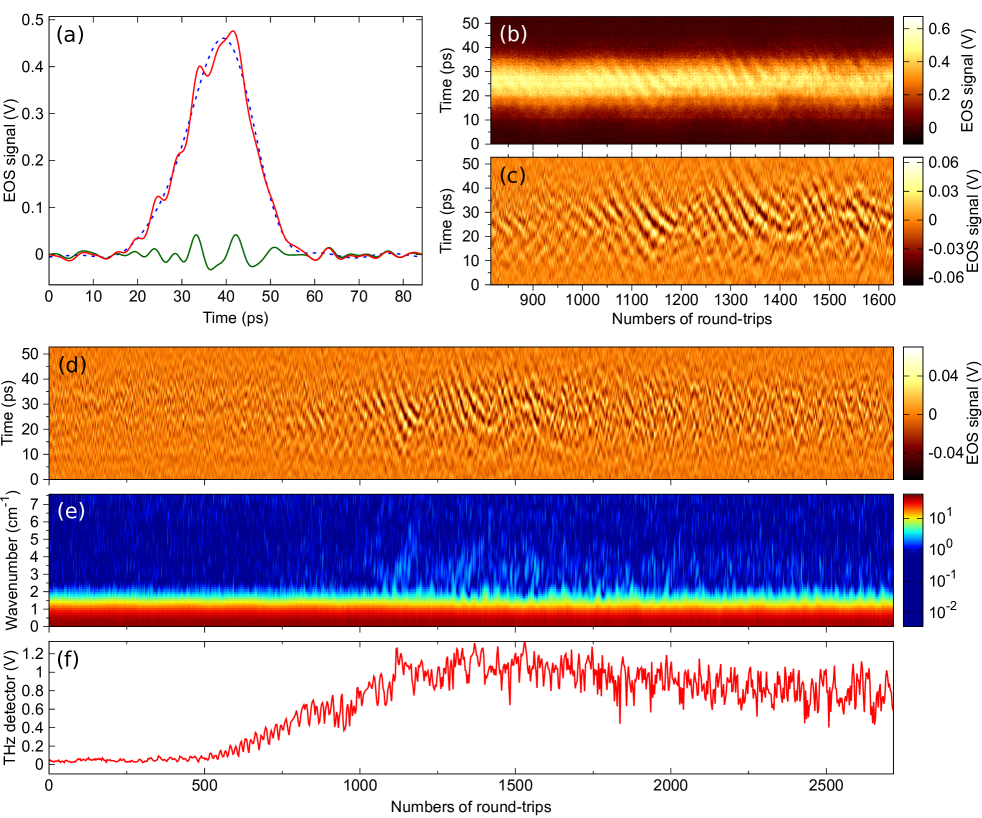
In order to conclude non-ambiguously that this structure corresponds to the microbunching instability, we represented the data as a function of the revolution number (Figs. 4b,c,d). High-pass filtered data reveal that the rapidly evolving structure occurs in bursts (Figs. 4c), and their space-time evolutions (Figs. 4b) present a characteristic pattern. As we will see, this will be a central point for comparing data with theory.
Since the electro-optic sampling is performed at each turn in the storage ring, it is possible to examine the correlation of the spontaneous microstructure formation, with the appearance of coherent synchrotron radiation. In Figure 4f we have plotted the data over a long time range, together with the signal synchronously recorded with a millimeter-wave diode detector placed at our infrared beamline. We can clearly see the correlation between the occurence of a burst of CSR, and the growth of the microstructure. This correlation was systematically observed in the recorded data.
Discussion
These new data sets can be compared to existing models of electron bunch dynamics. The physics of the electron bunch evolution involves essentially three ingredients: (i) acceleration and energy losses at each turn, (ii) interaction of each electron with the field created by the whole electron bunch distribution, (iii) and the relation between their energy and the revolution time in the storage-ring. The evolution equation for the distribution of the electrons in phase space may be written in the form of a Vlasov-Fokker-Planck equation venturini2002.PhysRevLett.89.224802 ; stupakov2002.PhysRevSTAB.5.054402 :
| (2) |
where is the distribution of the electrons at time in phase space . is a continuous and dimensionless variable associated to the number of turns in the storage ring: , where is the time (in seconds) and is the synchrotron frequency (here in the tens of kilohertz range). The longitudinal position and relative momentum are the deviation from the so-called synchronous electron (with position and energy ). and are expressed in units of the equilibrium bunch length and energy spread at zero current. corresponds to field created by the whole bunch at the location . We use here only shielded CSR impedance. Details are given in the Methods section.
In Figure 5, we have represented the simulated evolution of the electron bunch shape versus number of turns in the storage ring. We can see that this type of representation can be used directly for performing severe tests of theoretical model versus experimental data. In our case, we can see that the model can reproduce part of the spatio-temporal features, as e.g., structures moving towards the bunch head, and bunch tail. Evolution versus number of turns also reveals interesting discrepancies between model predictions and experimental data. These types of measurements should allow in due course to refine the models of the wakefiels created by each electron (whose Fourier transform is known as the machine impedance).
In conclusion, we present a strategy enabling a simultaneous measurement of the “shape” of electron bunches in a non-destructive manner at each turn in a storage ring, by monitoring their electric fields. This new measurement possibility enables to directly observe the correlation, at each turn, between the charge modulation and the underlying coherent synchrotron radiation emission, and was predicted for storage rings more than a decade ago stupakov2002.PhysRevSTAB.5.054402 ; venturini2002.PhysRevLett.89.224802 . This type of strategy will enable to start very stringent tests of theoretical models of relativistic electron bunch dynamics, that were not possible before. We believe that this direct access to the microbuching instability and coherent synchrotron radiation properties may provide an important milestone on the way to master the instabilities, either for suppressing them, or make them usable as a stable source of THz radiation.
In a general way, needs for electron bunch shape diagnostics are expected to address challenging questions to the photonic community. An important (and related) open question concern the non-destructive characterization of electric field oscillations, when the time-scales are in the few to tens of microns range. This is an important question for studies of microbunching instabilities in lastest generation Free-Electron Lasers, and would require to perform single-shot electro-optic sampling of mid-infrared pulses. This may represent one of the next milestones in the development of photonic systems destined to relativistic electron bunch characterization.
Methods
Laser system
The 1030 nm probe pulses are produced by a mode-locked ytterbium-doped fiber laser, operating at 62.5 MHz, and synchronized on the RF reference of the KARA storage ring. An acousto-optic pulse picker selects 3 pulses per turn in the storage ring. The pulses are compressed and then amplified in a polarization-maintaining ytterbium-doped fiber parabolic pulse amplifier thesis_hiller . The output pulses have a typical bandwidth of 80 nm FWHM.
Near-field electro-optic sampling setup
The laser pulses are then transported in a 35 m-long polarization maintaining fiber to the electro-optic measurement system installed in the storage ring. Thanks to a Treacy compressor placed before the fiber, output pulses can be adjusted in the few tens of ps range. The electro-optic sampling is performed by an 5 mm-long GaP crystal placed inside the vacuum chamber, above the electron beam. The crystal can be moved towards the electron beam orbit and was placed – for the data shown – at a distance of mm from the electron bunch. The quarter-wave plate and half-wave plate (see Figure 3) are adjusted so that the system is operated near extinction jiang1999electro ; PhysRevSTAB.15.070701 , in order to obtain high sensitivity. The light exiting the low-power port of the beam-splitter is injected in a single-mode fiber and transported back for analysis in the remote photonic analysis station (placed outside of the storage ring shielding).
Amplified photonic time stretch system
The modulated chirped laser pulses are first amplified using a home-made ytterbium-doped fiber preamplifier, and then stretched by propagation in a 2 km-long single-mode fiber (Corning HI 1060). The fiber’s output is then split using a thin-film 3 dB splitter (see Figure 3), and the two ports are delayed by exactly one repetition period of the mode-locked laser (16 ns). Thus a reference (i.e., unmodulated) laser pulse is subtracted from the laser pulse which carries the ultrafast modulation using the balanced photodetector. The balanced photodetector is an InGaAs amplified photoreceiever (DSC-R412 from Discovery Semiconductors), with a 20 GHz bandwidth. The photoreceiver specifications for gain and noise are 2800 V/W and 40 pW/ (both being specified at 1550 nm). The precise delay and relative power levels between the two photodetector inputs are adjusted using an adjustable delay line and a variable optical attenuator. Data are recorded using a Lecroy Labmaster 10 Zi oscilloscope (with an – overdimensioned – 30 GHz bandwidth and 80 Gs/s acquisition rate), and the acquired data are numerically low-passed filtered at 5 GHz before signal analysis (corresponding to 380 GHz at the electro-optic crystal location).
Each recorded pulse is a replica of the electric field in the near-field of the electron bunch, which is “stretched in time” by a factor . In other words, 1 ns at oscilloscope input corresponds to 13.2 ps at the electro-optic crystal. The oscilloscope’s 80 gigasamples/s acquisition rate corresponds to an effective sampling rate of 6.06 terasamples/s. The post-processing filtering to 5 GHz corresponds to an input analog bandwidth limitation of 380 GHz.
Data processing
At each turn in the storage ring, three consecutive pulses are emitted by the laser, and only the last one interacts with the electron bunch near-field. Thus, at turn , the balanced detector signal contains four pulses: (i) the raw balanced EOS signal , (ii) a reference balanced signal without EOS modulation , and two saturated pulses corresponding to unbalanced pulses (see supplementary Figures 1-2). The EOS signal represented here corresponds to . The spectra of the EOS signal (as in Figure 4e) show that a reasonable signal-to-noise ratio is observed up to 5 GHz bandwidth (i.e., 380 GHz at input). Hence raw data were first low-pass filtered at 5 GHz, before data analysis (i.e., a 5 GHz oscilloscope would be sufficient for the present recording). Then we proceeded to further filtering for examining the different parts of the spectra. In particular, high frequency structures of Figs. 4c,d (and the green curve in Fig. 4a) are obtained by filtering the data in the 1.19 GHz-3.30 GHz band (i.e., 90-250 GHz at the input). Unfiltered data are represented in Fig. 4b.
The electro-optic sampling signals (as represented in Fig. 4a-e) hence represent the electric field evolution, multiplied by the laser pulse shape, (see Supplementary material for the signal details).
Coherent sychrotron radiation analysis
The THz pulses are detected at KARA’s IR1 infrared beamline, using an amplified 140-220 GHz Schotty barrier diode detectector (Virginia Diodes Inc. WR5.1ZBD) connected to a 6 GHz oscilloscope (Lecroy SDA760ZI-A). Figure 4e represents the recorded detector pulse height versus revolution number.
Accelerator parameters
The results presented in this article are performed in single bunch operation, at GeV energy, for a current mA, an acceleration voltage of kV and a momentum compaction factor of . The storage ring revolution frequency is 2.716 MHz.
Numerical simulations
Numerical simulations have been performed using the semi-Lagrangian scheme warnock_scheme_book , and the shielded CSR wakefield as in Refs. uvsor_MBI_ybco ; uvsor_MBI_ybco ; roussel2015.EOS . Calculations have been made and cross-checked using two independently developed codes. One code is a parallel implementation of the Warnock scheme warnock_scheme_book using MPI (Message Passing Interface), and the other code is INOVESA which has been developed by the KIT group schonfeldt2017parallelized . Figure 5 is provided by the first code, parameters are summarized in the Supplementary material.
Data availability
The data that support the findings of this study are available from the corresponding author upon reasonable request.
Acknowledgments
This work has been supported by the German Federal Ministry of Education and Research (contract no. 05K16VKA) and by the Initiative and Networking Fund of the Helmholtz Association (contract no. VH-NG-320). On the PhLAM side, the work has been supported by the Ministry of Higher Education and Research, Nord-Pas de Calais Regional Council and European Regional Development Fund (ERDF) through the Contrat de Projets État-Région (CPER photonics for society), and the LABEX CEMPI project (ANR-11- LABX-0007). This work was performed using HPC resources from GENCI-IDRIS (Grants i2015057057, i2016057057, A0040507057).
Author contributions
Main project management has been peformed by ASM. The association of the EOS system with photonic time-stretch has been developed by NH, EBlo, SF, EBru, MJN, GN, PS, MS, JLS, SW, and ASM on the EOS side. The amplified time-stretch readout has been developed by CE, ER, CS, SB. Time-stretch data analysis has been performed by CS and CE. Measurement of the THz radiation has been performed by JLS and MB. EBlo and MS prepared the KARA fill with low-alpha optics. Numerical simulations have been performed by EBur, PS, CE, SB, and simulation code development by ER, CE, SB (MPI implementation of the Warnock scheme), and PS (INOVESA code). All authors participated in the manuscript redaction.
Competing Interests
The authors have no competing interests as defined by Nature Research, or other interests that might be perceived to influence the results and/or discussion reported in this paper.
References
- (1) Hight-Walker, A., Arp, U., Fraser, G., Lucatorto, T. & Wen, J. New infrared beamline at the NIST SURF II storage ring. Proc. SPIE Int. Soc. Opt. Eng. 3153, 40 (1997).
- (2) Andersson, A., Johnson, M. S. & Nelander, B. Coherent synchrotron radiation in the far-infrared from a 1 mm electron bunch. Optical Engineering 39, 3099–3106 (2000).
- (3) Byrd, J. M. et al. Observation of Broadband Self-Amplified Spontaneous Coherent Terahertz Synchrotron Radiation in a Storage Ring. Phys. Rev. Lett. 89, 224801 (2002).
- (4) Abo-Bakr, M., Feikes, J., Holldack, K., Wüstefeld, G. & Hübers, H.-W. Steady-State Far-Infrared Coherent Synchrotron Radiation detected at BESSY II. Phys. Rev. Lett. 88, 254801 (2002).
- (5) Takashima, Y. et al. Observation of intense bursts of terahertz synchrotron radiation at uvsor-ii. Japanese journal of applied physics 44, L1131 (2005).
- (6) Katoh, M. et al. Coherent Terahertz Radiation at UVSOR-II. In AIP Conference Proceedings, vol. 879, 71–74 (AIP, 2007).
- (7) Karantzoulis, E., Penco, G., Perucchi, A. & Lupi, S. Characterization of coherent THz radiation bursting regime at ELETTRA. Infrared Physics and Technology 53, 300 (2010).
- (8) Müller, R. et al. The Metrology Light Source of PTB–a source for THz radiation. Journal of Infrared, Millimeter, and Terahertz Waves 32, 742–753 (2011).
- (9) Feikes, J. et al. Metrology Light Source: The first electron storage ring optimized for generating coherent THz radiation. Physical Review Special Topics-Accelerators and Beams 14, 030705 (2011).
- (10) Cinque, G., Frogley, M. D. & Bartolini, R. Far-IR/THz spectral characterization of the coherent synchrotron radiation emission at diamond IR beamline B22. Rendiconti Lincei 22, 33–47 (2011).
- (11) Shields, W. et al. Microbunch Instability Observations from a THz Detector at Diamond Light Source. Journal of Physics: Conference Series 357, 012037 (2012).
- (12) Evain, C. et al. Spatio-temporal dynamics of relativistic electron bunches during the micro-bunching instability in storage rings. EPL 98, 40006 (2012).
- (13) Müller, A. S. et al. Experimental Aspects of CSR in the ANKA Storage Ring. ICFA Beam Dynamics Newsletter 57, 154 (2012).
- (14) Barros, J. et al. Characteristics and development of the coherent synchrotron radiation sources for THz spectroscopy. Journal of Molecular Spectroscopy 315, 3–9 (2015).
- (15) Barros, J. et al. Coherent synchrotron radiation for broadband terahertz spectroscopy. Review of Scientific Instruments 84, 033102 (2013).
- (16) Billinghurst, B. E. et al. Observation of Wakefields and Resonances in Coherent Synchrotron Radiation. Phys. Rev. Lett. 114, 204801 (2015). URL http://link.aps.org/doi/10.1103/PhysRevLett.114.204801.
- (17) Steinmann, J. L. et al. Continuous bunch-by-bunch spectroscopic investigation of the microbunching instability. Physical Review Accelerators and Beams 21, 110705 (2018).
- (18) Venturini, M. & Warnock, R. Bursts of Coherent Synchrotron Radiation in Electron Storage Rings: A Dynamical Model. Phys. Rev. Lett. 89, 224802 (2002).
- (19) Stupakov, G. & Heifets, S. Beam instability and microbunching due to coherent synchrotron radiation. Phys. Rev. ST Accel. Beams 5, 054402 (2002).
- (20) Cross, M. C. & Hohenberg, P. C. Pattern formation outside of equilibrium. Rev. Mod. Phys. 65, 851–1112 (1993).
- (21) Tai, K., Hasegawa, A. & Tomita, A. Observation of modulational instability in optical fibers. Physical review letters 56, 135 (1986).
- (22) Charru, F., Andreotti, B. & Claudin, P. Sand ripples and dunes. Annual Review of Fluid Mechanics 45, 469–493 (2013).
- (23) Helbing, D. Traffic and related self-driven many-particle systems. Reviews of modern physics 73, 1067 (2001).
- (24) Jiang, Z. & Zhang, X.-C. Electro-optic measurement of THz field pulses with a chirped optical beam. Appl. Phys. Letters 72, 1945 (1998).
- (25) Wilke, I. et al. Single-Shot Electron-Beam Bunch Length Measurements. Phys. Rev. Lett. 88, 124801 (2002).
- (26) Casalbuoni, S. et al. Numerical studies on the electro-optic detection of femtosecond electron bunches. Physical Review Special Topics-Accelerators and Beams 11, 072802 (2008).
- (27) Steffen, B. et al. Electro-optic time profile monitors for femtosecond electron bunches at the soft x-ray free-electron laser FLASH. Physical Review Special Topics-Accelerators and Beams 12, 032802 (2009).
- (28) Schmidhammer, U., De Waele, V., Marques, J.-R., Bourgeois, N. & Mostafavi, M. Single shot linear detection of 0.01–10 THz electromagnetic fields. Applied Physics B 94, 95 (2009).
- (29) Müller, F. et al. Electro-optical measurement of sub-ps structures in low charge electron bunches. Phys. Rev. ST Accel. Beams 15, 070701 (2012).
- (30) Szwaj, C. et al. High sensitivity photonic time-stretch electro-optic sampling of terahertz pulses. Review of Scientific Instruments 87, 103111 (2016).
- (31) Tamura, K. & Nakazawa, M. Pulse compression by nonlinear pulse evolution with reduced optical wave breaking in erbium-doped fiber amplifiers. Optics letters 21, 68–70 (1996).
- (32) Fermann, M., Kruglov, V., Thomsen, B., Dudley, J. & Harvey, J. Self-similar propagation and amplification of parabolic pulses in optical fibers. Physical Review Letters 84, 6010 (2000).
- (33) Muller, F. et al. Ytterbium fiber laser for electro-optical pulse length measurements at the SwissFEL. Proceedings of DIPAC09, TUPD31 (2009).
- (34) Jalali, B. & Mahjoubfar, A. Tailoring wideband signals with a photonic hardware accelerator. Proceedings of the IEEE 103, 1071–1086 (2015).
- (35) Mahjoubfar, A. et al. Time stretch and its applications. Nature Photonics 11, 341–351 (2017).
- (36) Bhushan, A., Coppinger, F. & Jalali, B. Time-stretched analogue-to-digital conversion. Electronics Letters 34, 1081–1083 (1998).
- (37) Roussel, E. et al. Observing microscopic structures of a relativistic object using a time-stretch strategy. Scientific Reports 5 (2015).
- (38) Kobayashi, M. et al. High-Acquisition-Rate Single-Shot Pump-Probe Measurements Using Time-Stretching Method. Scientific reports 6, 37614 (2016).
- (39) Evain, C. et al. Direct observation of spatiotemporal dynamics of short electron bunches in storage rings. Physical Review Letters 118, 054801 (2017).
- (40) Kramer, S., Carr, G. & Podobedov, B. Microwave Emission Measurements from the Electron Beam in the VUV Ring. NSLS activity report (2001).
- (41) Roussel, E. et al. Microbunching Instability in Relativistic Electron Bunches: Direct Observations of the Microstructures Using Ultrafast YBCO Detectors. Phys. Rev. Lett. 113, 094801 (2014).
- (42) Hiller, N. et al. A. In Proceedings of the 2013 Particle Accelerator Conference, Shanghai, China, MOPME014 (2013).
- (43) Hiller, N. “Electro-Optical Bunch Length Measurements at the ANKA Storage Ring”, PhD thesis, KIT, 2013.
- (44) Rota, L. et al. KALYPSO: Linear array detector for high-repetition rate and real-time beam diagnostics. To appear in Nuclear Instruments and Methods in Physics Research Section A (2018).
- (45) Rota, L. et al. KALYPSO: A Mfps linear array detector for visible to near radiation. Proceedings of IBIC, WEPG46 (2016).
- (46) Kehrer, B. et al. Synchronous detection of longitudinal and transverse bunch signals at a storage ring. Physical Review Accelerators and Beams 21, 102803 (2018).
- (47) Funkner, S. et al. High throughput data streaming of individual longitudinal electron bunch profiles in a storage ring with single-shot electro-optical sampling. arXiv preprint arXiv:1809.07530 (2018).
- (48) Solli, D., Chou, J. & Jalali, B. Amplified wavelength–time transformation for real-time spectroscopy. Nature Photonics 2, 48–51 (2008).
- (49) Jiang, Z., Sun, F., Chen, Q. & Zhang, X.-C. Electro-optic sampling near zero optical transmission point. Applied physics letters 74, 1191–1193 (1999).
- (50) Warnock, R. & Ellison, J. In Proceedings of the 2nd ICFA advanced accelerator workshop, The physics of high brightness beams, World Scientific, Singapore, 322 (2000).
- (51) Schönfeldt, P., Brosi, M., Schwarz, M., Steinmann, J. L. & Müller, A.-S. Parallelized Vlasov-Fokker-Planck solver for desktop personal computers. Physical Review Accelerators and Beams 20, 030704 (2017).