Who Watches the Watchmen:
Exploring Complaints on the Web
Abstract.
Under increasing scrutiny, many web companies now offer bespoke mechanisms allowing any third party to file complaints (e.g., requesting the de-listing of a URL from a search engine). While this self-regulation might be a valuable web governance tool, it places huge responsibility within the hands of these organisations that demands close examination. We present the first large-scale study of web complaints (over 1 billion URLs). We find a range of complainants, largely focused on copyright enforcement. Whereas the majority of organisations are occasional users of the complaint system, we find a number of bulk senders specialised in targeting specific types of domain. We identify a series of trends and patterns amongst both the domains and complainants. By inspecting the availability of the domains, we also observe that a sizeable portion go offline shortly after complaints are generated. This paper sheds critical light on how complaints are issued, who they pertain to and which domains go offline after complaints are issued.
1. Introduction
The web has proven a powerful platform for the large-scale distribution of content. Notoriously difficult to regulate, individual web organisations have been frequently left to decide how to best handle issues related to legal, regulatory and even moral matters, e.g., moderation of online discourse, removal of copyright infringing content, mitigation of online harassment. This has generated significant societal attention, with major companies like Google and Twitter coming under increasing public scrutiny (Giannoumis, 2014; Stiegler, 2013). Consequently, large web organisations have begun to implement bespoke mechanisms to allow third parties to register complaints. For example, Google’s complaint system allows anybody to issue notices requesting the removal of specific results from their search listings, whereas Twitter enables users to report posts they believe to be infringing policy (e.g., because of bot activity (gilani2017bots)). Although a valuable tool in the wider landscape of web governance, this places considerable responsibility within the hands of these organisations, who must decide which complaints are legitimate and how they should be dealt with (often referred to as self regulation (Urist, 2006)). Yet, to date, we have little evidence regarding how these complaint procedures are handled, how successful they are, or who they are targeted against and by whom.
We argue that the scale of these complaints and their impact on the wider society’s perception of the web, warrant detailed investigation. There are multiple interesting questions, such as who generates complaints? Whom do these complaints pertain to? What are the characteristics of domains that receive complaints? Does content remain online after complaints? With these questions in mind, this paper presents a large-scale study of web complaints. Building on past work within the legal domain (Urban et al., 2016; Urban and Quilter, 2005; Seng, 2014), we have gathered complaints from hundreds of transparency reports made available by organisations including Google, Vimeo, Bing and Twitter, and reflected in the Lumen database (§2). These reports expose detailed information about web complaints covering over 1 billion URLs ranging from copyright infringement to governmental notices.
We start our analysis by characterising the nature and scale of organisations that generate notices (complainants). Despite the presence of numerous complaint categories, copyright notices largely dominate, with 98.6% of all complaints (§3.1). A critical minority of organisations play a remarkably prominent role in this, with the top 10 alone contributing 41% of all notices sent (§3.2). Our analysis reveals that the majority of notices are generated by large content-based organisations (e.g., NBC, Fox). Despite this, we find that the majority of notice senders are occasional users of the complaint system: 94% of complainants issue fewer than 100 notices. These different groups tend to rely on different types of complaints. For example, large copyright enforcers (e.g., Rivendell) generate millions of copyright notices, whereas governmental agencies (e.g., Roskomnadzor) issue a far smaller set of targeted court and governmental notices. This leads us to focus on the categories of websites that these different types of notices pertain to (§3.3). We find that notices are heavily biased towards certain types of website. For example, websites categorised as ‘File Sharing’ and ‘Elevated Exposure’ are hugely over-represented amongst our complaint dataset. Similarly, individual notice senders tend to target specific topics, e.g., 60% of complaints by Cam Model Protection target adult websites, whereas 55% by NBCUniversal target Entertainment, shedding light on the priorities of organisations utilising the complaint services.
This leads us to investigate if equivalent dynamism exists on the part of the reported websites themselves (§4). We find that a small (and constantly evolving) set of websites dominate the ranking of the most reported, with a few domains that remain prominent throughout our entire measurement period: the top 1% of domains accumulate 63% of complaints (§4.1). These include many obscure websites, which are unlikely to be widely known, e.g., 22 out of the top 30 most frequently reported websites are not even in the Alexa Top 100K, and the correlation between the popularity of domains in terms of notices and Alexa rank is just 0.13. Deeper analysis reveals that these trends are dictated by the activity of a small set of extremely aggressive notice senders (§4.3), whose ‘bursty’ behaviour creates high levels of instability.
We finally inspect the availability of the webpages that are complained about, with the conjecture that websites receiving many complaints may be more likely to go offline (§4.4). We confirm that many are highly ephemeral: 22% of all domain names soon get taken offline (NXDOMAIN), whereas our HTTP liveness checks show that a further 19% of all resources fail to return 200 OK responses within 1 week of a complaint. We correlate these with a number of factors to find that the ‘success’ rate of complainants differs dramatically, with the most successful (Rivendell) seeing 55% of its complaints acted upon in contrast to others complainants where the figure is below 1%. The published version of this report is available at (ibosiola2019watches).
2. Methodology & Dataset
This section presents our data collection methodology. This has two goals: (i) To provide vantage into a broad set of web complaints, covering enough domains to provide meaningful insight; and (ii) To annotate these complaints with sufficient metadata to shed light on domain activities and topics.
2.1. Website Complaints
First, we detail our methodology for gathering complaints issued about websites. Naturally, it is impossible to get complaints issued to all websites, because the vast majority do not make this information available. Hence, we focus on sites that expose transparency reports, e.g., Bing, Twitter, Google, Vimeo. These reports list complaints received by the organisations, including relevant metadata. To gather these, we utilise Lumen111https://lumendatabase.org/ — a database run by the Berkman Klein Center for Internet & Society. It aggregates and publishes transparency report data pertaining to complaints issued towards 223 organisations. The exact purpose of each complaint differs, e.g., a complaint to Bing will normally request the removal of search results, whilst complaints to Vimeo will concern the removal of videos. However, each notice (i.e., complaint) includes the following standard fields:
-
•
Notice Type: the category of notice which has been reported. For example, a Digital Millennium Copyright Act (DMCA), trademark or data protection etc.
-
•
Notice Sender: or complainant, is the organisation who submitted the notice.
-
•
Notice Recipient: the web publisher or service provider where the infringing notice is sent to.
-
•
Notice Principal: in cases of a copyright-related notice, this is the person or organisation that holds the copyright on the content reported.
-
•
Infringing URL(s): the list of URL(s) that the notice sender is requesting to be dealt with. Note that this is not necessarily a set of URLs owned by the recipient, e.g., Bing may receive complaints requesting the removal of a third-party URL from its search results.
We collected all complaints from the Lumen database between 01/01/2017 and 31/12/2017 using their API. In total, we extract 1,054,248,823 URL complaints from 38,523 notice senders.
2.2. Website Metadata
Once we extract the reported URLs, we compile further metadata. This section explains the metadata collected.
Website Categorisation. We classify each domain using the VirusTotal API.222https://www.virustotal.com/ This API has been used in a wide set of research, and is known to provide good accuracy (Kim et al., 2015; Wang et al., 2017; Ikram et al., 2019). The API provides a classification for each domain in our dataset, e.g., games, education, file sharing, blogs etc. We later use this to understand the types of complaints generated. Due to the usage limitations of the API, we only categorise the top 240K domains with the most reported URLs. Note that 22% of these could not be categorised by VirusTotal. We further annotate each domain with its Alexa ranking to gain insight into its global popularity.
DNS Probes. We utilise the Domain Name Service (DNS) to map the domains to their respective DNS records on 29/07/2018. We performed queries (IPv4), which yield 849,023 responses and 206,863 IP addresses. We use this data to check if the domain name is still live.
Webpage Probes. For each URL, we download its HTML and parse it to extract all embedded domains. This allows us to identify mirrors of websites hosted on multiple domains/URLs, by comparing the HTML contents. Tests are performed from a university campus, where we have confirmed no web filtering is performed. In total, we collect the HTML structure for 770,737 webpages.
Liveness Checks. We also perform periodic checks on the domains and URLs to verify if the websites are still active (i.e., returning an HTTP 200 status code). This allows us to explore the potential efficacy of organisations seeking to remove content. Due to the sheer scale of the complaints (1 billion URLs), we only perform checks for 2M URLs complained about between 14/07/2018 to 17/07/2018. Upon recording a complaint from Lumen, we added its URL to a queue and began weekly checks that executed between 18/07/2018 to 14/08/2018. We record the HTML response and HTTP status code, alongside whether or not the TCP handshake timed out. Each week, we exclude URLs that have already been deleted.
2.3. Limitations & Ethical Considerations
We emphasise that Lumen only provides vantage into 223 complaint recipients, obviously a small fraction of the world’s online organisations. These consist primarily of: Google—79%, Bing–15.6%, Twitter–3.8%, Periscope–0.8% and Vimeo–0.4%. We do not assert that our findings generalise beyond these organisations, although the scale of these five companies indicates that the insights are highly valuable nevertheless. We should also highlight that our research covers websites that may participate in illegal activity (e.g., copyright infringement). We restrict this collection to downloading the webpage HTML and checking server liveness, ensuring that no measurements involve participating in a websites activities, e.g., registering user accounts or downloading content. Note that this may still result in advertisement revenue being generated by the website. Unfortunately, this was impossible to avoid considering the nature of our measurements. That said, we limit ourselves to accessing URLs a small number of times (), minimising any potential revenue.
3. complaints & Notice Senders
In this section, we investigate the senders and receivers of complaints. Specifically, we are interested in exploring who sends complaints and what they pertain to.
3.1. What Types of Complaints Exist?
We identify complaints from 38,523 unique senders, covering 1.05 Billion URLs, which are hosted across 1,090,173 domains. Individual complaints tend to contain multiple URLs, with an average of 560 URLs and 31 domains per notice. In terms of the types of notices, there is a remarkable skew towards DMCA complaints. This is partly driven by the prominence of search engine recipients within our data. Table 1 presents a breakdown of the types of complaints across the entire dataset. We find that DMCA notices make up 98.6% (1.05B URLs) of the dataset and a similar share of domains (97.8%). DMCA notices are a US-enforceable complaint which covers takedown notices for (allegedly) copyright infringing content. The senders largely appear to be third party organisations who act on behalf of the actual copyright owners: just 9% of notice senders listed are also the principal. This contrasts with a 2006 study (Urban and Quilter, 2005) where 98.5% of notices were sent by right owners, suggesting a shift in behaviour (as seen in (Urban et al., 2016)). Measured by frequency, DMCA notices are followed by Defamation (52K), Court Orders (29K) and Government Requests (2.7K), covering nearly a third of the recipients (31%). We also observe a number of less popular complaint types, such as Law Enforcement Requests, Data Protection and Trademark infringements. Whereas these make up less than 0.001% of the dataset, they cover more than 20% of the recipients.
|
|
|
|
|
|
||||||||||||
|---|---|---|---|---|---|---|---|---|---|---|---|---|---|---|---|---|---|
| DMCA | 98.6 | 99.99 | 94.46 | 99.87 | 97.78 | ||||||||||||
| Defamation | 0.95 | <0.01 | 0.15 | <0.01 | 1.50 | ||||||||||||
| Court Order | 0.19 | <0.01 | 4.87 | 0.07 | 0.41 | ||||||||||||
| Government Request | 0.15 | <0.01 | 0.15 | 0.02 | 0.13 | ||||||||||||
| Private Information | <0.01 | <0.01 | 0.071 | - | 0.003 | ||||||||||||
| Data Protection | <0.01 | <0.01 | - | - | ¡0.001 | ||||||||||||
| Law Enforcement Request | <0.01 | <0.01 | 0.02 | 0.03 | ¡0.001 | ||||||||||||
| Trademark | <0.01 | <0.01 | 0.02 | - | ¡0.001 | ||||||||||||
| Other | 0.08 | <0.01 | 0.26 | <0.01 | 0.16 | ||||||||||||
| Total | 1,885,267 | 1,054,248,823 | 38,523 | 20,686 | 1,090,173 |
3.2. Who Are the Notice Senders?
The previous section suggests that notice senders are more diverse than simply the owners of copyright material, and that different reporting practices coexist. To shed light on these aspects, we next inspect the entities behind the notices submitted. We find that the distribution of notices is highly skewed towards a few extremely active senders. The top 10% of notice senders report over 1 billion URLs, in stark contrast to just 550K by the bottom 90%.
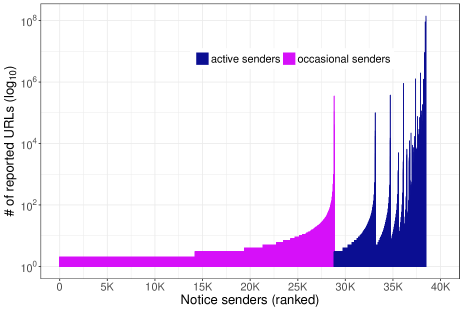
Figure 1 presents the number of reported URLs from each notice sender. The X-axis is sorted by two metrics: (i) the number of days that a sender generates notices on; and (ii) the number of notices sent (note that Y-axis is in log scale). The distribution is highly unbalanced, with a large majority of notice senders (94%) issuing fewer than 100 complaints. The figure reveals two broad categories of complainants: (i) active, who send complaints on multiple days and (ii) occasional, only generating notices on a single day. Whilst the active group represents just 25% of all complainants, it is responsible for almost all notices (99.92%). In contrast, the occasional senders, consisting of the remaining 75%, collectively contribute just 0.08% of the total number of complaints. It can also be observed that the curve in Figure 1 is not monotonic. This is because the number of notices issued each day can vary. Whereas occasional senders, by definition, only issue complaints on a single date, some send multiple notices. Although the daily average is just 1.4 notices, there are some occasional senders who send a large number of complaints in a single burst. For example, Idreto (an occasional sender) generated 350K notices on a single day. As a result, even occasional senders can have a significant impact on the overall ranking of reported domains.
We now inspect the types of complaints generated by these two groups of notice senders. Table 2 presents the top 10 complainants. Similar to the findings of (Seng, 2014; Urban et al., 2016), we find that active senders are dominated by copyright enforcement and trade organisations e.g., the British Phonographic Industry (BPI), Apdif Brasil, Apdif Mexico, etc. These organisations represent hundreds of music recording companies in their respective jurisdictions. Also within this group are copyright protection agencies such as Muso, Aiplex, Mark Monitor and Entura who specialise in tracking pirated content. These companies aggregate complaints from many different copyright holders, and act as enforcers on their behalf. This partly explains their broad coverage and ability to produce large volumes of complaints. In contrast, occasional senders are predominantly made up of small organisations and private entities. We see that the categories of Private Information and Trademark are particularly dominated by occasional notice senders, making up 94% and 70% respectively. Conversely, active senders hold sway among other notice types, i.e., DMCA. These striking differences between the categories of sender highly differing strategies based on the nature of the complaints, with the ability of a small hub of complainants to dominate the wider system.
|
|
|
|
|
||||||||||
|---|---|---|---|---|---|---|---|---|---|---|---|---|---|---|
| Rivendell | 13.17 | 1.65 | 4.97 | 357 | ||||||||||
| Aiplex | 9.76 | 1.88 | 1.30 | 364 | ||||||||||
| BPI | 8.60 | 2.52 | 2.72 | 355 | ||||||||||
| Apdif Mexico | 8.52 | 0.55 | 0.16 | 208 | ||||||||||
| Mg Premium | 7.77 | 0.47 | 0.49 | 341 | ||||||||||
| Apdif Brasil | 7.56 | 0.52 | 0.39 | 244 | ||||||||||
| Remove Your Media | 7.28 | 0.92 | 2.45 | 346 | ||||||||||
| Mark Monitor | 5.29 | 1.13 | 5.12 | 365 | ||||||||||
| Fox Group Legal | 4.36 | 0.14 | 2.26 | 355 | ||||||||||
| Protek Media, S.C. | 4.20 | 0.31 | 0.67 | 365 | ||||||||||
| Total | 806,358,505 | 188,158 | 224,076 |
3.3. What Topics Do Complaints Target?
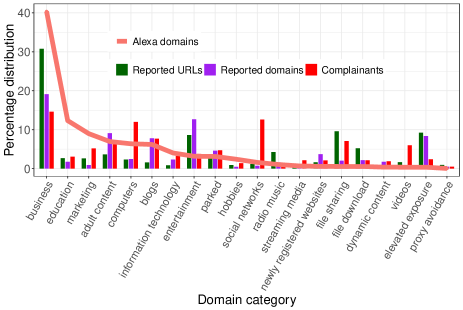
To better understand the main drivers behind the complaints, we investigate which categories of websites notices senders complain about. Figure 2 presents the percentage breakdown of complaints, domains and complainants based on the reported domain category. Although it is clear that these classifications contain noise, we believe they offer useful insight into wider activity. To better understand how this relates to the general web ecosystem, we also depict the distribution of the Alexa Top 100K websites.
There is a remarkable divergence between our dataset and Alexa, highlighting a clear bias towards complaints for certain types of websites. The largest fraction of domains are categorised as business (for both Alexa and Lumen), which includes websites such as 4shared.com, mangapark.me and gorillavid.in.333We note that this category covers a number of business facing websites, including those engaged in Hollywood copyright theft. The most over-represented categories in the Lumen dataset are Elevated Exposure444This category refers to malicious websites that camouflage their true nature (8% vs. 0.3% for Alexa), Entertainment (13% vs. 3%), File Download (2% vs. 0.6%), File Sharing (2% vs. 0.6%), Blogs (8% vs. 6%), and Adult Content (9% vs. 7%). While File downloading and sharing are expected, the other ones are less intuitive. In contrast, categories that are under-represented include Education (2% for Lumen vs. 12% for Alexa) and Marketing (1% vs. 9%).
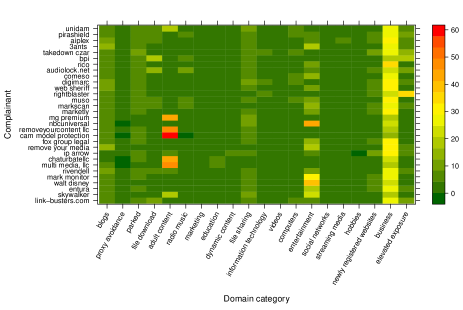
These trends suggest that notice senders tend to focus on individual categories. To explore this, Figure 3 presents the fraction of complaints that target each of these top 20 categories for the top 30 complainants. In-line with our conjecture, several complainants exhibit significant bias towards a single category. For example, 42% of MG Premium’s complaints target adult websites, 45% of NBCUniversal’s focus on Entertainment, and 34% of Rico’s is Business, demonstrating the prevalence of a high degree of specialisation. Considering the practice of using web crawling to collect links (Urban et al., 2016), this specialisation makes sense as it allows individual organisations to streamline their activities (based on which sites they have crawlers for).
Briefly, we also note that these categories tend to attract different types of notices too. For example, we find that the majority of Data Protection (60%) notices are logged against adult domains. This aligns with the well known high litigiousness of the adult content industry (Sag, 2014). In contrast, 10% of complaints catagorised as Defamation pertain to news. The remaining notice types (DMCA, Government, and Private Information) are typically made about business domains, representing 31%, 33% and 60% for each category respectively; with the exception of Court Order notices where most complaints are regarding shopping domains (27%). These clear trends confirm that the majority of notice senders are quite focused in their activities, with clear specialisation.
4. Websites & Webpages
Whereas the previous section explored the complaints and complainants, we next inspect the websites (domains) and webpages (URLs) which the complaints pertain to. Specifically, we are interested in understanding which websites gain most attention, and their availability.
4.1. How ‘Hot’ Are Websites?
| Domain |
|
|
|
|
|
|
|
||||||||||||||
|---|---|---|---|---|---|---|---|---|---|---|---|---|---|---|---|---|---|---|---|---|---|
| mp3toys.xyz | 10 | 3 | elevated exposure | 10 | Apdif Brasil (99.9%) | 109 | - | ||||||||||||||
| 4shared.com | 15 | 4 | filesharing | 40 | Apdif Brasil (99.8%) | 246 | - | ||||||||||||||
| googlevideo.com | 1 | 7 | entertainment | 84 | Comeso (78.2%), Remove Your Media (17.3%) | 239 | - | ||||||||||||||
| mangapark.me | 3 | 4 | business | 18 | Remove Your Media (99.1%) | 28 | 3,901 | ||||||||||||||
| gorillavid.in | 3 | 3 | business | 16 |
|
365 | 6,778 | ||||||||||||||
| tvad.me | 1 | 2 | business | 14 | Fox Group Legal (59.9%), Mark Monitor (39.9%) | 94 | 45,766 | ||||||||||||||
| israbox.vip | 101 | 5 | media file download | 19 | Rivendell (99.6%) | 46 | - | ||||||||||||||
| uploaded.net | 3 | 2 | filesharing | 216 |
|
365 | 662 | ||||||||||||||
| genteflowmp3.uno | 11 | 2 | media file download | 6 | Apdif Mexico (99.6%) | 149 | - | ||||||||||||||
| deep-warez.org | 1 | 2 | radiomusic | 43 | Rivendell (98%) | 345 | 183,305 |
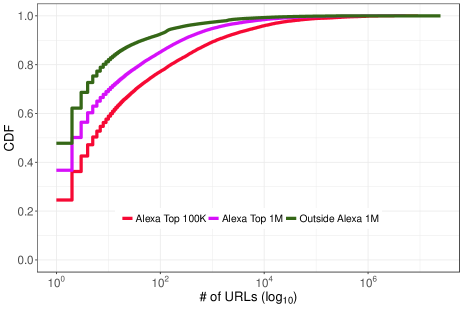
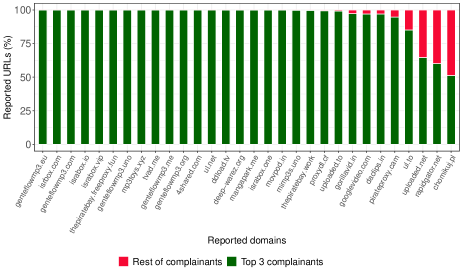
We start by inspecting the number of complaints generated about each website. Figure 4 presents a CDF showing the distribution of notices per domain. We separate the data depending on the domain popularity, based on its position in the Alexa ranking. Again, we observe a noticeable skew: it is clear that there are a small number of ‘hot’ websites that gain the most attention from notice senders. In particular, the most reported domains (the top 1% by the number of reported URLs), receive 63% of all complaints. To provide insight into the characteristics of these domains, Table 3 summarises the Top 10 in terms of the number of complaints. A range of uncommon websites are seen within this list. Although, overall, 60% of notices relate to websites in the Alexa Top 100K, only 4 of the most reported 10 domains, and 8 out of the top 30 are within this Alexa rank (we find a Pearson correlation of just 0.13 between these two rankings). The reasons behind these relatively obscure sites gaining ‘notoriety’ are quite diverse, but they do share one common attribute: their position in the ranking is typically driven by a single complainant that repeatedly targets them. In fact, 9 out of the top 10 domains receive at least 50% of their complaints from a single organisation. This is a general pattern across all domains: we find that 82% of them receive at least half of their complaints from a single complaint. To visualise this dominance by a few complainants in each domain, we depict in Figure 5 the percentage of URLs reported by the top 3 complainants of each domain (in green). The rest of complainants (in red) tend to contribute little to nothing. The vast majority of domains receive nearly all complaints from just a tiny set of senders. For example, mp3toys.xyz receives 99.9% of complaints from a single party (Apdif Brasil). Upon closer inspection, it is clear that this organisation uses an algorithm to ‘guess’ potential infringing URLs based on song titles (Urban et al., 2016). Although we envisage that these URLs are checked for liveness before complaints are generated, we note that mp3toys.xyz dynamically generates 200 OK HTTP responses for any URL requested, likely disrupting any liveness checks. These type of bulk sending activities do not appear to be rare occurrences. For example, the same organisation reported over 17M URLs for file hosing domain 4shared.com, despite the website only hosting 2M pages (TorrentFreak, 2016). As well as confirming that these highly active senders are heavily automated, it also suggests that rigorous procedures are not always followed.
4.2. Are Domains Unique?
The above is based on unique domain counts, however, we also posit that some of these domains may actually host the same content, or even resolve to the same IP address. To test this, we turn to our DNS and webpage probes, which downloaded the HTML from all domains. We extract their <title> and all metadata tags. In cases, where two domains’ tags match, we assume they host the same page. We term these replicas. The vast majority of domains host different content. Fewer than 0.01% of domains have any replicas. From those that do, 73% refer to the same IP address, indicating that the web server operator has simply created multiple domain names. Just 2% of these have matching second-level domains (with a different TLD), whereas the remainder actually are entirely distinct. We conjecture that this may be an evasion tactic to avoid DNS-based blocking schemes. We also observe certain outliers; in the most extreme case, we find that 1fichier.com uses 3,838 different domain names, which map to 78 IP addresses. This is a file sharing service well known for hosting illegal content. Another key driving force in the case of these extreme examples is the presence on numerous unblocker websites in our dataset. These websites essentially operate as proxies, generating third level domains for any website requested. For example, s-s.www.cats.com.prx2.unblocksites.co provides access to www.cats.com via unblocksites.co. Table 4 presents the top 10 (in terms of reported URLs) of these unblocking services. Remarkably, unblocksites.co actually constitutes 10% of all reported URLs. In other words, we find that many complainants target these unblocker sites, by replicating their complaints for both the origin domain and the unblocked version. Understanding an exploring these is a key area of our future work.
|
|
|
|
|
||||||||||
|---|---|---|---|---|---|---|---|---|---|---|---|---|---|---|
| unblocksites.co | 10 | 0.13 | uncategorised | 12,252 | ||||||||||
| freeproxy.fun | 2.4 | 0.02 | webproxy | 26,517 | ||||||||||
| unblocked.lol | 2 | 0.04 | proxy avoidance | 8,552 | ||||||||||
| unblockall.xyz | 0.9 | 0.02 | proxy avoidance | 820,291 | ||||||||||
| proxydude.xyz | 0.6 | 0.007 | elevated exposure | - | ||||||||||
| immunicity.gold | 0.5 | 0.03 | proxy avoidance | - | ||||||||||
| unblockall.org | 0.5 | 0.01 | business | 4,947 | ||||||||||
| unblocked.cam | 0.5 | 0.02 | proxy avoidance | |||||||||||
| unblocker.cc | 0.4 | 0.009 | proxy avoidance | 15,535 | ||||||||||
| unlockproj.club | 0.4 | 0.02 | uncategorised |
4.3. How Stable are Domain Rankings?
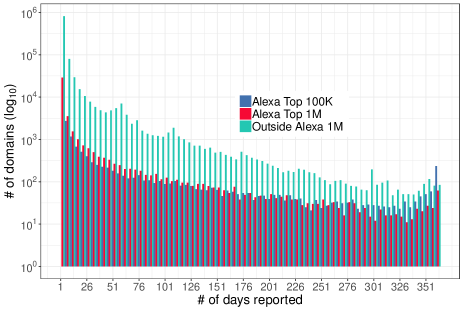
The previous sections indicate that complaints about a domain are often dominated by a single sender. We conjecture that this dominance may result in significant temporal instability. This can be represented as a ranked list, capturing the domains most frequently reported on each day. To explore this, Figure 6 presents the count of domains that are reported on days. 81% of domains are complained about on fewer than 5 days, with only 0.2% being complained about on more than 300 days. This suggests a high degree of instability, with the make-up of complaints changing on a daily basis. In line with our previous findings, the majority of these infrequently complained about domains are outside the Alexa Top 1M, whereas 87% of domains which are complained about on over 300 days are within the top 1M. In Figure 6 this can be seen as an upturn on the right-hand side of the graph.
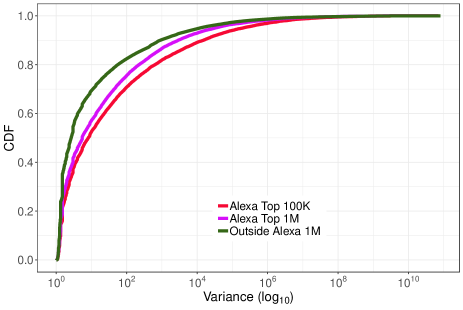
To explore this trend, We next calculate the statistical variance of each domain’s daily complaint count to understand how the number of daily complaints change. Figure 7 presents a CDF showing the per domain variance over the entire dataset (for domains with complaints on multiple days). About 15% of domains have a variance of zero because they receive the same number of complaints each day they are reported; 94% of these are reported under six times. However, many remaining domains exhibit significant daily variance: 7% of domains have a variance greater than 1K and, remarkably, 0.9% of domains even have a daily variance greater than 1M. This means that the number of complaints to a domain varies heavily on a day-to-day basis.
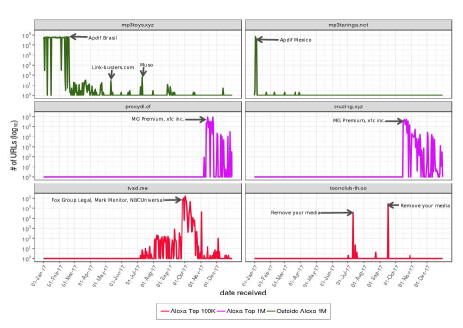
Closer inspection reveals that this is driven by extremely aggressive complainants who periodically inject large sets of (sometimes repeat) notices. For example, for domains with variance greater than 1M, we find that 92% receive an average of 116 duplicates from the same sender. To better highlight this aggressive activity, Figure 8 presents timeseries measuring the number of daily complaints for several example domains. We select the top two domains with the largest variance in each Alexa ranking category (top 100K, top 1M, outside Alexa). Significant instability exists across each of these domains, with labels in the figure highlighting the individual sender causing each spike. For instance, the top ranked domain, mp3toys.xyz, receives an average of 500K daily complaints from Apdif Brasil between Jan & Feb, yet this collapses to below 6 per day in March. Similarly, mp3taringa.net receives a significant number of complaints between 03/Jan – 05/Jan by Apdif Mexico, but following this the numbers collapse to almost zero. We posit that these senders are not always careful in the complaints they generate but, rather, send bulk notices, leaving the recipient to make sense of the content.
4.4. Are Reported Websites Alive?
We finally inspect the availability of reported domains and webpage resources. As it is impossible to draw causal links between a notice being issued and the removal of content, we limit our analysis to inspecting the availability of URLs, rather than inferring the reason for their (un)availability.
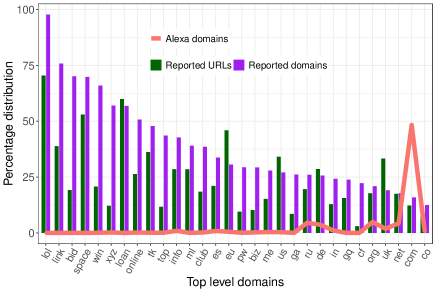
Understanding Domain Liveness. We first check the liveness of each domain’s DNS record using our DNS dataset. This reveals that 22% of reported domains return an NXDOMAIN response.555This is returned when a domain name does not exist on the authoritative name server any longer. These domains account for over 183M (17%) of infringing URLs, with just 3% (1,426) of them belonging to domains that rank within Alexa’s Top 1M. As different domain registrars may have differing policies regarding the removal of records, we next group domains by their TLD, and check the likelihood of domains being taken offline; Figure 9 presents the results. We plot both the number of websites (domains) that are unavailable, as well as the number of specific URLs that become unavailable (because the domain is offline). For context, we plot the density of Alexa top 1M domains that have each TLD. The majority of TLDs with a high percentage of NXDOMAIN responses do not frequently occur in the top Alexa rankings. Instead, we see that the majority of domains are from the recent wave of new generic TLDs (Spencer, 2014). The most extreme is .lol, where 98% of domains are NX; it is noteworthy that this TLD is operated by Uniregistry, which has been accused of predominantly hosting spam (lol, 2016). These trends indicate that the usage and behaviours across these TLDs are quite different, with some far more likely to contain unavailable domains.
Understanding URL Availability. Next, we turn to our periodic HTTP liveness checks to see if resources (URLs) are still alive (for those domains that do not return NXDOMAIN). We see that the number of 200 (OK) responses decline slowly but steadily over the 4 week period that we monitored. After week 4, 22% of URLs are inactive (i.e., non-200). This trend, however, is relatively shallow with the majority of URLs (19%) becoming inactive in the first week after the notice has been observed in Lumen.666Note that it is also possible that the URL was not live when the complaint was generated. Unfortunately, we cannot check this. We also note that the statuses returned evolve across the four weeks. In week 1, the number of HTTP 4XX responses is 168K, yet in week 2 we only observe a further 12K webpages responding with 4XX. Instead, the number of HTTP 5XX and TCP timeouts increase, suggesting that these websites go through several stages that start with removing of content (therefore returning a 4XX) before total shutdown of the web server. The latter makes sense, as it may be unnecessary to continue running a server if most content has been removed.
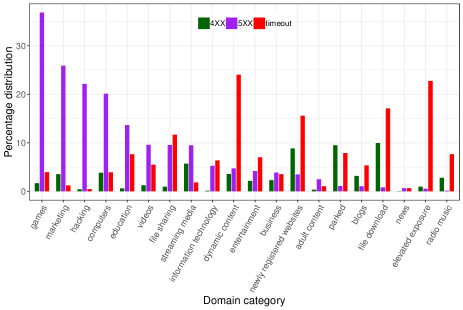
Understanding Category Availability. We continue our analysis by inspecting which category of URLs are most likely to go offline. Figure 10 breaks down all URLs into their categories and presents the share within each group that reports non-200 HTTP responses after complaints are generated. Certain categories are significantly more likely to return non-200 responses. For example, 10% of URLs classified as File Download return a 404 response; similar traits are also seen across Parked (9%) and Newly Registered Website (9%). In contrast, 24% of URLs classified as Dynamic Content (i.e., websites that generate different material for each visit) return a TCP connection timeout, i.e., the web server is no longer online. Other examples of categories with high numbers of URLs that timeout include Elevated Exposure (22%), and File Download (17%). The category which contains fewest unavailable sites is News, where only 1.34% of URLs become non-200. This indicates that the robustness of sites differs substantially across categories. That said, it is reasonable that domains more clearly engaging in suspicious activity are most likely to become unavailable.
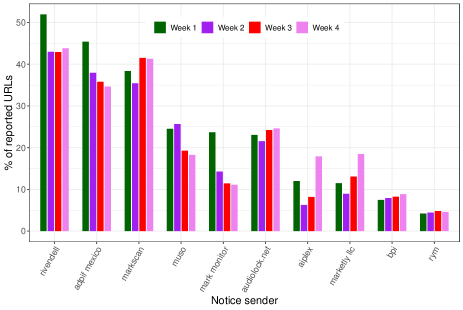
Understanding Complainant Success An obvious question is which complainants are most likely to see their reported URLs deleted. To measure this, we calculate the percentage of reported URLs from each notice sender that later sees the URL resource returning a non-200 response. Figure 11 presents the weekly percentage of complaints that return a non-200 response after each weekly liveness check for the top 10 senders (based on the complainant with most not 2XX responses). The websites targeted by these different notice senders have very different availability properties. Complaints from rights enforcement organisations (e.g., Rivendell, MarkScan, AudioLock.net) appear more effective compared to trade organisations (e.g., British Phonographic Organisation). For example, about 53% of complaints in the first week of submission from Rivendell return non 2XX response code whilst just 8% from British Phonographic Organisation return same. These results confirms that the efficacy of these different organisations differs greatly, and that the websites they pursue have extremely different characteristics in terms of resilience to takedown.
5. Related Work
There are two main areas of related work: (i) studies that rely on Lumen for exploring web complaints; and (ii) studies that have explored illegal online activities more generally.
Web Complaint Studies. There have been numerous studies into web complaints. Of most relevance are the small set of data-driven papers that have empirically explored the nature of takedown requests in the legal domain. For example, Heins et al. (Heins et al., 2005) examined 320 takedown notices to determine if the takedown process is fairly used by reporting organisations. They discovered that 20% of notice senders send weak copyright claims, an assertion our results agree with. Previous studies from Seng (Seng, 2014) and Urban et al. (Urban et al., 2016) explored the entities behind notices from approximately 500K and 300K complaints, respectively. Both studies reveal that a small fraction of senders (mainly copyright protection companies and trade association) are responsible for the majority of notices. This is a result that is consistent with our findings. (Urban et al., 2016) also classified the websites present in complaints; our work further builds on this to explore which categories of websites each sending entity specialises in. In an earlier study, Urban et al. (Urban and Quilter, 2005) examined nearly 900 notices in an attempt to discover the primary reporting organisations that file them. They also saw that business entities and corporations were the main users of takedown notices. To the best of our knowledge, our study is the largest of its kind.
Closely related is the Right To Be Forgotten (RTBF), established in 2014 within the European Union. This allows individuals to request the de-listing of personal information from search engines, which is “inaccurate, inadequate, irrelevant or excessive”. Bertram et al. (Bertram et al., [n. d.]) inspected the RTBF requests issued to Google. This work is complementary to our own, as we focus on different complaint mechanisms, i.e., Lumen does not cover RTBF. This is evident from the contrast between types of URLs in (Bertram et al., [n. d.]) vs. our study, e.g., 33% of RTBF URLs relate to social media, and 20% to news. This can be compared against §3.3, where we find a greater propensity towards Entertainment and Business URLs (driven by the prominence of copyright enforcement notices).
Illegal Web Activities. George et al. (George and Scerri, 2007) examined the challenges that comes with the ease of sharing User Generated Content (UGC), highlighting the roles played by hosting providers and proposing stronger legislation to address the illegal sharing of UGC. Wong (Wong, 2009) suggested a more flexible legislation, whilst Sawyer (Sawyer, 2009) recommended that platforms that share UGC should develop solutions to mitigate against the sharing of infringing material. Clay and Lucas discussed how a UGC platform (YouTube) has been exploited for such purpose (Clay, 2011; Hilderbrand, 2007). Raman et al. also identified pirated content being shared via Facebook Live (Raman et al., 2018). To prevent the sharing of infringing content on such platforms, Dutta et al. proposed a signature-based detection to mitigate against infringing material remaining accessible online (Dutta and Patel, 2008).
Peer-to-Peer networks and file hosters are also a frequently used to disseminate illicit or illegal material. Despite several anti-piracy efforts through the injection of fake content on BitTorrent portals (Cuevas et al., 2013, 2014; Kaune et al., 2010; Farahbakhsh et al., 2013) and the shutdown of file hosters services (Lauinger et al., 2013b), about 90% of files shared using BitTorrent protocol are judged to be infringing (Watters et al., 2011; Robert and Paul, 2010). Furthermore, 80% of files shared through file hosters are also in the same category (Lauinger et al., 2013a). Ibosiola et al. measured the availability of illegal content on streaming cyberlockers (Ibosiola et al., 2018). They found that the majority of copyright infringing content is hosted on a small number of platforms. A large portion of complaints in our data also pertain to adult content. While there have been several studies on online adult content (Tyson et al., 2013; Tyson et al., 2015; tyson2016measurements), few focus on illegal adult content (Hurley et al., 2013). Of course, there are also a number of related studies looking at video content more generally (bottger2018open). Our work is orthogonal as we primarily focus on the complaints that are related to these activities.
6. Discussion and Future Work
This paper has explored the nature of web complaints. With increasing scrutiny on illegal and illicit web activities, and the recent ability to streamline complaints against different stakeholders, this study offers a critical input into the wider ongoing debate about web governance and the use of so-called self-regulation (Urist, 2006).
Summary of Findings. We have found a large and complex ecosystem dominated by a small set of complainants. While there are a large number of organisations (38,523) that generate over 1 billion reported URLs, the top 10 complainants alone contribute over 41% of all notices. It therefore appears that these complaint procedures have become the dominion of a small group of large and very active organisations. Dominant players consists of a mix of influential copyright owners (e.g., Fox) and third-parties specialised in pursuing copyright infringers (e.g., Rivendell). Bursts of complaints are common with most of the complaints towards each domain originating from 2–3 complainants, driving the unusual instability we see in the rankings. Complainants are highly specialised in terms of the types of notices they generate and the domains they target. This leaves some domain categories (e.g., File Sharing) regularly reported, and others rarely seen (e.g., Education). Surprisingly, many of the most frequently reported domains are quite obscure, and fail to score highly in popularity rankings. Finally, we find that complaints do seem to matter. Many domain names are soon taken offline and 22% of the URLs are inaccessible within just 4 weeks of us observing the complaints. Hence, it is clear that we shed light on a highly dynamic environment from the perspective of domain operators too.
Societal and Legal Implications. Web governance and the (mis)use of web complaint mechanisms have important social and legal implications. Transparency is critical and, as a society, it is important to know how and why information is filtered. This is particularly the case as we have found that these mechanisms might not be always used wisely, e.g., with some complainants generating hundreds of repeat notices, and seemingly auto-generated URLs (§ 4.3). We argue that this might overwhelm recipients, who will not necessarily have the resources to deal with these large numbers. As these highly centralised models of operation have the potential for misuse, understanding the activity of senders is therefore critical.
Our results further suggest that there is opportunity to improve and streamline the procedures. For notice recipients, the filtering of invalid complaints would no doubt be a valuable innovation. That said, we do not discount the veracity of many complaints, and therefore developing mechanisms to support this process from the perspective of (notice senders would also be worthwhile. This, of course, should not be done at the expense of website operators, who should always be given paths to recourse. Developing techniques that automate the above three things is important. Arguably, Lumen and similar platforms can play a powerful role in this process.
Future Work. There are a number of lines of future work. First, we hope to expand our access to more diverse datasets. Within the paper, we have not investigated the role that recipients might play within the nature of complaints observed. This is likely to open up new lines of interesting investigation. Our analysis has also revealed traits of a cat-and-mouse game, with complainants bulk sending notices, and websites replicating themselves across multiple domains and TLDs. Exploring the temporal attributes of this game will no doubt reveal a number of yet unseen behaviours. Last, we also wish to explore if search engines cease to index URLs that are complained about. Quantifying this forms a key strand of our future work.
References
- (1)
- lol (2016) 2016. Famous Four rubbish Spamhaus Worst TLD league. http://domainincite.com/20164-schilling-famous-four-rubbish-spamhaus-worst-tld-league.
- fre (2018) 2018. FreeNOM. http://www.freenom.com/en/freeandpaiddomains.html.
- spa (2018) 2018. The World’s Most Abused TLDs. https://www.spamhaus.org/statistics/tlds/.
- Aaron and Rasmussen (2016) Greg Aaron and Rod Rasmussen. 2016. Global Phishing Survey: Trends and Domain Name Use in 2016. APWG Reports October (2016), 1–30.
- Ahmed et al. (2016) Faraz Ahmed, M Zubair Shafiq, and Alex X Liu. 2016. The internet is for porn: Measurement and analysis of online adult traffic. In 2016 IEEE 36th International Conference on Distributed Computing Systems (ICDCS). IEEE, 88–97.
- Authority (2018) Internet Assigned Numbers Authority. 2018. IANA Top Level Domain Directory. https://data.iana.org/TLD/tlds-alpha-by-domain.txt
- Bartow (2012) Ann Bartow. 2012. Copyright law and pornography. Or. L. Rev. 91 (2012), 1.
- Bertram et al. ([n. d.]) Theo Bertram, Elie Bursztein, Stephanie Caro, Hubert Chao, Rutledge Chin Feman, Peter Fleischer, Albin Gustafsson, Jess Hemerly, Chris Hibbert, Luca Invernizzi, et al. [n. d.]. Three years of the Right to be Forgotten. Under Submission ([n. d.]).
- Clay (2011) Andrew Clay. 2011. Blocking, tracking, and monetizing: YouTube copyright control and the downfall parody. Institute of Network Cultures: Amsterdam, 219–233.
- Congress (2011) US Congress. 2011. Preventing Real Online Threats to Economic Creativity and Theft of Intellectual Property Act of 2011. (2011).
- ConnellyWorks (2014) ConnellyWorks. 2014. Role of Social Media in Law Enforcement Significant and Growing. LexisNexis (July 2014).
- Contributor (2012) Contributor. 2012. Hotfile is Out Cold, But Google’s DMCA Safe Harbor Debate Is Heating Up. (March 2012). https://techcrunch.com/2012/03/25/hotfile-google-safe-harbor/?guccounter=1
- Cruz et al. (1998) Isabel F Cruz, Slava Borisov, Michael A Marks, and Timothy R Webb. 1998. Measuring structural similarity among web documents: preliminary results. In Electronic Publishing, Artistic Imaging, and Digital Typography. Springer, 513–524.
- Cuevas et al. (2013) Rubén Cuevas, Michal Kryczka, Angel Cuevas, Sebastian Kaune, Carmen Guerrero, and Reza Rejaie. 2013. Unveiling the incentives for content publishing in popular bittorrent portals. IEEE/ACM Transactions on Networking (2013).
- Cuevas et al. (2014) Ruben Cuevas, Michal Kryczka, Roberto González, Angel Cuevas, and Arturo Azcorra. 2014. TorrentGuard: Stopping scam and malware distribution in the BitTorrent ecosystem. Computer Networks (2014).
- Dutta and Patel (2008) Rabindranath Dutta and Kamal Chandrakant Patel. 2008. Detecting copyright violation via streamed extraction and signature analysis in a method, system and program.
- Farahbakhsh et al. (2013) Reza Farahbakhsh, Angel Cuevas, Ruben Cuevas, Reza Rejaie, Michal Kryczka, Roberto Gonzalez, and Noel Crespi. 2013. Investigating the reaction of BitTorrent content publishers to antipiracy actions. 13th IEEE International Conference on Peer-to-Peer Computing, IEEE P2P 2013 - Proceedings (2013), 1–10.
- for Applied Internet Data Analysis (2015) Center for Applied Internet Data Analysis. 2015. The CAIDA UCSD AS classification dataset. http://www.caida.org/data/as_classification
- for Assigned Names and Numbers ([n. d.]) The Internet Corporation for Assigned Names and Numbers. [n. d.]. ICANNWiki. https://icannwiki.org/
- Foundation (2018) WPO Foundation. 2018. Web-Page Test CDN Domain Pattern List. https://github.com/WPO-Foundation/webpagetest/blob/master/agent/wpthook/cdn.h
- George and Scerri (2007) Carlisle George and Jackie Scerri. 2007. Web 2.0 and User-Generated Content: legal challenges in the new frontier. Journal of Information, Law and Technology (2007).
- Giannoumis (2014) G Anthony Giannoumis. 2014. Regulating web content: the nexus of legislation and performance standards in the United Kingdom and Norway. Behavioral sciences & the law 32, 1 (2014), 52–75.
- Heins et al. (2005) Marjorie Heins, Waldman Michael, and Goldberg Deborah. 2005. Will Fair Use Survive? Free Expression in the Age of Copyright Control. Brennan Center for Justice (2005).
- Hilderbrand (2007) Lucas Hilderbrand. 2007. YouTube: Where cultural memory and copyright converge. FILM QUART 61, 1 (2007), 48–57.
- Hoof (2016) Florian Hoof. 2016. Live Sports, Piracy and Uncertainty: Understanding Illegal Streaming Aggregation Platforms. 86–93 pages.
- Hurley et al. (2013) Ryan Hurley, Swagatika Prusty, Hamed Soroush, Robert J Walls, Jeannie Albrecht, Emmanuel Cecchet, Brian Neil Levine, Marc Liberatore, Brian Lynn, and Janis Wolak. 2013. Measurement and analysis of child pornography trafficking on P2P networks. In Proceedings of the 22nd international conference on World Wide Web. ACM, 631–642.
- Ibosiola et al. (2018) Damilola Ibosiola, Benjamin Steer, Alvaro Garcia-Recuero, Gianluca Stringhini, Steve Uhlig, and Gareth Tyson. 2018. Movie Pirates of the Caribbean: Exploring Illegal Streaming Cyberlockers. Association for the Advancement of Artificial Intelligence(ICWSM) (2018).
- Ikram et al. (2019) Muhammad Ikram, Rahat Masood, Gareth Tyson, Mohamed Ali Kaafar, Noha Loizon, and Roya Ensafi. 2019. The Chain of Implicit Trust: An Analysis of the Web Third-party Resources Loading. arXiv preprint arXiv:1901.07699 (2019).
- Jain et al. (1984) Rajendra Jain, Dah-Ming Chiu, and William R. Hawe. 1984. A quantitative measure of fairness and discrimination for resource allocation in shared computer system. , 38 pages.
- Kaune et al. (2010) Sebastian Kaune, Ruben Cuevas Rumin, Gareth Tyson, Andreas Mauthe, Carmen Guerrero, and Ralf Steinmetz. 2010. Unraveling bittorrent’s file unavailability: Measurements and analysis. In Peer-to-Peer Computing (P2P), 2010 IEEE Tenth International Conference on. IEEE, 1–9.
- Kim et al. (2015) Dae Wook Kim, Peiying Yan, and Junjie Zhang. 2015. Detecting fake anti-virus software distribution webpages. Computers & Security 49 (2015), 95–106.
- Kim et al. (2017) Kideuk Kim, Ashlin Oglesby-Neal, and Edward Mohr. 2017. 2016 Law Enforcement Use of Social Media Survey. International Association of Chiefs of Police and the Urban Institute (February 2017).
- Lauinger et al. (2013a) Tobias Lauinger, Kaan Onarlioglu, Abdelberi Chaabane, Engin Kirda, William Robertson, and Mohamed Ali Kaafar. 2013a. Holiday pictures or blockbuster movies? Insights into copyright infringement in user uploads to one-click file hosters. Lecture Notes in Computer Science 8145 LNCS (2013), 369–389.
- Lauinger et al. (2013b) Tobias Lauinger, Martin Szydlowski, Kaan Onarlioglu, Gilbert Wondracek, Engin Kirda, and Christopher Kruegel. 2013b. Clickonomics: Determining the Effect of Anti-Piracy Measures for One-Click Hosting. Network and Distributed System Security Symposium (2013), 1–14.
- Lemley (2007) Mark A. Lemley. 2007. Rationalizing Internet Safe Harbors. Journal on Telecommunications & High Technology Law 6 (2007), 101–119.
- Marx (2013) Nick Marx. 2013. Storage Wars: Clouds, Cyberlockers, and Media Piracy in the Digital Economy. Journal of e-Media Studies 3, 1 (2013), 1–27.
- Menell and Phleger (2011) Peter S Menell and Herman Phleger. 2011. Jumping the Grooveshark : A Case Study in DMCA Safe Harbor Abuse. Berkeley Center for Law & Technology (2011), 1–3.
- Piatek et al. (2008) Michael Piatek, Tadayoshi Kohno, and Arvind Krishnamurthy. 2008. Challenges and directions for monitoring P2P file sharing networks. Proceedings of the 3rd conference on Hot topics in security (2008), 1–7.
- Raman et al. (2018) Aravindh Raman, Gareth Tyson, and Nishanth Sastry. 2018. Facebook (A) Live?: Are Live Social Broadcasts Really Broad casts?. In Proceedings of Web Conference.
- Robert and Paul (2010) Layton Robert and Watters Paul. 2010. Investigation into the extent of infringing content on BitTorrent networks. Internet Commerce Security Laboratory (2010).
- Sag (2014) Matthew Sag. 2014. Copyright trolling, an empirical study. Iowa L. Rev. 100 (2014), 1105.
- Sawyer (2009) Michael S Sawyer. 2009. Filters, Fair Use & Feedback: User Generated Content Principle and the DMCA. Berkeley Technology and Law Journal (2009).
- Scheitle et al. (2018) Quirin Scheitle, Oliver Hohlfeld, Julien Gamba, Jonas Jelten, Torsten Zimmermann, Stephen D Strowes, and Narseo Vallina-Rodriguez. 2018. A Long Way to the Top: Significance, Structure, and Stability of Internet Top Lists. arXiv preprint arXiv:1805.11506 (2018).
- Seng (2014) Daniel Seng. 2014. The State of the Discordant Union: An Empirical Analysis of DMCA Takedown Notices. Virginia Journal of Law & Technology 18, 3 (2014), 369–473.
- Solomon (2015) Leron Solomon. 2015. Fair Users or Content Abusers: The Automatic Flagging of Non-Infringing Videos by Content. Hofstra Law Review 211, 237 (2015).
- Spencer (2014) Daniela Michele Spencer. 2014. Much Ado About Nothing: ICANN’s New GTLDs. Berkeley Tech. LJ 29 (2014), 865.
- Starov et al. (2018) Oleksii Starov, Yuchen Zhou, Xiao Zhang, Najmeh Miramirkhani, and Nick Nikiforakis. 2018. Betrayed by Your Dashboard: Discovering Malicious Campaigns via Web Analytics. In Proceedings of the 2018 World Wide Web Conference on World Wide Web. International World Wide Web Conferences Steering Committee, 227–236.
- Stiegler (2013) Zack Stiegler. 2013. Regulating the web: network neutrality and the fate of the open internet. Rowman & Littlefield.
- Surveys (2018) Web Technology Surveys. 2018. Usage of top level domains for websites. https://w3techs.com/technologies/overview/top_level_domain/all
- TorrentFreak (2016) Ernesto TorrentFreak. 2016. Google Asked to Remove 50 Million 4shared Links. https://torrentfreak.com/google-asked-to-remove-50-million-4shared-links-161104/
- Tyson et al. (2013) Gareth Tyson, Yehia Elkhatib, Nishanth Sastry, and Steve Uhlig. 2013. Demystifying porn 2.0: A look into a major adult video streaming website. In Proceedings of Internet measurement conference. 417–426.
- Tyson et al. (2015) Gareth Tyson, Yehia Elkhatib, Nishanth Sastry, Steve Uhlig, et al. 2015. Are people really social in porn 2.0?. In ICWSM.
- Urban and Quilter (2005) Jennifer Urban and Laura Quilter. 2005. Efficient Process or Chilling Effects? Takedown Notices under Section 512 of the Digital Millennium Copyright Act. Santa Clara Computer & High Technology Law Journal 22, 4 (2005), 621–693.
- Urban et al. (2016) Jennifer M Urban, Joe Karaganis, and Brianna L Schofield. 2016. Notice and Takedown in Everyday Practice. Berkeley Center for Law & Technology (2016).
- Urist (2006) Joshua Urist. 2006. Who’S Feeling Lucky-Skewed Incentives, Lack of Transparency, and Manipulation of Google Search Results under teh DMCA. Brook. J. Corp. Fin. & Com. L. 1 (2006), 209.
- Wang et al. (2017) Xiaolei Wang, Sencun Zhu, Dehua Zhou, and Yuexiang Yang. 2017. Droid-AntiRM: Taming Control Flow Anti-analysis to Support Automated Dynamic Analysis of Android Malware. In Proceedings of the 33rd Annual Computer Security Applications Conference. ACM, 350–361.
- Watters et al. (2011) Paul A. Watters, Robert Layton, and Richard Dazeley. 2011. How much material on BitTorrent is infringing content? A case study. Information Security Technical Report (2011).
- Wong (2009) Mary W S Wong. 2009. ”Transformative” User-Generated Content in Copyright Law: Infringing Derivative Works or Fair Use? Vand. J. Ent. & Tech. Law (2009).
- Zarras et al. (2014) Apostolis Zarras, Alexandros Kapravelos, Gianluca Stringhini, Thorsten Holz, Christopher Kruegel, and Giovanni Vigna. 2014. The dark alleys of madison avenue: Understanding malicious advertisements. In Proceedings of the 2014 Conference on Internet Measurement Conference. ACM, 373–380.
- Zucherman et al. (2010) Ethan Zucherman, Hal Roberts, Jillian York, Robert Faris, and Palfrey John. 2010. 2010 Circumvention Tool Usage Report. Berkman Center for Internet & Society (2010), 1–13.