Ca2+ release via IP3 receptors shapes the cytosolic Ca2+ transient for hypertrophic signalling in ventricular cardiomyocytes
Abstract
Calcium (Ca2+) plays a central role in mediating both contractile function and hypertrophic signalling in ventricular cardiomyocytes. L-type Ca2+ channels trigger release of Ca2+ from ryanodine receptors (RyRs) for cellular contraction, while signalling downstream of Gq coupled receptors stimulates Ca2+ release via inositol 1,4,5-trisphosphate receptors (IP3Rs), engaging hypertrophic signalling pathways. Modulation of the amplitude, duration, and duty cycle of the cytosolic Ca2+ contraction signal, and spatial localisation, have all been proposed to encode this hypertrophic signal. Given current knowledge of IP3Rs, we develop a model describing the effect of functional interaction (cross-talk) between RyR and IP3R channels on the Ca2+ transient, and examine the sensitivity of the Ca2+ transient shape to properties of IP3R activation. A key result of our study is that IP3R activation increases Ca2+ transient duration for a broad range of IP3R properties, but the effect of IP3R activation on Ca2+ transient amplitude is dependent on IP3 concentration. Furthermore we demonstrate that IP3-mediated Ca2+ release in the cytosol increases the duty cycle of the Ca2+ transient, the fraction of the cycle for which [Ca2+] is elevated, across a broad range of parameter values and IP3 concentrations. When coupled to a model of downstream transcription factor (NFAT) activation, we demonstrate that there is a high correspondence between the Ca2+ transient duty cycle and the proportion of activated NFAT in the nucleus. These findings suggest increased cytosolic Ca2+ duty cycle as a plausible mechanism for IP3-dependent hypertrophic signalling via Ca2+-sensitive transcription factors such as NFAT in ventricular cardiomyocytes.
Article \corrauthor[*]vijay.rajagopal@unimelb.edu.au; edmund.crampin@unimelb.edu.au
Many studies have identified a role for IP3R-mediated Ca2+ signalling in cardiac hypertrophy, however the mechanism by which this signal is communicated within the cardiomyocyte remains unclear. We present a mathematical model of functional interactions between RyR and IP3R channels. We show that IP3-mediated Ca2+ release is capable of providing a modest increase to the duty cycle of the calcium signal, which has been shown experimentally to lead to NFAT activation, and hence hypertrophic signalling. Through a parameter sensitivity analysis we demonstrate that the duty cycle is increased with IP3 over a broad parameter regime, indicating that this mechanism is robust, and we show that an increase in Ca2+ duty cycle increases nuclear NFAT activation. These findings suggest a plausible mechanism for IP3R-dependent hypertrophic signalling in cardiomyocytes.
Introduction
Calcium is a universal second messenger that plays a role in controlling many cellular processes across a wide variety of cell types; ranging from fertilisation, cell contraction, and cell growth, to cell death (berridge_calcium_2003, clapham_calcium_2007). Precisely how Ca2+ fulfills each of these roles while also ensuring signal specificity remains unclear in many cases. Ca2+ can be used to transmit signals in a variety of ways. Signal localisation, and amplitude and frequency modulation have been widely explored (berridge_am_1997, berridge_calcium_2006, bootman_update_2009), however, mechanisms for information encoding in the cumulative signal (i.e. area under the curve (AUC), proportional-integral-derivative (PID) controller, or duty cycle (DC)) have also been proposed (purvis_encoding_2013, uzhachenko_computational_2016, hannanta-anan_optogenetic_2016). Determining which method of information encoding is relevant to a specific signalling pathway requires determining what type of signal encoding the system is capable of, and whether the downstream effector of the signal is capable of temporal signal integration, high or low pass filtering, or threshold filtering.
In cardiac myocytes, discrete encoding of multiple Ca2+-mediated signals is particularly pertinent because of the essential and continuous role Ca2+ plays in excitation-contraction coupling (ECC). Of particular significance is the involvement of Ca2+ in hypertrophic growth signaling. How Ca2+ can communicate a signal in the hypertrophic signalling pathway concurrent with the cytosolic Ca2+ fluxes that drive cardiac muscle contraction is still largely unresolved (roderick_calcium_2007, hohendanner_cytosolic_2015). Understanding this mechanism is important as pathological hypertrophic remodelling is a precursor of heart failure and a common final pathway of cardiovascular diseases including hypertension and coronary disease (jefferies_mechanisms_2018, tham_pathophysiology_2015, gilbert_calcium_2019).
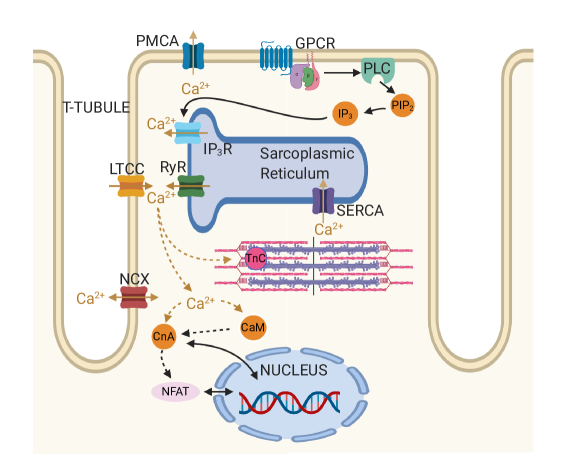
During each heartbeat, on depolarisation of the membrane Ca2+ enters the cell via L-type Ca2+ channels (LTCC), triggering larger Ca2+ release from the sarcoplasmic reticulum (SR) via ryanodine receptors (RyRs), which then induces contraction. The activation of Ca2+ release via RyRs by the Ca2+ arising via LTCCs is known as calcium-induced calcium release (CICR), and results in a 10-fold increase in cytosolic Ca2+ concentration (relative to resting Ca2+ concentration of 100 nM). Sarco-endoplasmic reticulum Ca2+ pumps (SERCA) and other Ca2+ sequestration mechanisms subsequently withdraw the released Ca2+ back into the SR and out of the cytosol (hinch_simplified_2004, vierheller_multiscale_2015) reverting the cell to its relaxed state. Ca2+ also plays a central role in hypertrophic signalling. Hypertrophic stimuli such as endothelin-1 (ET-1) bind to G-protein-coupled receptors at the cell membrane to stimulate generation of the intracellular signalling molecule inositol 1,4,5-trisphosphate (IP3). After IP3 binds to and activates its cognate receptor, inositol 1,4,5-trisphosphate receptors (IP3R), on the SR and nuclear envelope, Ca2+ is released into the cytosol and nucleus respectively (higazi_endothelin-1-stimulated_2009, harzheim_increased_2009) (see Figure 1). This Ca2+ signal arising from IP3Rs has been shown in multiple mammalian species to produce a distinct Ca2+ signal that, through activation of pro-hypertrophic pathways including those involving NFAT, induces hypertrophy within cardiomyocytes. (higazi_endothelin-1-stimulated_2009, nakayama_ip3_2010, rinne_isoform-_2010).
In healthy adult rat ventricular myocytes (ARVMs), various effects of IP3 on global Ca2+ transients associated with ECC have been described, summarised in Table Introduction. While application of GPCR agonists that stimulate IP3 generation produces robust effects on ECC associated IP3 transients and contraction, the direct contribution of IP3 to these actions varies between studies (signore_inositol_2013, proven_inositol_2006, harzheim_increased_2009, domeier_ip3_2008, ljubojevic_early_2014, olivares-florez_nuclear_2018). For example, in rabbit the effect of ET-1 on Ca2+ transient amplitude is sensitive to the IP3R inhibitor 2-APB (domeier_ip3_2008), whereas in healthy rats IP3R inhibition with 2-APB was without effect (smyrnias_contractile_2018). In mice 2-APB abrogated an increase in ECC associated Ca2+ transients brought about by AngII (olivares-florez_nuclear_2018). Responses have also been variable when IP3 was directly applied to cardiac myocytes. In healthy rat, IP3 produced no or a modest effect on Ca2+ transient amplitude (proven_inositol_2006, harzheim_increased_2009), whereas in rabbit (domeier_ip3_2008) a more substantial effect was observed. These differences in the effect of IP3 have been ascribed in part to the greater dependence of rat myocytes on SR Ca2+ release to the Ca2+ transient than rabbit myocytes(domeier_ip3_2008). Notably, both ET-1 and IP3 elicit arrhythmogenic effects whereby they promote the generation of spontaneous calcium transients, manifest as a prolonged Ca2+ transient with additional peaks, and they increase the frequency of Ca2+ sparks (proven_inositol_2006, harzheim_increased_2009, domeier_ip3_2008, nakayama_ip3_2010). A more profound role for IP3 signalling is observed in hypertrophic ventricular myocytes, with ECC-associated Ca2+ transients of greater amplitude reported. Underlying these effects, IP3R expression is elevated in hypertrophy (harzheim_elevated_2010). Hence, a question remains as to what independent effect IP3R activation has on the cytosolic Ca2+ transient in healthy ventricular cardiac myocytes.
| Cell State | IP3 | ET-1 | |
| Rat | \pbox2.5cmAmplitude: | ||
| Duration: | |||
| Basal Ca2+: | |||
| SCTs: | \pbox2.5cm r▲(proven_inositol_2006) r◆(harzheim_increased_2009) | ||
| – | |||
| r◆(harzheim_increased_2009) | |||
| r▲(proven_inositol_2006) r▲(harzheim_increased_2009) | \pbox3.8cm r▲(proven_inositol_2006) r◆(higazi_endothelin-1-stimulated_2009) r▲(harzheim_increased_2009) | ||
| – | |||
| r◆(harzheim_increased_2009) | |||
| r▲(proven_inositol_2006) r▲(harzheim_increased_2009) | |||
| Other species | \pbox2.5cmAmplitude: | ||
| Duration: | |||
| Basal Ca2+: | |||
| SCTs: | \pbox2.5cm m▲(signore_inositol_2013) m◆(escobar_role_2012) | ||
| – | |||
| m▲(escobar_role_2012) | |||
| – | \pbox2.5cm h▲(signore_inositol_2013) m▲(signore_inositol_2013) | ||
| – | |||
| m▲(signore_inositol_2013) b▲(domeier_ip3_2008) | |||
| h▲(signore_inositol_2013) m▲(signore_inositol_2013) | |||
The individual behaviour of IP3R channels and their dependence on Ca2+, IP3, and ATP in cardiac and other cell types has been explored in a number of studies (foskett_inositol_2007, ramos-franco_single-channel_2000, siekmann_statistical_2014, siekmann_data-driven_2019). These studies have formed the basis of several computational models of IP3R type I isoforms (siekmann_statistical_2014, cao_deterministic_2014, sneyd_dynamical_2017) fitted to stochastic single-channel data (siekmann_mcmc_2012). However, properties of IP3R channel activity within the cardiomyocyte, such as gating state transition rates and their dependency on IP3 and Ca2+, have not been directly measured. In this study we have taken the experimental studies on rat ventricular cardiomyocytes as a reference point for the observed effects of IP3R activation on cellular Ca2+ dynamics and extended a well-established model of beat-to-beat cytosolic Ca2+ transients in rat cardiac cells (hinch_simplified_2004, terkildsen_using_2008) to include a model of type II IP3R (sneyd_dynamical_2017) channels. This deterministic, compartmental model of ECC enables us to investigate biophysically plausible mechanisms by which IP3R activation could affect Ca2+ dynamics at the whole cell scale, while avoiding the computational complexity associated with detailed stochastic and spatial modelling. Specifically, it enables us to explore the parameter ranges of IP3R-mediated Ca2+ release that modify the global cytosolic Ca2+ transient to encode information for hypertrophic signalling to the nucleus.
A number of transcription factors transduce changes in Ca2+ to activate hypertrophic gene transcription. Of particular note is Nuclear Factor of Activated T-cells (NFAT). There are five known NFAT isoforms expressed in mammals, four of these are found in cardiac cells (wilkins_targeted_2002, rinne_isoform-_2010). To initiate hypertrophic remodelling, the hypertrophic Ca2+ signal, in conjunction with calmodulin (CaM) and calcineurin (CnA) leads to dephosphorylation of cytosolic NFAT. Upon dephosphorylation NFAT translocates to the nucleus where, in coordination with other proteins, it activates expression of genes responsible for hypertrophy (molkentin_calcineurin-dependent_1998). Several studies have focused on characterising the Ca2+ dynamics necessary to activate NFAT and initiate hypertrophy (tomida_nfat_2003, colella_ca2+_2008, saucerman2008, rinne_isoform-_2010, ulrich2012, yissachar_dynamic_2013, hannanta-anan_optogenetic_2016, kar_control_2016) and have shown NFAT to be a Ca2+ signal integrator (tomida_nfat_2003). Furthermore, a recent study by hannanta-anan_optogenetic_2016 used direct optogenetic control of cytosolic Ca2+ transients in HeLa cells to demonstrate that the transcriptional activity of NFAT4 (also known as NFATc3), a necessary NFAT isoform in the hypertrophic pathway (wilkins_targeted_2002), can be up-regulated by increasing the residence time of Ca2+ in the cytosol within each oscillation. The increased residence time of Ca2+, referred to as the ‘duty cycle’, is the ratio between the area under the Ca2+ transient curve divided by the maximum possible area, as calculated by the product of transient amplitude and period (see Figure 2A). The Ca2+ duty cycle is therefore distinct from the average Ca2+ concentration. hannanta-anan_optogenetic_2016 showed that increasing the duty cycle had a proportionally greater effect on NFAT transcriptional activity than changing either the frequency or amplitude of the cytosolic Ca2+ oscillations. This suggests an increased Ca2+ duty cycle as a possible mechanism by which Ca2+ release through IP3R channels can effect hypertrophic signaling.
Here, using a mathematical model of beat-to-beat cytosolic Ca2+ transients in rat ventricular myocytes, coupled to IP3R channel Ca2+ release, we show that IP3R activation in the cytosol can increase the duty cycle of the cytosolic Ca2+ transient. We establish model feasibility through parameter sensitivity analysis, which shows that this behaviour does not depend sensitively on model parameter values. Furthermore we identify conditions necessary for IP3R channel activation to alter Ca2+ transient amplitude, width, basal Ca2+ and duty cycle, as identified in different experimental studies, and compare model simulations to published experimental data summarised in Table Introduction. Finally, we couple simulations of cytosolic Ca2+ dynamics to a model of downstream CaM/CnA/NFAT activation and show that the duty cycle of the Ca2+ transient highly correlates with the activated nuclear NFAT (the proportion of NFAT which is dephosphorylated and translocated to the nucleus). These findings suggest IP3R activity can increase the cytosolic Ca2+ duty cycle, thus providing a mechanism for IP3-dependent activation of NFAT for hypertrophic signalling in the cardiomyocyte.
Methods
We developed a computational model of RyR- and IP3R-mediated Ca2+ fluxes in the adult rat ventricular myocyte. Model simulations were performed using the ode15s ODE solver from MATLAB 2017b (The MathWorks Inc., Natick, Massachussetts) with relative and absolute tolerances and respectively. The model equations were simulated at 1 Hz, the original pacing frequency of the hinch_simplified_2004 model and at 0.3 Hz because it is another common pacing frequency in experimental studies of IP3 and Ca2+ in cardiomyocytes (proven_inositol_2006, harzheim_increased_2009). The model was paced until the normalised root mean square deviation (NRMSD) between each subsequent beat was below , and all but the last oscillation discarded to eliminate transient behaviours (see Figure 2B). Initial conditions were set to the basal Ca2+ level of the model at dynamic equilibrium with inactive IP3R channels, determined after running the base model until the NRMSD was also below .
Model Equations
The compartmental model of rat left ventricular cardiac myocyte Ca2+ dynamics is based on the hinch_simplified_2004 model of ECC, with the addition of IP3R Ca2+ release modelled using the Siekmann-Cao-Sneyd model (sneyd_dynamical_2017). The Hinch model is an established whole cell model of rat cardiac Ca2+ dynamics that describes the flux through the major Ca2+ channels and pumps on the cell and SR membranes and the effects of applying a voltage across the cell membrane. The parameters for the Hinch component of our model were maintained from the original except for those of the driving voltage. This was shortened to better approximate the rat action potential (pandit_mathematical_2003) (see Figure S1). The Ca2+ in the cytosol is governed by the following ODE:
| (1) | ||||
| (2) |
A small Ca2+ flux through the LTCCs, , activates RyR channels to release Ca2+ from the SR into the cytosol at a rate of . Ca2+ is resequestered into the SR by SERCA at a rate . is the rapid buffer coefficient (wagner_effects_1994) for the fluorescent dye in the cytosol and is the rapid buffer coefficient for calmodulin in the cytosol. includes Ca2+ fluxes such as exchange with the extracellular environment through the sodium-calcium exchanger, ; sarcolemmal Ca2+-ATPase, ; and the background leak current, ; as well as the SR leak current, ; and buffering on troponin C, . These fluxes are defined in the SI (section 1).
When the simulation is run with IP3 present, there is additionally a flux through the IP3Rs :
| (3) |
Here is the volume of the cell. is the maximum total flux through each IP3R channel; this was chosen to be 0.45 m3ms-1 unless otherwise stated to create a measurable effect on IP3R channel activation while maintaining plausible total flux. is the number of IP3R channels in the cell, this was set to 1/50th of the number of RyR channels (moschella_inositol_1993). We studied the effect of varying on IP3-induced changes to the cytosolic Ca2+ transient in normal cardiomyocytes. Evidently, varying and varying have the same effect on simulated calcium dynamics. While is known to increase significantly in disease conditions, we have not emphasised it in this study due to our focus on normal cardiomyocytes. and are the Ca2+ concentrations in the cytosol and SR respectively.
is the [Ca2+] and [IP3] dependent open probability of the IP3R channels, and is determined using the Siekmann-Cao-Sneyd model (siekmann_kinetic_2012, cao_deterministic_2014, sneyd_dynamical_2017), which has an in-built delay in response to changing Ca2+ concentration, along with several parameters governing channel activation and inactivation. This model describes as:
| (4) |
where is a transition term derived from single-channel siekmann_kinetic_2012, describes the rate of activation and the rate of inactivation:
| (5) | ||||
| (6) |
where is time-dependent, and , , and describe the dependence on IP3, the dependence on Ca2+ and the Ca2+-dependent delay in IP3R gating, respectively. Expressions for these variables are as follows:
| (7) | ||||
| (8) | ||||
| (9) | ||||
| (10) |
Here and are parameters which determine the Ca2+-dependence of IP3R channel open probability, while and are parameters which affect the delay in IP3R response to cytosolic changes. determines the influence of [Ca2+] on the delay, while is a temporal scaling factor.
We note that the SR leak flux, , is unchanged from the Hinch model, and would include the effects of diastolic IP3R Ca2+ release at normal IP3 levels as that model did not explicity include IP3R. However, in the presence of IP3, IP3R Ca2+ flux during diastole is several orders of magnitude greater than , which is largely dependent on , and hence any discrepancy caused by this will have a negligible effect on overall Ca2+ dynamics within the cell (see also Figure S4).
Several experimental studies have investigated IP3R activity across a range of Ca2+ concentrations with M IP3 (ramos-franco_isoform-specific_1998, foskett_inositol_2007). These studies suggest that IP3R channels would be open, with almost constant over the full range of cytosolic Ca2+ concentrations experienced during ECC in the cardiomyocyte. An IP3R-facilitated SR-Ca2+ leak has been reported to amplify systolic concentrations (zima_ca2_2010, blanch_i_salvador_obstruction_2018) as seen in most published experiments of IP3 enhanced Ca2+ transients tabulated in Table Introduction. Through parameter sensitivity analysis of this model, we show that in order to be consistent with these observations must be significantly smaller at resting Ca2+ concentrations than at higher concentrations.
Coupling cytosolic Ca2+ and NFAT activation
We coupled the calcium model to the NFAT model developed by cooling_sensitivity_2009, which determines the proportion of total cellular NFAT that is dephosphorylated and translocated to the nucleus for a given cytosolic Ca2+ signal. In this study we have used the model parameters estimated from the data in tomida_nfat_2003 who measured activation of NFAT4 in BHK cells. Full details of the cooling_sensitivity_2009 model are given in the Supplementary Information.
Results
An example of the model output when run with the original IP3R channel parameter values determined by sneyd_dynamical_2017 for type I IP3R channels is shown in Figure 2C. Measurements of the properties of IP3R channel activity and their dependence on Ca2+ within cardiomyocytes are sparse in the literature. Therefore we performed a parameter sensitivity analysis by running model simulations over a variety of parameter ranges to explore the dependence of features of the cytosolic calcium transient to IP3R channel parameters.
A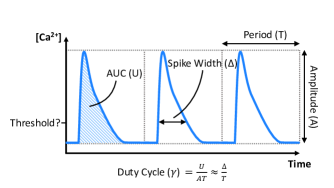 B
B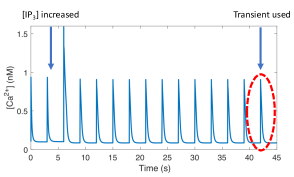 C
C
Parameter sensitivity analysis
We conducted a parameter sensitivity analysis to determine the critical parameters related to IP3R activation that affect the shape of beat-to-beat cytosolic Ca2+ transients. We used the Jansen method (jansen_analysis_1999) as described in saltelli_variance_2010 (and summarised in the SI) to calculate the ‘main effect’ and ‘total effect’ coefficients of each of the parameters associated with IP3R channel gating in relation to changes in transient amplitude, full duration at half maximum (FDHM), diastolic Ca2+ and duty cycle (see Table Introduction). saltelli_variance_2010 describe the main effect coefficient as ‘the expected reduction in variance that would be obtained if [the parameter] could be fixed’ and the total effect coefficient as ‘the expected variance that would be left if all factors but [the parameter] could be fixed’, both normalised by the total variance. Both coefficients are included here to provide a complete picture of the impact of each parameter. Simulation parameter values were generated using the MATLAB sobolset function with leap and skip .
Variance-based parameter sensitivity analysis
| Main Effect Coefficients | [IP3] | |||||
|---|---|---|---|---|---|---|
| Amplitude | 0.27 | 0.00 | 0.03 | 0.19 | 0.00 | 0.03 |
| FDHM | 0.17 | 0.00 | 0.01 | 0.12 | 0.00 | 0.50 |
| Diastolic Ca2+ | 0.44 | 0.00 | 0.09 | 0.03 | 0.00 | 0.04 |
| Duty Cycle | 0.23 | 0.00 | 0.01 | 0.16 | 0.00 | 0.33 |
| Total Effect Coefficients | [IP3] | |||||
| Amplitude | 0.63 | 0.04 | 0.43 | 0.46 | 0.02 | 0.13 |
| FDHM | 0.33 | 0.00 | 0.19 | 0.19 | 0.00 | 0.54 |
| Diastolic Ca2+ | 0.79 | 0.00 | 0.45 | 0.06 | 0.00 | 0.18 |
| Duty Cycle | 0.45 | 0.00 | 0.25 | 0.24 | 0.00 | 0.38 |
Table Introduction shows that the delay parameters and do not have a large effect on the cytosolic Ca2+ transient. While they are necessary to describe the effect of IP3R-dominated Ca2+ dynamics (sneyd_dynamical_2017), they contribute only a small amount to the variance. Therefore we decided to fix these parameters in our simulations.
As expected, the coefficients show that cardiac cell Ca2+ dynamics during ECC are most highly sensitive to IP3 concentration ([IP3]) and the maximal flux through each IP3R (). The maximal flux has little effect on transient amplitude, but large influence on duration and duty cycle; while [IP3] has the greatest effect on the change in amplitude and diastolic Ca2+ concentration.
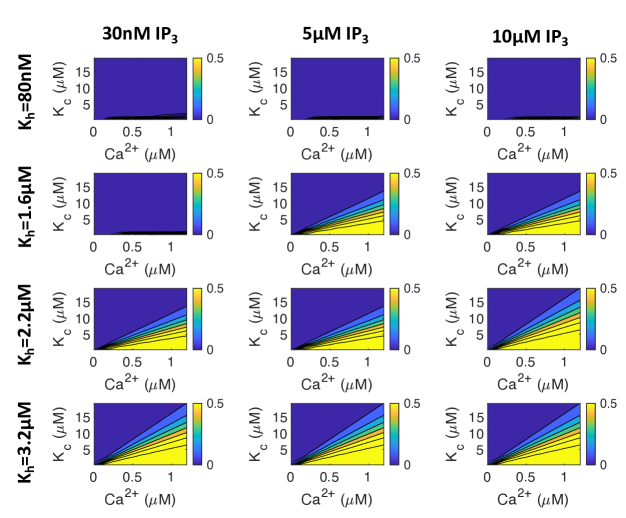
The gating parameters and also influence the cytosolic Ca2+ transient. affects the [Ca2+] at which IP3R channels are inhibited and affects the [Ca2+] at which IP3R channels open. We illustrate how these two parameters affect IP3R open probability, , in Figure 3. Figure 3 also shows how [IP3] affects the relationship between , , [Ca2+] and . It can be seen that with = 80 nM, will be close to zero regardless of the values of Ca2+ or [IP3] or . At M and [IP3] M dependence on and Ca2+ becomes apparent. Finally, at M, is still dependent on and Ca2+ values, but [IP3] does not change significantly.
From this analysis, we determine that in order for IP3R channels to be active during ECC, must be sufficiently high that IP3Rs are not inhibited at diastolic [Ca2+]. Conversely, must be low enough that IP3R channels are active at Ca2+ concentrations below the systolic Ca2+ peak. Therefore, in the remainder of this study, we fix at M: high enough to fulfill this condition while low enough that IP3R channels are still affected by [IP3]. We report simulation results only within the range of that exhibits experimentally plausible Ca2+ transient properties.
With the plausible range of and established, we next show the effect of , and [IP3] on the ECC transient.
IP3 concentration and IP3R opening behaviour have the greatest impact on the Ca2+ transient
As summarised in Table Introduction, different experimental studies suggest different effects of IP3R activation on the ECC cytosolic Ca2+ transient. Figures IntroductionA-C show quantitative predictions of how much Ca2+ transient properties could be affected by IP3R activation across a range of [IP3] and Ca2+-dependent IP3R gating parameter values. was fixed at 0.45 m3ms-1 and was fixed at 2.2 M.
The red region in Figure IntroductionA corresponds to IP3R activation parameters that produce the greatest increase in Ca2+ amplitude. Noteworthy is that the red region depicts moderate changes in amplitude of 15%. This region corresponds to values greater than 4 M and [IP3] greater than 2 M. With set at 2.2 M, this corresponds to the middle and far-right plots of in Figure 3. The middle subfigure shows that with greater than 4 M IP3R channels would open only at Ca2+ concentrations greater than the diastolic concentration of 0.1 M. The plot also shows that IP3Rs would remain active at Ca2+greater than the systolic peak concentration of 1 M (greenstein2002). Figure IntroductionB further indicates that the increase in peak amplitude is accompanied by an increase in transient duration (FDHM). However, this change may be small, particularly at IP3 concentrations lower than 1 M. In Figure IntroductionC it can be seen that the diastolic Ca2+ concentration decreases moderately (10%) in the parameter range where the amplitude is maximised (Figure IntroductionA).
![[Uncaptioned image]](/html/1902.04851/assets/x5.png)
![[Uncaptioned image]](/html/1902.04851/assets/x6.png)
![[Uncaptioned image]](/html/1902.04851/assets/x7.png)
![[Uncaptioned image]](/html/1902.04851/assets/x8.png)
Figure IntroductionB shows that FDHM of the Ca2+ transient increases whenever IP3Rs are active. This increase is greater with greater concentrations of IP3 and with lower values of . Figure IntroductionC indicates that and [IP3] have a similar effect on the diastolic Ca2+ concentration except that the location of the red and orange cross predicts a small (10%) drop in diastolic Ca2+. In all three Figures (A-C) there is little change when [IP3] is low and is high (bottom right corner of each image). This is a regime in which the IP3R channels barely open in response to ECC transients. For comparison, Supplementary Figure S2 shows the same simulations as Figure Introduction at a commonly used experimental pacing frequency of 0.3 Hz, showing similar trends.
In order to compare our simulation results with the experimental observations summarised in Table Introduction we divided the parameter space shown in Figures IntroductionA-C into four regions, shown in Figure IntroductionD. In the red region, amplitude and FDHM increase. In the orange region only FDHM increases. In the green region FDHM and diastolic [Ca2+] increase but amplitude decreases. Comparing to the experimental observation of amplitude increase summarised in Table 1, the red region appears to describe the most plausible parameter range. Figure IntroductionD also shows that there is no parameter set where both amplitude and diastolic Ca2+ concentration increase. Furthermore, there is no region in which transients with increased amplitude and decreased duration are observed, as has been reported in ET-1 treated rat ventricular myocyte experiments (moravec_endothelin_1989). Finally, with the exception of the blue region in which there is no change, we observe that the FDHM increases in all parameter regimes.
To examine these results further, we investigated model behaviour in different regions of Figure IntroductionD, shown in Figure 5 and marked as green, red and orange crosses in Figure IntroductionA-C. Comparing the green cytosolic profiles (corresponding to the green region in Figure IntroductionD) and blue cytosolic Ca2+ profiles (corresponding to no IP3R activation) in Figure 5, we find that IP3R opening at diastolic Ca2+ levels and IP3R inhibition at Ca2+ levels below peak transient concentrations generates a flatter Ca2+ transient. This is the result of a gradual depletion of SR Ca2+ stores from IP3Rs opening. This subsequently leads to lower Ca2+ release through RyR and IP3R channels.
Interestingly, a delayed time to peak is observed with IP3R activation in all regimes selected. With the reduction in SR load due to IP3R activation, we find reduced Ca2+ flux through RyRs. In order to maintain or increase Ca2+ transient amplitude after activation, the IP3R channels must compensate for the drop in RyR flux. As the spike in IP3R flux is in response to Ca2+ release from RyR channels, and initial RyR-mediated Ca2+ release is slower with lower SR Ca2+ stores, it delays the time between cell stimulation and Ca2+ transient peak.
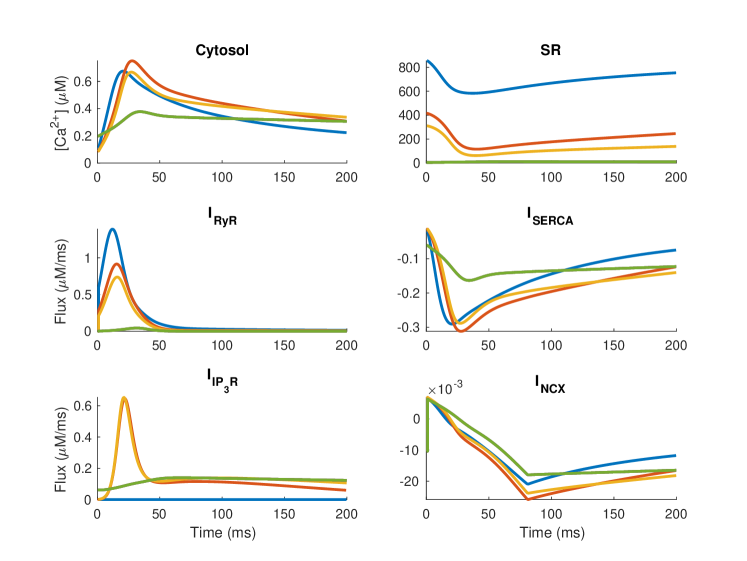
The increase in FDHM of the transient from IP3R activation apparent in Figure IntroductionB can be explained by continued release of Ca2+ through IP3R channels after RyRs have closed in Figure 5. The slower release through IP3R channels after RyRs close is a result of a smaller proportion of the channels opening and a decrease in SR Ca2+ store load.
Maximum flux through IP3Rs can increase signal duration
The parameter sensitivity analysis in Table Introduction indicates that maximum flux through IP3Rs () has the greatest effect on Ca2+ transient duration. Therefore we next examined how increased values in our model affects the Ca2+ transient. Figure IntroductionA-C show that for M, increasing above m3m mostly increases transient duration but has only marginal effects on amplitude and baseline. However for large , the role of in modifying transient shape becomes more noticeable. There is a clear region where amplitude increases (red region), however this is more dependent on than . At 1 Hz, there is no value of that reduces transient duration. With IP3R activation the transient duration increases and merely determines by how much. However it is of note that, as shown in Figure Introduction, at a lower frequency of 0.3 Hz, when m3m and M, there is a decrease in duration of the transient.
To compare simulation results to experimental observations in Table Introduction, we divided the parameter space shown in Figures IntroductionA-C into three regions, shown in Figure IntroductionD. The regions in this figure are consistent with the regions labelled in Figure IntroductionD. Figure IntroductionD shows similar regions corresponding to simulations at 0.3 Hz. It can be seen that at 0.3 Hz, M and m3m provide transients with increased amplitude and decreased duration, consistent with rat ET-1 experiments summarized in Table Introduction. However this value of results in an unrealistic flux through IP3R channels. Additionally, in vivo, the cell would be paced at a faster frequency and this result is unlikely without the cell being able to return to resting Ca2+. We have not been able to identify a parameter set that would provide a simultaneous increase in both amplitude and diastolic Ca2+ .
![[Uncaptioned image]](/html/1902.04851/assets/x10.png)
![[Uncaptioned image]](/html/1902.04851/assets/x11.png)
![[Uncaptioned image]](/html/1902.04851/assets/x12.png)
![[Uncaptioned image]](/html/1902.04851/assets/x13.png)
![[Uncaptioned image]](/html/1902.04851/assets/x14.png)
![[Uncaptioned image]](/html/1902.04851/assets/x15.png)
![[Uncaptioned image]](/html/1902.04851/assets/x16.png)
![[Uncaptioned image]](/html/1902.04851/assets/x17.png)
RyR and IP3R interaction increases the intracellular Ca2+ duty cycle
Having establishing reasonable parameters ranges for IP3R activation based on the influence on ECC Ca2+ transient properties (amplitude, FDHM, and diastolic Ca2+), we investigated the possibility that cytosolic Ca2+ plays a role in hypertrophic remodelling through changing the duty cycle. Given the time scale involved in hypertrophic remodelling, and the signal integration properties of NFAT, the IP3R -modified cytosolic Ca2+ transient could cumulatively encode hypertrophic signalling. Using optogenetic encoding of cytosolic Ca2+ transients in HeLa cells, hannanta-anan_optogenetic_2016 demonstrated that the transcriptional activity of NFAT4 can be up-regulated by increasing cytosolic Ca2+ duty cycle. This is a plausible mechanism of signal encoding that is likely to be less susceptible to noise than either amplitude or frequency encoding. Therefore, we examined the cytosolic Ca2+ duty cycle as a hypertrophic signalling mechanism.
We calculated the duty cycle for the Ca2+ transients in the plausible parameter ranges for IP3R activation as the ratio between the area under the Ca2+ transient curve and the area of the bounded box defined by the amplitude and period of the Ca2+ transient (shown in Figure 2). Figure Introduction shows the effects of [IP3], , and on the duty cycle of the cytosolic Ca2+ transient. The Figure shows that the Ca2+ duty cycle increases with IP3R activation across the broad parameter range shown.
![[Uncaptioned image]](/html/1902.04851/assets/x18.png)
![[Uncaptioned image]](/html/1902.04851/assets/x19.png)
![[Uncaptioned image]](/html/1902.04851/assets/x20.png)
![[Uncaptioned image]](/html/1902.04851/assets/x21.png)
NFAT activation increases with an increase in calcium duty cycle
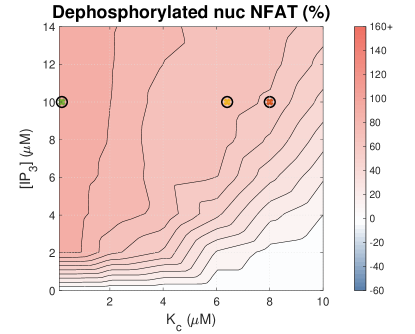
Having established that IP3R activation results in increased calcium transient duty cycle, we coupled the model of cytosolic ARVM calcium dynamics to the model of NFAT activation developed by cooling_sensitivity_2009. We then tested the effect of varying IP3 concentration over a range of IP3R parameter values on the proportion of dephosphorylated nuclear NFAT compared to that in the phosphorylated inactive state in the cytosol (Figure 9). These simulation data clearly show that increased IP3 and alteration in Ca2+ transient duty cycle positively influences NFAT activation and thus provides a mechanism to couple IP3-induced Ca2+ release and activation of hypertrophic gene expression.
Discussion
Here we have presented what is, to our knowledge, the first modelling study to investigate the effect of IP3R channel activity on the cardiac ECC Ca2+ transient and possible information encoding mechanisms. We extended a well-established model of the ECC Ca2+ transient by hinch_simplified_2004 to include a model of IP3R activation and Ca2+ release. The model, upon IP3R activation, simulates the influence of IP3R activation on Ca2+ transients in non-hypertrophic adult rat left ventricular cardiac myocytes.
Parameter sensitivity analysis (Table Introduction) showed the maximal IP3-induced Ca2+ release through individual IP3R () had the greatest influence on the Ca2+ transient duration and duty cycle. [IP3] had the biggest influence on the Ca2+ amplitude and diastolic Ca2+ concentration. We found that under fixed maximum IP3R flux, m3m, IP3R activation increases the duration of the Ca2+ transient, but Ca2+ amplitude is IP3-dependent. The Ca2+ transient duration can be reduced only by increasing to physiologically unrealistic values.
The finding that the Ca2+ transient duty cycle increases with [IP3] (see Figure Introduction) provides a plausible explanation for the mechanism by which IP3-dependent Ca2+ release from IP3Rs can enhance pro-hypertrophic NFAT activity.
Does IP3-induced Ca2+ release modify the ECC transient?
Figures Introduction, Introduction and Introduction show that IP3Rs can influence the ECC Ca2+ transient and the effect is dependent on the IP3R properties and IP3 concentration. Our model simulations predict that Ca2+ transient amplitude increases approximately 15% when IP3R properties are such that IP3Rs remain inhibited from opening at diastolic Ca2+ but release Ca2+ once RyRs are activated and remain open when Ca2+ concentration is above 1 M. The IP3R parameter combination marked by a red cross in the contour plots is a representative example of this type of effect of IP3Rs. There is also a narrow parameter range at [IP3] of 10 M ( M, 6 M) where the amplitude does not change more than 5% (see Figure Introduction). The orange cross marks an example of IP3R effects in this parameter range. These simulation predictions are consistent with the experimental studies that either show increased amplitude or no change in amplitude (Table Introduction).
Model simulations predict that IP3R activation only increases diastolic [Ca2+] when IP3R are open at resting [Ca2+] of 0.1 M (see Figure IntroductionD). harzheim_increased_2009 reported no measurable differences in diastolic [Ca2+] between ARVMs stimulated with an agonist, known to induce hypertrophy in healthy ARVMs, and those treated with a saline buffer (although effects have been observe in disease ventricular cardiomyocytes and atrial cardiomyocytes). Examination of simulated Ca2+ transients within a regime that results in diastolic [Ca2+] increase (green traces in Figure 5) shows that the transients do not resemble any of the observed experimental measurements in the literature. Therefore the comparison of model simulations and experimental measurements of diastolic [Ca2+] and Ca2+ transient amplitude suggest that the most likely regime of IP3R activation lies between the orange and red regions in Figure IntroductionD. Using these comparisons we propose that IP3R activation makes modest changes to the ECC Ca2+ transient which are often hidden within the measurement variability in experiments.
The biological significance of the duty cycle
We showed that while amplitude, duration, and diastolic Ca2+ can increase or decrease depending on IP3R parameter values and pacing frequency, the duty cycle, as defined by hannanta-anan_optogenetic_2016 always increases with IP3, consistent with effects seen in (proven_inositol_2006). The implication of this observation is that IP3R activation is sufficient to provide a signal to drive NFAT nuclear translocation and hence hypertrophic gene expression in the manner described by hannanta-anan_optogenetic_2016.
hannanta-anan_optogenetic_2016 found that, when comparing Ca2+ oscillations of the same amplitude, oscillations with greater duty cycle had a greater effect on NFAT dephosphorylation and translocation to the nucleus. In their study, duty cycle, , was calculated as the area under the curve, , divided by the maximum area under the curve (for Ca2+ oscillations of the same amplitude, , and period of oscillation, ), i.e. (see Figure 2A). An alternative definition is , where is the transient duration and the period of oscillation. This alternate formulation is used by tomida_nfat_2003 and salazar_decoding_2008 but is less well defined for analogue signals. The duty cycle in Figure Introduction was calculated using the former definition. This can be compared with the latter definition when remembering that duty cycle will now vary with FDHM (Figures IntroductionC and IntroductionC).
The duty cycle in this system essentially reflects the fraction of each period of the Ca2+ cycle for which cytosolic Ca2+ is sufficiently elevated to affect the downstream proteins in the CnA/NFAT signalling pathway. The greater sensitivity of NFAT to Ca2+ oscillations with sustained elevation in intracellular Ca2+ is well established (dolmetsch_differential_1997, colella_ca2+_2008, rinne_isoform-_2010). While it is difficult to determine where this threshold is, NFAT is a Ca2+ integrator and a clear correlation has been found between Ca2+ duty cycle and NFAT activation (hannanta-anan_optogenetic_2016). Increasing duty cycle increases the time NFAT spends in the dephosphorylated state, which is required to both enter and maintain it in the nucleus and hence effect transcription (feske2000); NFAT responds to changes in duty cycle while being insensitive to both amplitude and frequency changes. We see in simulations too that the proportion of NFAT that is in the dephosphorylated nuclear state is highest when the duty cycle of the Ca2+ transient is high (Figures Introduction and 9).
In experiments, IP3 stimulation has been shown to lead to an increase in systolic Ca2+ in cardiac cells, but significant change in duration has not been reported (although as in harzheim_increased_2009 and proven_inositol_2006, increased spontaneous calcium transients are observed which could function to prolong the duration of the Ca2+ transient). Based on the definition of the duty cycle presented in hannanta-anan_optogenetic_2016, there is a negative effect on duty cycle, and hence NFAT activation, when Ca2+ transient amplitude is increased. However, within the physiologically plausible parameter range we find that simulations with increased Ca2+ transient amplitude also have increased transient duration. We postulate that NFAT may be responsive to the Ca2+ transient through the latter definition of the duty cycle – i.e. the duration of time that Ca2+ is elevated over a threshold divided by the period. This is more consistent with both the biological mechanism and the potential increase in peak Ca2+ concentration in the hypertrophic pathway, which may be a side-effect of a corresponding increase in duration over this threshold. Further research, both theoretical and experimental, is required in order to determine the validity of this assumption.
Figure 9 shows a strong correlation between [Ca2+]-dependent NFAT activation and Ca2+ transient duty cycle in the cooling_sensitivity_2009 model: the correspondence between Figure IntroductionA and Figure 9 is striking. A caveat, however, is that the original cooling_sensitivity_2009 study showed that the NFAT model is also sensitive to any average increase in cytosolic calcium. Therefore, while increasing Ca2+ transient duty cycle is shown to be sufficient for NFAT activation in this model, further experimental validation is required to confirm this mechanism in cardiomyocytes.
Experimental evidence of an IP3-induced increase in calcium duty cycle?
An increase in duty cycle without an increase in frequency requires an increase in transient duration. While this increase is observed in our simulations for a broad range of parameter values, it has not however been reported in experiments involving IP3 stimulation. The possible reasons for this are many and varied, however, as discussed earlier, using different IP3 concentrations to those that occur in vivo may result in different effects on the shape of the Ca2+ oscillations, leading to inconsistent observations. Furthermore, small variations in Ca2+ concentrations may not be experimentally discernible, or may be hidden by the effect of Ca2+-sensitive dyes (sparrow_measurement_2019). A small, but prolonged variation in transient duration can produce a comparatively large change in duty cycle. Hence it remains to be confirmed experimentally whether IP3R-dependent Ca2+ flux does indeed lead to an increased Ca2+ duty cycle in cardiomyocytes.
Limitations of the study
In this study we have considered generation of voltage-driven cytosolic Ca2+ transients using deterministic models of each ion channel in a compartmental model. There are several physiological features of cardiomyocyte Ca2+ dynamics which are not represented, and hence not considered in this approach. In particular, our model does not represent any of the stochastic events associated with IP3R channels. Further modelling of combined stochastic channel gating may be necessary to elucidate the entire impact of IP3R interaction with the cytosolic Ca2+ machinery. While cell structure is known to play a role in cardiac Ca2+ dynamics (gaur_multiscale_2011, rajagopal_examination_2015, ladd_assessing_2019), effects beyond the synchronising function of the dyad are not considered in this compartmental study. Furthermore we have not considered the spatial IP3R distribution. Our model is developed primarily using parameters fitted by hinch_simplified_2004 and sneyd_dynamical_2017, and makes no distinction between IP3R channels located within or outside the dyad (mohler_ankyrin-b_2003, mohler_ankyrin-b_2005). These and other structural features of the cell could alter the Ca2+ available to regulate IP3R channels and may be detected in the Ca2+ transient. Distinct effects of IP3 signalling in the cytosol and the nucleus are also not considered. Cytosolic Ca2+ is thought to promote translocation of NFAT into the nucleus, while nuclear Ca2+ maintains it there (higazi_endothelin-1-stimulated_2009). We have only investigated the former role for Ca2+ signalling within the CnA/NFAT pathway.
We have explored model behaviour at pacing frequencies of 1 Hz and 0.3 Hz, rather than higher, more physiological frequencies, primarily because the majority of parameters were derived from in vitro experiments conducted at room temperature. Extrapolation of parameters and hence model behaviour to in vivo temperature and correspondingly higher pacing frequency remains challenging. Therefore model predictions must be interpreted cautiously in relation to higher pacing frequencies.
Additionally, not all components of this signalling pathway have been considered in this study. Ca2+/calmodulin-dependent kinases II and Class IIa histone deacetylases, for example, are both known Ca2+-mediated components of the hypertrophic pathway that are activated by IP3 signalling (wu2006) but are not included. Here we have focused only on the impact of IP3R activation on the cytosolic Ca2+ dynamics and how this relates to the mechanism of NFAT activation. In order to explore broader context for IP3 mediated hypertrophic signalling, it remains to couple this model to upstream events including models of IP3 production through activation of cell membrane receptors (cooling_modeling_2007, cooling_modelling_2008). This would allow the profile and extent of the rise in IP3 concentration due to the activation of the hypertrophic pathway in cardiomyocytes to be determined. We have focused on the effect of an elevated IP3 concentration of 10 M as many experimental studies into the effect of IP3 on Ca2+ dynamics use saturating [IP3]. However, remus2006 found stimulation of adult cat ventricular myocytes with 100 nM ET-1 induced a cell-averaged increase in IP3 concentration of only 10 nM indicating a much lower concentration than used in experiments. This, together with known differences between species, suggests the IP3 concentration detected by IP3R receptors in ARVMs in vivo could be lower than the simulated 10 . However we note qualitatively similar effects on the Ca2+ transient in parameter regimes with lower [IP3] in our model (Figures Introduction and S2) albeit with more modest effects on the transient shape. Additionally, ET-1 receptors are localised to t-tubule membranes (boivin2003) so IP3 may be generated very close to IP3R channels (mohler_ankyrin-b_2005, escobar2011), increasing the concentration they detect.
Finally, IP3R-induced Ca2+ release is a part of a larger hypertrophic signalling network. It remains to couple this model to other signalling pathways involved in bringing about hypertrophic remodelling (ryall_network_2012). How cytosolic Ca2+ interacts with nuclear Ca2+ in regulation of NFAT nuclear residence and activity also remains to be determined.
Conclusion
The sensitivity of NFAT translocation to the Ca2+ duty cycle demonstrated by hannanta-anan_optogenetic_2016 raises the question as to whether IP3R flux can increase the Ca2+ duty cycle in cardiomyocytes during hypertrophic signalling. Here we have shown using mathematical modelling that an increase in cytosolic Ca2+ transient duration can occur following addition of IP3, and furthermore that this increase is sufficient to increase NFAT activation. Together, these results suggest a plausible mechanism for hypertrophic signalling via IP3R activation in cardiomyocytes. While it cannot be ruled out that a significant role is played by components of this pathway that are not considered here, the computational evidence provided in this study, along with the previous experimental findings, suggests encoding of the hypertrophic signal through alteration of the duration of cytosolic Ca2+ oscillations to be a feasible mechanism for IP3-dependent hypertrophic signalling.
Author Contributions
EJC, VR, HLR, CS, and GB conceived of the study; EJC and VR supervised the project; HH, AT, VR and EJC developed the modelling approach. HH implemented the simulations. HLR, CS, and GB provided critical feedback. All authors contributed to writing the manuscript.
Acknowledgements
This research was supported in part by the Australian Government through the Australian Research Council Discovery Projects funding scheme (project DP170101358). HLR wishes to acknowledge financial support from the Research Foundation Flanders (FWO) through Project Grant G08861N and Odysseus programme Grant 90663.
Supporting Citations
References (yu_physiome_2011, thomas_comparison_2000) appear in the Supporting Material.