Complex- modes of plasmonic chain waveguides
Supplementary data for “Complex- modes of plasmonic chain waveguides”
Abstract
Nanoparticle chain waveguide based on negative-epsilon material is investigated through a generic 3D finite-element Bloch-mode solver which derives complex propagation constant (). Our study starts from waveguides made of non-dispersive material, which not only singles out “waveguide dispersion” but also motivates search of new materials to achieve guidance at unconventional wavelengths. Performances of gold or silver chain waveguides are then evaluated; a concise comparison of these two types of chain waveguides has been previously missing. Beyond these singly-plasmonic chain waveguides, we examine a hetero-plasmonic chain system with interlacing gold and silver particles, inspired by a recent proposal; the claimed enhanced energy transfer between gold particles appears to be a one-sided view of its hybridized waveguiding behavior — energy transfer between silver particles worsens. Enabled by the versatile numerical method, we also discuss effects of inter-particle spacing, background medium, and presence of a substrate. Our extensive analyses show that the general route for reducing propagation loss of e.g. a gold chain waveguide is to lower chain-mode frequency with a proper geometry (e.g. smaller particle spacing) and background material setting (e.g. high-permittivity background or even foreign nanoparticles). In addition, the possibility of building mid-infrared chain waveguides using doped silicon is commented based on numerical simulation.
1 Introduction
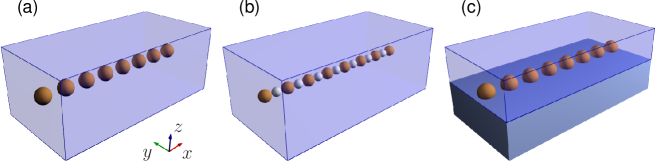
Optical waveguide formed by a chain of metal nanoparticles (chain waveguide in short) was proposed in [1] as an alternative to axially invariant plasmonic waveguides for shrinking footprint of photonic integrated circuits. Figure 1(a) illustrates a schematic picture of such waveguide. Plasmonic chain waveguide relies on coupled electromagnetic (EM) resonances in negative-epsilon particles to relay optical wave. The particles are usually in deep-subwavelength scale such that they can be treated as dipoles. That a chain of coupled dipoles can channel EM power without any radiation leakage contrary to stand-alone dipoles is in a sense an extreme case where radiation of a dipole is heavily affected by its environment. From waveguiding point of view, it can be argued that such propagation of EM wave in a periodic material system is fundamentally indifferent from those all-dielectric periodic waveguides presented in [2, 3, 4, 5], some of which were referred to as coupled-resonator optical waveguides (CROWs) or sub-wavelength grating waveguides. What make the waveguides under current investigation distinct are the “plasmonic” nature of the modes as well as the strong material dispersion, and thereby loss, usually associated with negative-epsilon materials.
Plasmonic chain waveguide in its simple setting has been studied mostly through theoretical modeling [1, 6, 7, 8, 9, 10, 11, 12, 13] and, in fewer occasions, through experiments [14, 15, 16, 17, 18, 19, 20, 21]. There are several ways to prepare chain waveguides. The standard approach is to use electron-beam lithography (EBL) combined with lift-off process to pattern metal nanoparticles [14, 15, 18]; the method produces nanoparticles with residual surface roughness and has difficulty in controlling feature size below 10 nm. Alternatively, chemists can routinely synthesize noble metal nanoparticles of preferred geometry and then let them self-organize on a pre-patterned (chemically or topographically) substrate [19, 17, 21, 22]. Especially, self-assembly of colloidal particles on wrinkled elastomeric template [21, 22] has produced chains with 20 and even more gold nanoparticles with fairly homogeneous particle spacings ( nm). Very recently, based on the DNA origami method[23], there have been several work demonstrating well-structured plasmonic chains with gap size precisely controlled at sub-10 nm level[24, 25, 20, 26]. Nanotechnology is seemingly on its way to make perfect chain structures. However, a thorough knowledge of their ultimate waveguiding performance, despite previous theoretical work, can hardly be readily looked up.
Existing understanding of dipole-based fundamental chain modes based on previous work [1, 6, 7, 8, 9, 10, 11, 12, 13] is summarized as follows. Unlike uniform waveguides like optical fibers, the resonant nature of chain waveguides determines that light propagation in such waveguides is relatively narrow-band, with transmission frequencies decided roughly by the resonant frequencies of individual nanoparticles. Depending on major polarization, there exist two types of low-order chain modes: transverse mode (T mode) with electric field majorly directed normal to waveguide axis ( in this work, Fig. 1) and longitudinal mode (L mode) with electric field majorly directed along waveguide axis. T mode appears in a degenerate pair since the waveguide is rotationally symmetric with respect to the waveguide axis. The L mode is unique for chain waveguides based on negative-epsilon materials; its polarization is seemingly incompatible with the transverse-EM (TEM) nature of light. Both T and L modes can be deep-subwavelength (yet it was not pointed out when such tight guidance can be obtained). Due to almost inevitable lossy nature of all negative-epsilon materials, guided modes in chain waveguides tend to have a large propagation loss. Precise calculation or demonstration of propagation loss, especially its wavelength dependence, was very scarce. In [1], it was found after geometrical optimization that propagation length for a silver chain waveguide with a period of 75 nm in vacuum is as short as m at near-ultraviolet (UV) wavelength. In the latest experimental endeavor [20], a gold chain waveguide was shown to have a propagation loss (L mode) of 0.8 dB per 50 nm (which is about one period size), apparently too much for information-transfer applications. Another recent work [25] demonstrated that adding a silver nanoparticle in between two gold nanoparticles can increase energy transfer between the two gold particles. The latter naturally opens up a question whether a hetero-plasmonic chain waveguide, or one chain with interlacing gold and silver particles (Fig. 1b), can potentially have a propagation length fulfilling practical application needs.
To rigorously analyze a plasmonic chain waveguide is certainly not a trivial numerical task. Previously dominant analysis methods include quasi-static dipole approximation with damping correction at optical frequency [8], and eigen-decomposition method in [9, 13, 12]. The dipole approximation method derives complex frequencies as eigenvalues. For a certain mode, the imaginary part of frequency denotes its lifetime. Wave number or propagation constant of a mode is read from computed mode pattern. Such mode analysis corresponds to a situation where a chain is uniformly excited by a plane-wave EM field, whereas in waveguiding problem one is more interested in finding a complex wave number with a given real frequency (as laser sources usually have). The imaginary part of denotes spatial decay of a mode along the waveguide. The eigen-decomposition methods solves for scattering spectra against frequency and wave number, both in real values. The width of a band in frequency is interpreted as mode quality. The iterative calculations of scattering spectra can however be a lengthy process. To the best of our knowledge, there has been very few reports on direct solution of complex- modes in chain waveguides with real frequency as input. The only work doing such direct calculation is found in [10, 11], where a semi-analytical method was formulated using Mie theory with lowest-order approximation. All the approaches mentioned above by default only handle waveguide made of identical nanoparticles, usually spherical. Furthermore, the methods usually have difficulty in including a substrate. The current work aims to use an empirical mode solver based on finite-element method (FEM) to study guidance properties of chain waveguides in a broader context. The numerical mode solver is built upon [27] with incorporation of perfectly matched layers (PMLs)[28] for solving complex wave number in a restricted direction from a real frequency input. As the method is fully numerical, it can handle any particle geometry or material composition in a unit cell, including multiple dissimilar particles.
It shall be pointed out that most experimental and some theoretical work focused on chains made of a few particles (e.g. [29, 16, 20, 21]). Such short chains, owing to reflections at two ends, support Fabry-Pérot resonances; consequently, a single propagating mode in an originally infinitely periodic waveguide becomes several modes appearing at distinct resonant frequencies. In other words, a single Bloch mode becomes quantized into several modes. This phenomenon happens particularly for the L mode in short gold chains [29, 16, 20, 21], where quantized L modes are referred to as L1, L2, L3, etc, depending on how many nodes in their field profiles. Furthermore, the quantized modes are labeled as super-radiant, sub-radiant or dark modes, depending on their overall dipole moments. It was hinted that sub-radiant modes facilitate longer plasmon propagation in chain waveguides because such modes do not suffer from high radiation losses [29]. Our focus in this work is on chain waveguides with infinite lengths. An infinitely extending chain sustains one L mode and one pair of degenerate T modes originated from coupling of particle dipole resonances. If their dispersion curves (relationship between frequency and wave vector) stay below light line of background medium, the modes do not suffer from radiation loss at all. By knowing the dispersion curves, we can then design termination of a waveguide properly so as to enhance resonance of a particular quantized L mode, either for enhanced or reduced radiation loss. As a matter of fact, for signal-transfer applications, reflection shall be minimized through proper design of in- and out-coupling elements to a chain waveguide; hence towards that purpose, focus on a short chain and discussion on quantized L modes might be misleading.
Through this work we aim to give an accurate description of how chain waveguides perform through rigorous Bloch-mode analysis. Several geometries and material settings that are possibly producible by current nanofabrication technologies are studied. The simulation results are cross-linked with published experimental findings if possible. The paper is organized as follows. In Section II we recapitulate general design rule for geometry selection in the context of plasmonic nanoparticles involved, as well as other considerations including convention for material permittivity and details for the numerical method, etc. In Section III, the investigation starts with waveguides made of material with a real, wavelength-independent negative-epsilon value. Such analysis with non-dispersive material was exercised quite often in dielectric photonic-crystal studies for capturing key modal characteristics. In such a simplified setting, one clearly identifies the “waveguide dispersion” (effect of geometry on modal dispersion, as commonly referred to in fiber optics community), instead of seeing mixed effect contributed also by variation in permittivity. In the meantime, modal properties at different frequencies can be related to distinct materials possessing such permittivity values, which motivates us to look for new negative-epsilon materials beyond the traditional noble metals. Section IV then looks into waveguides made of realistic dispersive materials, including silver and gold for visible-light guidance; a side-by-side comparison of these two types of chain waveguides was not reported before. Based on the understanding, we evaluate performance of hetero-plasmonic waveguide and comment on what is really gained (and lost) with this design. Under the same section, we also look into effect of change in homogeneous dielectric background and even more complicated environment — non-spherical particles sitting on a solid substrate (Fig. 1c). In addition, hinted by the geometry dispersion obtained in Section III, we investigate prospect of using doped semiconductors, an emerging plasmonic material for applications at mid-infrared (MIR) frequencies [30, 31, 32, 33], guiding light beyond visible and near-infrared (NIR) wavelengths. Conclusion follows in the end.
2 Geometry, material, and numerical considerations
As mentioned in [2], for a certain 1D periodic waveguide, there is a general upper frequency limit for guided mode. The limit is set by the crossing point between light line in background medium (i.e. ) and the first Brillouin zone boundary (). is wave number; is speed of light; and is refractive index of background. Correspondingly, vacuum wavelength for guided light in a certain chain waveguide has to be
The above equation can be used for determining an appropriate period , as the guiding wavelength for a chain waveguide is associated with the particle-plasmon resonance . Take silver as an example — silver has plasma frequency according to Drude-model fitting [34]. We consider in this study a background medium of refractive index (which can be associated with many glass materials). One has rad/s in frequency or nm in vacuum wavelength. For achieving light guidance at such wavelength, one shall use a period less than 106 nm. In the following study, the reference structure has period nm. Particle size, denoted by diameter , in our primary focus is chosen as 60 nm. Such a structure can accommodate guided modes, if existing, above vacuum wavelength of 240 nm. The above analysis assumes that guided modes will appear around , which is a rough estimation. As will be shown in Section IV, guided chain modes are dispersive, and can exist for silver-chain case at up to nm in vacuum wavelength.
Throughout this work, we deploy time-harmonic convention of . A lossy material shall have a relative permittivity value where the imaginary part must be negative. A forward-propagating wave along then has spatial dependence , where the complex wave number is expressed as . must be positive; is negative for decaying field, and positive for amplifying field.
FEM based on Galerkin weak-form formulation of magnetic-field wave equation [27] is implemented in COMSOL Multiphysics environment. One periodic unit is used in waveguide’s longitudinal (axial) direction, with four transverse sides enclosed by a PML layer to emulate open-boundary condition. Transverse simulation domain has dimension , including an outer PML with thickness at 250 nm. Mesh size ranges from 5 to 50 nm. Reflection symmetry in the transverse domain is utilized to reduce problem size. Discretization deploys quadratic vector element, which results in a number of unknowns usually close to a half million. By restricting wave vector (thereby also periodic boundary condition) along waveguide axis, one can find complex- propagating modes of a chain waveguide, given a real input frequency. Consequently, mode searching must be carried out in a complex wave-number plane. Only guided modes under the light line of background medium are searched. These modes are evanescent in transverse domain, therefore not contributing to crosstalk. There can exist resonantly guided modes above the light line, which are leaky. These leaky modes are blended in the continuum states of background medium; it is difficult to get them filtered out by the current method. High-order modes based on multipolar particle resonances can also be calculated; they are however not of focus in the current study.
3 Non-dispersive metal waveguide
3.1 Lossless chain
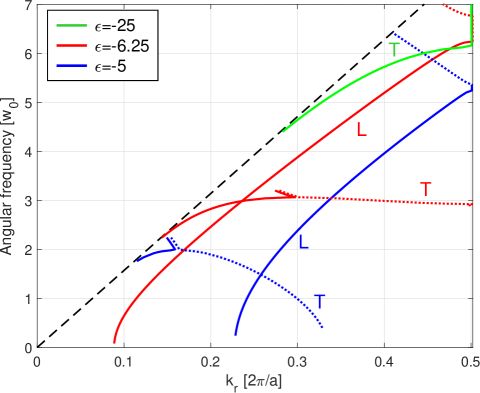
Before we look into realistic plasmonic metals, we study mode properties of chain waveguides made of fictitious non-dispersive “metal” particles. Three distinct permittivity values () are considered, with background medium . The calculated bands for modes identified (also called modal dispersion curves) are shown in Fig. 2. Note that when presenting mode dispersion curves of a periodic system made of non-dispersive material, one often uses scaling law — i.e. both frequency and wave number are normalized against some length metric (most often period of structure). In this work we consider dispersive metal materials; for ease of comparison, we choose to normalize angular frequency against rad/s. Wave number is normalized against ( is chain period), as conventionally done in photonic-crystal analyses. Wave number is in general a complex number, which is even true for all-real permittivity values used. Modes with frequency falling in photonic band gaps carry such a complex value, with its imaginary part denoting its degree of attenuation. As a common practice for periodic systems, dispersion plots in this work only show bands in the first Brillouin zone (BZ), with positive .
The figure reveals that the chain waveguide in general possesses both T and L modes over the examined frequency range. The dispersions of modes can be quite peculiar as compared to conventional all-dielectric waveguides. The dispersion curves of T modes are seemingly stemming out of the light line of background medium at small values. This feature is shared by modes in dielectric waveguides, and is fundamentally due to the fact that the T mode and the mode corresponding to the light line have the same TEM symmetry. Different from bands in dielectric waveguides, here in the plasmonic case, the T-mode dispersion curves can reach a maximum in frequency and thereafter exhibit a negative slope (represented by dotted-line sections). Negative-slope dispersion curves were previously considered for realizing light propagation with negative group velocity (-GV), and the plateau point in a dispersion curve for achieving “stopped” light with zero GV (0GV). However, as will be shown in Fig. 4, dispersion close to 0GV point or with small GV in general is highly susceptible to material loss. Note that at the 0GV position, T modes from +GV and -GV sections converge and become a degenerate pair; the pair branches out towards high frequency with a steep slope, at the same time their values turning into a complex-conjugate pair (Fig. 4). This is a signature that the modes from both +GV and -GV sides enter into a photonic band gap regime, as was also noticed in [10]. In contrast, for non-dispersive dielectric photonic structures, extremities of a band occurs at either center or edge of its BZ (or in general high-symmetry wavevector points). The L mode in Fig. 2 has a more intriguing dispersion profile. Firstly, L mode has no coupling with light line of the background medium. This is fundamentally due to the unique polarization nature of the mode. Secondly, if it does not reside in the radiation cone of the background medium (which we did not look into), the L mode persists over a very broad frequency range, even when frequency approaches zero. This suggests such a nanostructred chain waveguide (especially with small particle permittivity value) can potentially guide light with a very long wavelength. In addition, the guided mode can have a very large effective mode index ; therefore deep-subwavelength guidance can be ensured.
When the particle permittivity value increases negatively, in general, the dispersion curves shift to higher frequencies. This can be explained by the fact that the particles become more and more metallic at large negative permittivity values; thereby EM field is squeezed more out of the particles. Resonance is sustained by effectively smaller and low-index space surrounding the particles, hence the higher frequencies observed.
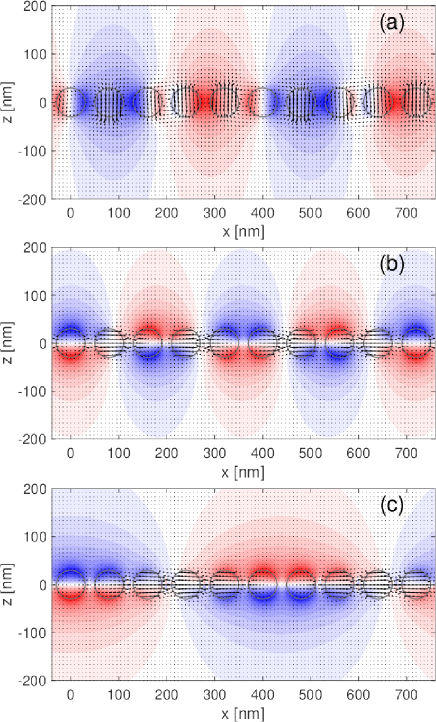
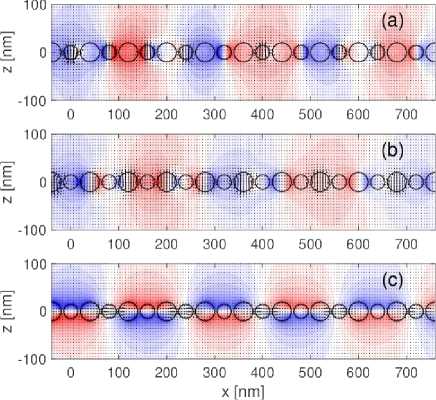
EM field patterns of three representative modes are presented in Fig. 3. Only cases for are plotted. For ease of interpretation, the fields are constructed over multiple cells based on Floquet theorem to reveal full-wavelength evolutions. Panels (a) and (b) show the T and L modes at , respectively. The frequency corresponds to nm. The plots visualize clearly orientation and coupling of particle dipoles, as well as wavelength of the guided wave (thereof and mode confinement). For the T mode in Fig. 3(a), it has a major magnetic field directed along direction, i.e. component (as shown by the colormap in the figure). Whereas, the L mode in Fig. 3(b) has its magnetic field curling around the waveguide axis. Comparatively, the L mode is somewhat similar to the so-called transverse-magnetic mode in cylindrical optical fibers. Figure 3(c) shows an L mode at relatively a low frequency of , corresponding to m. Deep-subwavelength guidance at the MIR frequency is then achieved. We will discuss the possibility of achieving such guidance using e.g. doped silicon in Section IV.
L mode is heavily affected by particle spacing. A study with a period of 100 nm (particle permittivity remains at -6.25) shows that the L-mode band is markedly blue-shifted, by at (where nm), whereas the T-mode band is almost unchanged (increase in frequency less than 2% at the same wave number). The corresponding dispersion curves can be found in “Supplemental data”. Smaller particle tends to increase band frequencies. This is confirmed with a calculation of dispersion curves for a chain waveguide with nm and nm, again with the same particle permittivity (see also “Supplemental data”).
3.2 Lossy chain
In the above sub-section, only lossless chain waveguides were studied. As a matter of fact, material losses associated with negative-epsilon materials are usually quite significant. Here we look into the effect of adding an imaginary part to the particle permittivity. Still, the considered particles will have non-dispersive permittivity. Similar to the previous sub-section, the focus is on a chain waveguide with nm, nm, and . A frequency-independent loss tangent of 0.01 is added to the material, i.e. . is negative for lossy material for the time-harmonic convention used.
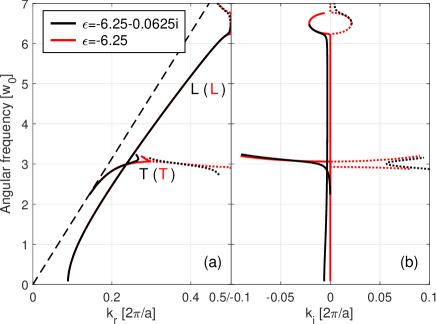
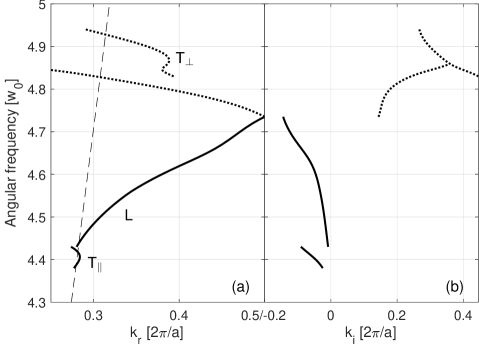
In Fig. 4(a), dispersion curves obtained for the lossless and lossy chain waveguides are compared. As mentioned previously, even with all-real permittivity values, the mode solver obtains modes with complex , more specifically for modes falling in photonic band gaps. When material loss is introduced, modes at all frequencies carry complex values. The imaginary part of () is plotted in Fig. 4(b). For a reason to be clarified in the following paragraph, our trace of dispersion usually stops when reaches 0.1. There are two observations worth commenting for Fig. 4. First (already pointed out in last sub-section), when loss is added, dispersion curve close to an originally 0GV point is highly affected. For the T mode, there are two 0GV points, one at the plateau point of its dispersion curve and the other at the BZ boundary. With material loss, the slopes of the dispersion curves at those positions tend to increase rather than to approach zero. At the same time, increases sharply. A direct consequence is that T mode with -GV (dashed black line) becomes highly lossy. The more useful T-mode dispersion curve (remaining +GV section, solid black curve) bends back in before reaching the plateau point, towards the originally degenerate mode-pair branch. The bending starts sooner as material loss increases. This observation suggests that small-GV modes are highly vulnerable to material losses; 0GV is simply not possible. Similar finding on effect of material loss on GV was also described in our previous investigation regarding a light absorbing structure [35]. The second observation is that dispersion-curve sections with negative slopes (dotted lines in Fig. 4) are associated with modes with amplifying amplitudes as they propagation in direction, which is manifested by their positive values. In the current study, such amplifying mode propagation applies to both the upper section of L band and the -GV section of the T band. The effects and consequences of such amplifying modes will be investigated in a separate study.
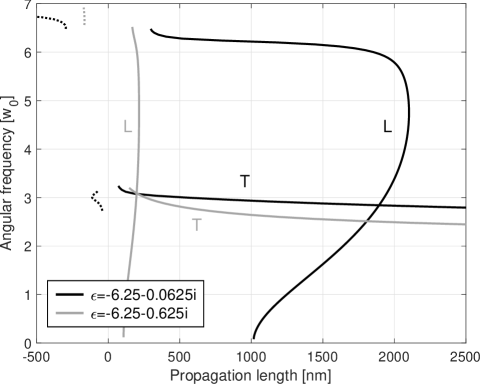
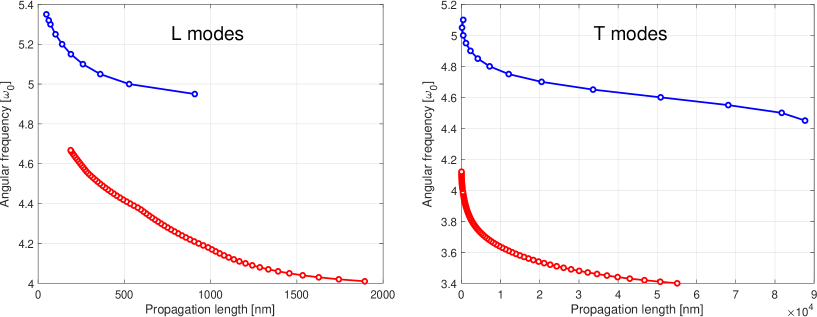
Propagation length of a mode (distance for mode intensity decreasing to its ) is calculated from imaginary part of wave number as , i.e. inversely proportional to . When amplifying modes are concerned, is positive and the distance in absolute value corresponds to a mode’s intensity increased to its times; we can refer to this length particularly as amplification length. For reference, a mode with with nm has a propagation length of 64 nm. This is already smaller than the waveguide’s period, rendering therefore such a waveguide almost useless at the frequency considered. We plot in Fig. 5 the propagation lengths for modes of the waveguide at two loss tangents (0.1 and 0.01). The plot can be examined together with Fig. 4. Amplification lengths are plotted in negative values. The T mode is found to be extremely sensitive to frequency. Its can be relatively long (beyond 1000 nm) in a short frequency range; however the long- modes are quite close to the light line and therefore their modal confinements are compromised. The L mode can sustain a consistent level of propagation length over a large frequency range. Comparing the propagation lengths at two loss levels, one finds the propagation length is roughly inversely scaled to the imaginary part of metal permittivity. Subwavelength mode confinement of L modes can be guaranteed as its dispersion curve can stay quite far below the light line, especially when small negative permittivity is used for particles (see Fig. 2). This observation hints that it would be interesting to look for new materials with small negative permittivities for subwavelength light guiding at especially low frequencies.
4 Real-metal waveguide
Gold and silver are popular plasmonic materials. Gold has its advantage of being chemically stable, while silver has lower loss at visible and NIR frequencies. Experimental demonstrations of chain waveguides are almost exclusively based on gold with the exception of [25] where a silver nanoparticle is incorporated between two gold particles to enhance energy transfer. In this section we evaluate chain waveguides made of these two classic metals. A rigorous comparison of the two types of chain waveguides has not been presented before. The data for silver and gold are taken from [34]; their analytical Drude models are not used since the fittings are more relying on long-wavelength data and having large discrepancy at near-UV wavelength regions. Experimentally measured permittivity data [34] show gold has a much higher loss than silver at UV and visible spectrum. For example, at nm silver has and gold has , i.e 10 times difference in terms of loss tangent. Later in this section, we will discuss performance of chain waveguides at MIR frequencies, by using heavily-doped silicon. Such MIR plasmonic material has its permittivity characterized by a Drude model, as to be presented therein.
4.1 Silver or gold chain
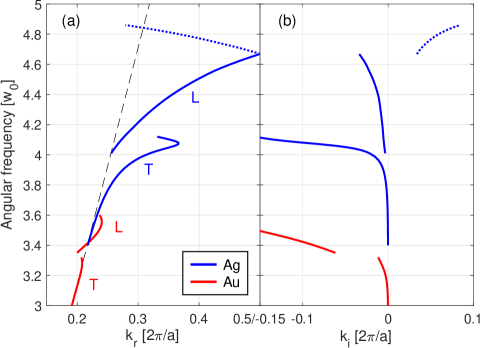
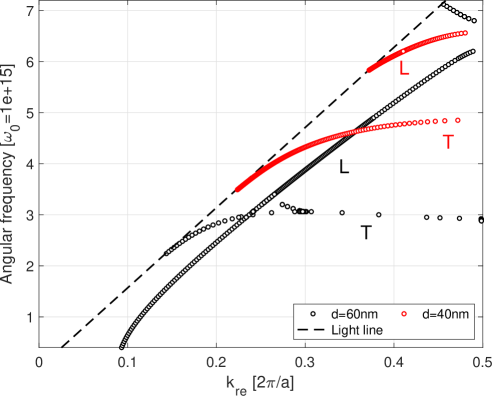
In Fig. 6 we lump together dispersion curves calculated for a silver chain waveguide (blue curves) and those for a gold chain waveguide (red curves), both with nm, nm, and . In general the dispersion curves for the silver chain waveguide appear at higher frequencies (3.4–4.8 , or 550–400 nm in free-space wavelength, respectively), while the modes for gold chain waveguides appear at 3–3.6 (630–520 nm in free-space wavelength, respectively). This is in agreement with the fact that the plasma frequency of silver is higher than that of gold. As suggested by permittivity values, the silver chain waveguide suffers less propagation loss compared to the gold counterpart. For the gold waveguide, the material is so lossy that its T-mode dispersion curve tends to fold back as soon as it stems out of the light line; as a result, the T-mode dispersion curve nearly laps over the background light line and the mode is therefore quite delocalized. The L mode has better confinement but it carries a around 0.1, hence difficult to channel light across a distance larger than a period. The silver waveguide is comparatively less lossy. At and below, the T mode has nm, with diverging as frequency decreases (to m at ). The L mode has nm when (until where nm). The results suggest that silver chain, especially its T-mode, can be potentially used for channeling light at limited visible wavelength ranges. That said, it should be pointed out that not all guidance is subwavelength; modes with long can be due to that they stay close to the light line, therefore with their fields extended in the background medium. One has to make a careful comparison to other types of waveguides, plasmonic or not, in terms of some figure of merit based on loss and mode confinement. The L mode tends to have deep-subwavelength guidance. However, it has to be used with extreme care, since it only achieves larger than 1000 nm propagation in a less than 20 nm wavelength window, which can be further subject to experimental imperfections.
It was pointed out in [29] that smaller inter-particle separation can increase plasmonic coupling and therefore increase propagation length of chain mode. Extremely small separation of 2 nm was used in a very recent demonstration[20], and the work claimed a L-mode propagation length of 190 nm for a gold chain. In comparison, the gold chain presented in Fig. 6, which differs predominately with a larger particle separation of 10 nm, can hardly propagate its L mode over one period. To verify the critical role played by inter-particle distance, here a gold chain with nm, (hence 2 nm gap), was modeled with our FEM solver. This structure is very close to what was experimentally characterized in [20]. In Section III, we concluded that a decrease in gap size will decrease mode frequencies (especially L mode), and a decrease in particle size will increase mode frequencies. Here the dominant effect is owing to the extremely small gap size. If we compare modal curves of the current structure to those of the gold chain in Fig. 6, its T-mode dispersion curve remains almost unchanged, whereas its L-mode dispersion curve down-shifts to 2.65–3.15 (710–600 nm in wavelength). Propagation length is found to be as high as 800 nm at 710 nm wavelength, which is reduced to tens of nanometers at short-wavelength end. Still, this propagation length is in average seven times better than that of the gold chain in Fig. 6. Our numerical finding in general supports the experimental observation of over 350 nm energy transfer in the gold chain presented in [20], although the dispersive nature of the modes was not mentioned in [20]. From our numerical investigation, the deciding factor for achieving longer propagation length (compared to the gold chain in Fig. 6) is that the L mode appears at a lower frequency where gold material has less absorption.
4.2 Hetero-plasmonic chain
In Fig. 1(c), a heterogeneous chain waveguide is illustrated, where two types of metal spheres are interleaved. Such design was motivated by [25]. It was proposed in [25] that by inserting a silver nanoparticle in between two gold nanoparticles one can facilitate more efficient energy transfer between two gold particles. The argument was tested with plasmonic trimer structures, which were realized by a delicate DNA-based self-assembly procedure (method also used in [20]). The loss reduction in energy transfer was argued through reduced bandwidth of observed dark-field scattering spectrum. Energy transfer across a longer chain beyond the trimer structure was not discussed. Here we extend the idea to a hetero-plasmonic chain waveguide, and numerically check its modal properties including propagation length. It is worth noting that, in a finite Au-Ag-Au trimer structure, it was the energy transfer process between two gold particles that was examined and was found to be more efficient compared to two directly coupled gold particles; in an infinite hetero-plasmonic waveguide, energy transfer can happen through hopping between silver particles, which also has to be considered.
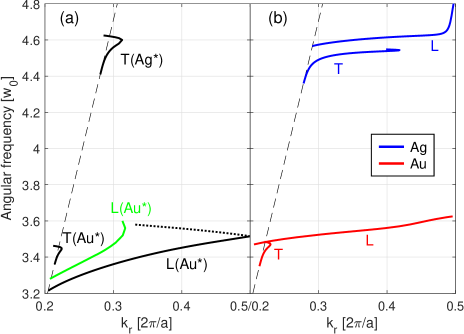
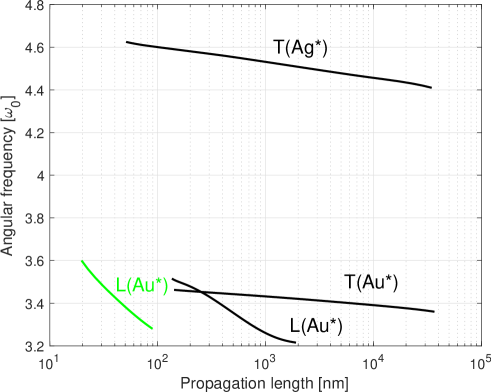
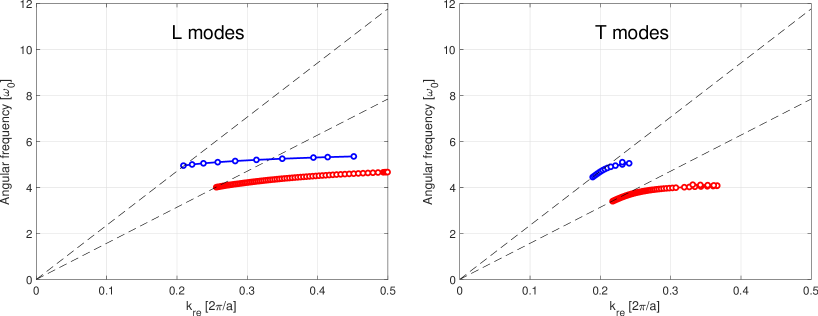
The hetero-plasmonic chain waveguide to be studied comprises of simultaneously silver and gold nanoparticles. Our FEM analysis uses a supercell with a period of 80 nm, including a gold particle of diameter 40 nm and a silver particle of diameter 30 nm (thereof a gap size of 5 nm). . The geometrical parameters as well as the background permittivity are very close to those studied in [25], where gold-to-gold distance was 78 nm and background was assumed to have . It turns out that the hetero-plasmonic waveguide under study is a very lossy waveguide — key modal features are killed by the presence of heavy material losses. In order to better explain the guidance mechanism, we first calculated its dispersion curves with imaginary parts of gold and silver permittivities reduced by a factor of ten 111In fact, many modal dispersion calculations in the current work started with reduced or totally suppressed material losses. Such practice facilitates quick location of the bands.. The resulted dispersion curves for the guided modes are shown in Fig. 7(a) by the black curves. In order to know the nature of the modes we plot three representative modal fields, one for each dispersion curve, in Fig. 8. Examination of the mode fields reveals that the two bands around correspond to T and L modes dominantly contributed by resonance in gold particles; and the mode around frequency is a T mode dominantly contributed by resonance in silver particles. The fact that one type of particles is clearly in resonance (dipolar) while the other is not (acting somewhat like spacers) suggests that a hetero-plasmonic waveguide can rather be treated as two superposed “homo-plasmonic” chain waveguides. Each homo-plasmonic chain contain a single-type particles with relatively large inter-particle spacings.
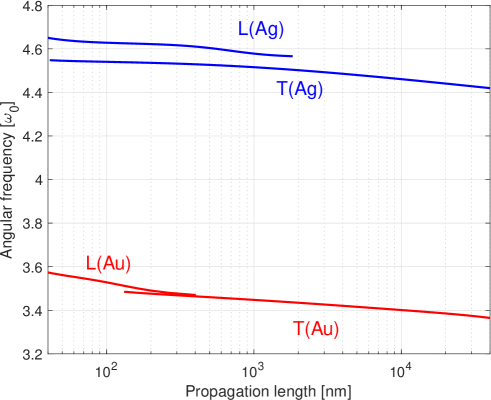
In Fig. 7(b) we present the dispersion curves of gold/silver homo-plasmonic chain waveguides, both with period nm but particle diameter nm for the gold case and nm for the silver case. The gold chain waveguide has T and L bands around , corresponding well to the lower set of modes in Fig. 7(a). The silver chain waveguide has T and L bands around with the T mode corresponding well to the upper T band in Fig. 7(a). The L mode in silver chain waveguide finds no counterpart in the hetero-plasmonic case. The lack of L mode for the hetero-plasmonic chain waveguide is due to the fact that gold is too lossy at the frequency. The effect of gold can be substantial as the electric field of expected L mode has to majorly pass through the gold particles. If one examines modes’ propagation lengths (see “Supplemental data”), one can conclude that: by superimposing two homo-plasmonic chains into one hetero-plasmonic chain waveguide, the chain modes supported by silver particles suffer higher losses with the L mode disappearing completely; for the gold chain, its T mode becomes a bit lossier, but the L mode can propagate much longer. More specifically, the L mode of gold chain (Fig. 7b) has propagation length ranging from tens of nanometers at its high-frequency end to 400 nm at its low-frequency end (); the corresponding L mode in hetero-plasmonic chain (Fig. 7a, solid black line) has 140 nm at its high-frequency end and 1900 nm at the low-frequency end (). We refer to the gold-dominated L mode in the hetero-plasmonic chain waveguide as L(Au∗) mode, and similarly for others.
In [25], the resonant modes were probed through optical scattering spectra. If translated onto our Fig. 7(a), their observed modes are within the light cone, close to the axis if it was nearly normal incidence). Their experiment recorded the dominant resonance peak [corresponding to L(Au∗) mode] shifted “from 549 nm for the AuNP (gold nanoparticle) homodimer to 586 nm for the heterotrimer structure”. These two peaks are respectively and in frequency, which project quite well to the curves that we have simulated. In [25], the increase in mode quality was explained through concepts such as “plasmonic hotspots” and “quasi-resonant virtual state” of silver particle, however we argue that the increase of mode quality is merely due to the fact that inclusion of silver particles decreases the L(Au∗) mode to a lower frequency where gold has smaller absorption loss. Losses of silver material does not adversely affect mode quality of the L mode significantly, since within that frequency gold has a loss tangent in average ten times as large as that of silver.
When metals take their 100% material losses, there is only one gold-dominated L mode remaining, as shown by the green curve in Fig. 7(a). Unfortunately its propagation length is found to be less than 100nm.
The phenomenon of enhanced energy transfer is geometry-dependent. Besides the structure examined above, we also looked into a hetero-plasmonic waveguide with gold and silver particles with identical diameter nm and a gap size of nm. The gold-dominated L mode disappeared, possibly due to too large separation between the gold particles.
Philosophically, it can be argued that that a hetero-plasmonic chain waveguide is an improved gold-chain waveguide or a deteriorated silver-chain waveguide.
We observed, through FEM analyses, that one can insert dielectric (e.g. silicon or TiO2) particles in a plasmonic chain to create hybrid plasmonic-dielectric chain waveguide. Whether such configuration has obvious advantage over singly-plasmonic chain waveguide is subject to further investigation.
4.3 Background medium and substrate
The initial investigations on plasmonic chain waveguide used air (or vacuum) as background medium [1, 8], while we have so far focused on dielectric (glass) background. To see the effect of background, we calculated dispersion curves of T and L modes of a silver-in-air chain waveguide with nm and nm (see “Supplemental data”). Compared to the corresponding curves of the silver-in-glass chain waveguide (Fig. 6), both bands experience a blue-shift in frequency when air is used. The respective shifts are roughly 26% for the T mode and 18% for the L mode, such that two bands are crossing each other in the air-background case. Direct comparison of propagation losses is not simple, as in two cases both modes are dispersive: propagation loss is highly dependent on frequency for each mode. In general, use of air background does not markedly increase the propagation length of T mode; it actually shortens the propagation length of L mode as a result of more flattened dispersion curve of the mode. The L-mode band becomes more flat as a result of effectively shortened gap size between the particles — the chain mode is therefore made of more localized gap plasmons with less coupling among the “hot spots”.
Actual nanofabrication of chain waveguides can lead to a background that is more complex than a homogeneous medium. A more realistic version is a chain made of nanoparticles sitting on top of a dielectric substrate. Such geometry is common for chain waveguides made from the template-assisted self-assembly or DNA-linking process. Previously, the author and his colleagues have reported experimental demonstration of arrayed gold nanoparticles [36, 37, 38] on a dielectric substrate based on light-induced rapid thermal annealing of lithographically patterned rectangular metal patches. The gold nanoparticles can have perfectly spherical shape, except with flattened bottom, similar to droplets on a surface. The dome shapes are formed as a result of surface tension when they are melted. A chain waveguide made of such metal particles is schematically shown in Fig. 1(c). Inclusion of a substrate is problematic for previously used theoretical methods [8, 9, 10, 11, 12, 13, 16], but not for our FEM approach. We choose silver dome-shaped nanoparticles for the following case study. In passing, we comment that one can have other particle shapes like cubes and rods [22]. The chain waveguide we are to study has the following parameters: nm, nm, with a quarter of the sphere height truncated in the bottom. The substrate has . Rest of the background is air/vacuum.
The dispersion curves of modes identified as well as their magnitudes are plotted in Fig. 9. It is known that when a substrate is included, or when the particles depart from spherical symmetry, the degeneracy of the T-mode pair will be lifted. In other words, two T-mode dispersion curves will appear, one with major electric-field component directed perpendicular to the substrate ( mode) and the other with its major polarization parallel to the substrate while perpendicular to waveguide axis ( mode). The two T-mode dispersion curves are depicted in Fig. 9(a). mode appears at frequency around , lower than that of the mode (around frequency ). The mode has nm, which is due to the mode is closely coupled to radiation mode in the substrate material. The mode carries a negative GV in general; its has a quite large magnitude in average. The L mode exists in a relatively large frequency range with nm. Overall, the propagation lengths obtained are not encouraging for information transfer purposes. However, such structure has an exposed surface which can be further functionalized for enhanced nonlinear-optics and sensing applications, especially with the L mode exhibiting strong gap-plasmon resonances.
We mention that the waveguide geometry has not been optimized. It should be possible to tailor the particle shapes as well as to add more thin substrate layers for further tuning of mode characteristics.
4.4 MIR chain waveguide
The dispersion diagram in Fig. 2 hints that if one has a small negative permittivity () at infrared wavelength (e.g. , or correspondingly m), deep-subwavelength guidance of EM wave is possible. Such MIR waveguides can be extremely interesting for integrated gas sensors. Here we propose that one can possibly use heavily doped silicon to achieve the desired negative permittivity and consquently a MIR chain waveguide. It is already known that doped semiconductors can become metallic at long EM wavelengths. Drude model can be used for describing permittivity of doped silicon, as , where is permittivity at high-frequency limit, is plasma frequency, and is collision time of free carriers. Plasma frequency is calculated as with doping concentration, elementary charge, effective mass of free carrier, and vacuum permittivity. Following the numerical values adopted in [30], we choose -doped silicon with and ( is electron mass). Doping concentration chosen for the following case study is at . Electron collision time can calculated from measured carrier mobility as . in [30] was stated as at the mentioned doping concentration, which led to fs. We find that with this collision time, Si permittivity has an imaginary part comparable to its real part, which is too lossy for making a waveguide. It was reported in [39] that electrons’ mobility can increase significantly at lower temperature. At a doping concentration of , increases from at room temperature to over at 50 K. Although there were no explicit experimental data for higher doping concentration scenario, here for a theoretical exploration, we assume a certain low temperature can increase by a factor of eight for the considered doping concentration. Collision time increases correspondingly to ps. The overall objective of the setting, as inspired by Fig. 2, is to obtain a relatively small (less than 10) negative permittivity at MIR frequency such that deep-subwavelength MIR guidance can be realized using a chain waveguide made of such doped semiconductor materials. This idea can extended naturally to chain waveguide design at even longer wavelengths.
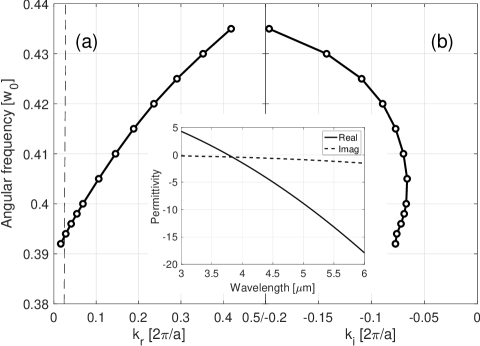
By using the standard geometry in this work, i.e. nm and nm, together with the above-mentioned particle material setting, we find an L mode appearing around frequency , as shown by Fig. 10a. Inset in Fig. 10 gives the real and imaginary parts of silicon’s permittivity at the relevant wavelength range. The background medium has standard . The imaginary part of the mode’s propagation constant (Fig. 10b) is however found to be quite large in general. After conversion, the corresponding propagation length hardly goes beyond 100 nm, with the longest at 96 nm when .
5 Discussion and Conclusion
To conclude, a versatile FEM-based mode solver was formulated and used to investigate modal properties of plasmonic chain waveguides in a few varieties. The investigation started from chain waveguides made of non-dispersive negative-epsilon materials. In this way, “waveguide dispersion” of both T and L modes were examined. The T modes can have dispersion curves with a local maximum in the first Brillouin zone; the curve section after the plateau point has negative group velocity and amplifying amplitude when material loss is present. While the T mode tends to exhibit flat band, the L mode tends to span over a large frequency range. Moreover, the L mode can stay far below the light line of background medium, which hints the possibility of achieving deep-subwavelength light guidance. Our analyses then showed the performance of chain waveguides made of realistic plasmonic metals. The silver chain waveguide, with the geometry and background considered ( nm, nm, =2.25), can be promising for achieving m light propagation, especially with its T mode. However, as such a mode can be quite extended in background medium, one has to motivate the use of a chain waveguide through some figure of merit based on loss and mode confinement. The L mode achieves m propagation length (but not over 2 m) in a very narrow wavelength range ( nm). Gold chains are only able to transport energy over hundreds of nanometers with extremely small (2 nm) inter-particle spacing. This is due to lowering in frequency of the L-mode band as inter-particle spacing shrinks (gold material suffers from less absorption at lower frequencies). This argument can be used to explain the increased energy transfer between gold particles in the so-called hetero-plasmonic chain waveguide. Effectively a hetero-plasmonic chain can be treated as superposition of one gold chain and one silver chain: inclusion of silver particles down-shifts the frequency of L mode of the gold chain, hence reducing its propagation loss; but the silver chain waveguide can be adversely affected by presence of gold particles. A chain waveguide sitting on a dielectric substrate was also examined, where we noticed degeneracy breakup of T-mode pair and dominant presence of L mode. At MIR wavelength, as a demonstration, we numerically showed that a chain waveguide with plasmonic particles being doped silicon can achieve deep-subwavelength light guidance, which can be useful for sensing or thermal applications.
In general, with realistic plasmonic materials, subwavelength chain modes have very limited propagation lengths. Even for a chain made of silver, the best plasmonic material among those we investigated, its subwavelength modes have propagation lengths comparable to the input light wavelength in free space. Despite heavy losses, chain waveguides offers more degrees of freedom in engineering modal properties. Although not attempted in this work, there should be room for improvements through geometrical optimization. Its deep-subwavelength mode confinement, locally enhanced field intensity, as well as its unusual polarization could be useful for various nanophotonic applications including sensing, nonlinear optics, and efficient coupling of radiation from quantum emitters, etc.
Acknowledgement
The Swedish Research Council (Ventenskapsrådet, or VR), through project no. 2016-03911 as well as its Linnaeus center in Advanced Optics and Photonics (ADOPT), is deeply acknowledged. The FEM computations were performed on resources provided by the Swedish National Infrastructure for Computing (SNIC) at PDC - Center for High Performance Computing at KTH. S. Macinkevicius is thanked for discussion on semiconductors.
References
References
- [1] M. Quinten, A. Leitner, J. R. Krenn, and F. R. Aussenegg. Electromagnetic energy transport via linear chains of silver nanoparticles. Opt. Lett., 23(17):1331–1333, Sep 1998.
- [2] Shanhui Fan, J. D. Joannopoulos, Joshua N. Winn, Adrian Devenyi, J. C. Chen, and Robert D. Meade. Guided and defect modes in periodic dielectric waveguides. Journal of the Optical Society of America B, 12(7):1267, 1995.
- [3] Amnon Yariv, Yong Xu, Reginald K. Lee, and Axel Scherer. Coupled-resonator optical waveguide: a proposal and analysis. Opt. Lett., 24(11):711–713, Jun 1999.
- [4] P. Cheben, D-X. Xu, S. Janz, and A. Densmore. Subwavelength waveguide grating for mode conversion and light coupling in integrated optics. Opt. Express, 14(11):4695–4702, May 2006.
- [5] Pavel Cheben, Robert Halir, Jens H. Schmid, Harry A. Atwater, and David R. Smith. Subwavelength integrated photonics. Nature, 560:565–572, 2018.
- [6] Mark L. Brongersma, John W. Hartman, and Harry A. Atwater. Electromagnetic energy transfer and switching in nanoparticle chain arrays below the diffraction limit. Phys. Rev. B, 62:R16356–R16359, Dec 2000.
- [7] Stefan A. Maier, Pieter G. Kik, and Harry A. Atwater. Optical pulse propagation in metal nanoparticle chain waveguides. Phys. Rev. B, 67:205402, May 2003.
- [8] W. H. Weber and G. W. Ford. Propagation of optical excitations by dipolar interactions in metal nanoparticle chains. Physical Review B, 70:125429, 2004.
- [9] Kin Hung Fung and C. T. Chan. Plasmonic modes in periodic metal nanoparticle chains: a direct dynamic eigenmode analysis. Optics Letters, 32(8):973, 2007.
- [10] Matteo Conforti and Massimiliano Guasoni. Dispersive properties of linear chains of lossy metal nanoparticles. Journal of the Optical Society of America B, 27(8):1576–1582, 2010.
- [11] Massimiliano Guasoni and Matteo Conforti. Complex dispersion relation of a double chain of lossy metal nanoparticles. Journal of the Optical Society of America B, 28(5):1019, 2011.
- [12] Jian-Wen Dong and Zi-Lan Deng. Direct eigenmode analysis of plasmonic modes in metal nanoparticle chain with layered medium. Optics Letters, 38(13):2244–6, 2013.
- [13] Paul J. Compaijen, Victor A. Malyshev, and Jasper Knoester. Engineering plasmon dispersion relations: hybrid nanoparticle chain -substrate plasmon polaritons. Optics Express, 23(3):2280, 2015.
- [14] J. Krenn, A. Dereux, J. Weeber, E. Bourillot, Y. Lacroute, J. Goudonnet, G. Schider, W. Gotschy, a. Leitner, F. Aussenegg, and C. Girard. Squeezing the Optical Near-Field Zone by Plasmon Coupling of Metallic Nanoparticles. Physical Review Letters, 82(12):2590–2593, 1999.
- [15] Stefan A. Maier, Pieter G. Kik, Harry A. Atwater, Sheffer Meltzer, Elad Harel ane Bruce E. Koel, and Ari A.G. Requicha. Local detection of electromagnetic energy transport below the diffraction limit in metal nanoparticle plasmon waveguides. Nature Materials, 2:229–232, 2003.
- [16] Steven J. Barrow, David Rossouw, Alison M. Funston, Gianluigi A. Botton, and Paul Mulvaney. Mapping bright and dark modes in gold nanoparticle chains using electron energy loss spectroscopy. Nano Letters, 14(7):3799–3808, 2014.
- [17] Christoph Hanske, Moritz Tebbe, Christian Kuttner, Vera Bieber, Vladimir V. Tsukruk, Munish Chanana, Tobias A. F. König, and Andreas Fery. Strongly coupled plasmonic modes on macroscopic areas via template-assisted colloidal self-assembly. Nano Letters, 14(12):6863–6871, 2014.
- [18] K. B. Crozier, E. Togan, E. Simsek, and T. Yang. Experimental measurement of the dispersion relations of the surface plasmon modes of metal nanoparticle chains. Opt. Express, 15(26):17482–17493, Dec 2007.
- [19] David Solis, Britain Willingham, Scott L. Nauert, Liane S. Slaughter, Jana Olson, Pattanawit Swanglap, Aniruddha Paul, Wei-Shun Chang, and Stephan Link. Electromagnetic energy transport in nanoparticle chains via dark plasmon modes. Nano Letters, 12(3):1349–1353, 2012.
- [20] Fatih N. Gür, Cillian P. T. McPolin, Søren Raza, Martin Mayer, Diane J. Roth, Anja Maria Steiner, Markus Löffler, Andreas Fery, Mark L. Brongersma, Anatoly V. Zayats, Tobias A. F. König, and Thorsten L. Schmidt. Dna-assembled plasmonic waveguides for nanoscale light propagation to a fluorescent nanodiamond. Nano Letters, 18(11):7323–7329, 2018.
- [21] Martin Mayer, Pavel L. Potapov, Darius Pohl, Anja Maria Steiner, Johannes Schultz, Bernd Rellinghaus, Axel Lubk, Tobias A. F. König, and Andreas Fery. Direct observation of plasmon band formation and delocalization in quasi-infinite nanoparticle chains. Nano Letters, 19(6):3854–3862, 2019.
- [22] Martin Mayer, Max J. Schnepf, Tobias A. F. König, and Andreas Fery. Colloidal self-assembly concepts for plasmonic metasurfaces. Advanced Optical Materials, 7(1):1800564, 2019.
- [23] Chad A. Mirkin, Robert L. Letsinger, Robert C. Mucic, and James J. Storhoff. A dna-based method for rationally assembling nanoparticles into macroscopic materials. Nature, 382:607–609, 1996.
- [24] Fatih N. Gür, Friedrich W. Schwarz, Jingjing Ye, Stefan Diez, and Thorsten L. Schmidt. Toward self-assembled plasmonic devices: High-yield arrangement of gold nanoparticles on dna origami templates. ACS Nano, 10(5):5374–5382, 2016.
- [25] Eva-Maria Roller, Lucas V. Besteiro, Claudia Pupp, Larousse Khosravi Khorashad, Alexander O. Govorov, and Tim Liedl. Hotspot-mediated non-dissipative and ultrafast plasmon passage. Nature Physics, 13(8):761–765, 2017.
- [26] Jingjing Ye, Seham Helmi, Josephine Teske, and Ralf Seidel. Fabrication of metal nanostructures with programmable length and patterns using a modular dna platform. Nano Letters, 19(4):2707–2714, 2019.
- [27] Marcelo Davanco, Yaroslav Urzhumov, and Gennady Shvets. The complex Bloch bands of a 2D plasmonic crystal displaying isotropic negative refraction. Optics Express, 15(15):9681–9691, 2007.
- [28] Giuseppe Parisi, Pierfrancesco Zilio, and Filippo Romanato. Complex bloch-modes calculation of plasmonic crystal slabs by means of finite elements method. Opt. Express, 20(15):16690–16703, Jul 2012.
- [29] Britain Willingham and Stephan Link. Energy transport in metal nanoparticle chains via sub-radiant plasmon modes. Opt. Express, 19(7):6450–6461, Mar 2011.
- [30] Richard Soref, Robert E. Peale, and Walter Buchwald. Longwave plasmonics on doped silicon and silicides. Opt. Express, 16(9):6507–6514, Apr 2008.
- [31] James C. Ginn, Robert L. Jarecki, Eric A. Shaner, and Paul S. Davids. Infrared plasmons on heavily-doped silicon. Journal of Applied Physics, 110(4):043110, 2011.
- [32] Nicolaas J. Kramer, Katelyn S. Schramke, and Uwe R. Kortshagen. Plasmonic properties of silicon nanocrystals doped with boron and phosphorus. Nano Letters, 15(8):5597–5603, 2015.
- [33] Hui Zhang, Runmin Zhang, Katelyn S. Schramke, Nicholas M. Bedford, Katharine Hunter, Uwe R. Kortshagen, and Peter Nordlander. Doped silicon nanocrystal plasmonics. ACS Photonics, 4(4):963–970, 2017.
- [34] P. B. Johnson and R. W. Christy. Optical constants of the noble metals. Phys. Rev. B, 6:4370–4379, Dec 1972.
- [35] M Yan. Metal–insulator–metal light absorber: a continuous structure. Journal of Optics, 15(2):025006, jan 2013.
- [36] Jing Wang, Yiting Chen, Xi Chen, Jiaming Hao, Min Yan, and Min Qiu. Photothermal reshaping of gold nanoparticles in a plasmonic absorber. Optics Express, 19(15):14726, 2011.
- [37] Xi Chen, Yiting Chen, Min Yan, and Min Qiu. Nanosecond photothermal effects in plasmonic nanostructures. ACS Nano, 6(3):2550–2557, 2012.
- [38] Xi Chen, Yiting Chen, Jin Dai, Min Yan, Ding Zhao, Qiang Li, and Min Qiu. Ordered Au nanocrystals on a substrate formed by light-induced rapid annealing. Nanoscale, 6(3):1756–1762, 2014.
- [39] C. Jacoboni, C. Canali, G. Ottaviani, and A. Alberigi Quaranta. A review of some charge transport properties of silicon. Solid-State Electronics, 20(2):77 – 89, 1977.
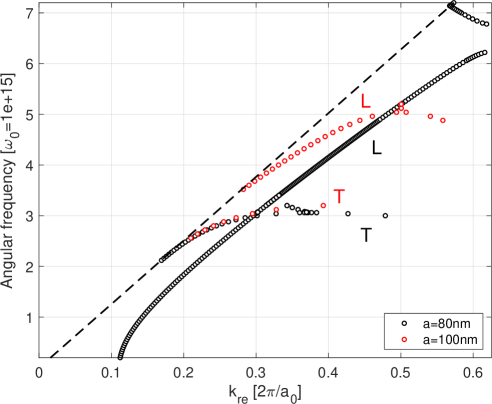
The dispersion curves in Fig. 11 show the effect of gap between nanoparticles. With an increase in gap size (or period while particle size is not changed), T mode is not affected much but L mode experiences in general a marked increase in frequency. Nanoparticles have non-dispersive permittivity with , and diameter nm. Two gap sizes are studied: 20 nm (i.e. nm, presented in main text) and 40 nm (i.e. nm). Note that the normalization length for wave number is nm in both cases.
The effect of particle size is shown in Fig. 12. Nanoparticles have non-dispersive permittivity with and fixed period nm. Two particles sizes are simulated: 60 nm (presented in main text) and 40 nm. Normalization length for wave number is nm in both cases. Smaller particle size increases mode frequencies.
The propagation lengths of modes supported by the hetero-plasmonic waveguide are shown in Fig. 13. This figure is complementary to Fig. 7(a) in the main text.
It is argued in the main text that the hetero-plasmonic chain waveguide can be treated as two constituent “homo-plasmonic” chain waveguides. The propagation lengths of modes supported by two corresponding “homo-plasmonic” chain waveguides are shown in Fig. 14. This figure is complementary to Fig. 7(b) in the main text.
Dispersion curves of T and L modes for a silver-in-air chain waveguide are shown in Fig. 15. The curves are directly compared to the case with a dielectric background (=2.25). The chain waveguide has geometry of nm and nm. Use of air background shifts the modes to higher frequencies, where silver experiences higher material loss.
The corresponding propagation lengths for modes in the silver-in-air chain waveguide are presented in Fig. 16. They are compared directly in the figure against propagation lengths for modes in a silver-in-dielectric waveguide sharing the same geometry.