Deal-Grove Oxidation and Nanoparticle Adhesion – an AFM Study
Abstract
We study the formation of nanometer thick oxide layers around nanoparticles (plateaus) in a wet nitrogen environment over days. We determine both the plateau height and the lateral force needed to remove the particles with an atomic force microscope (AFM). The height is well described by the Deal-Grove model for a thermally activated diffusion limited oxidation process. Furthermore, we observe that height and force appear to be correlated suggesting that the rise in adhesion forces is mainly governed by an oxidation process. Since the plateaus are the result of a change in the chemical structure, the surface remains permanently altered even after the removal of the nanoparticles. This observation is of great importance for many applications requiring smooth silicon surfaces, such as photolithography, where small contamination can cause the observed oxidation process and significantly increase the surface roughness.
I Introduction
Recent technological advances have made understanding the process by which nanoparticles adhere to surfaces of greatest importance bib:Carrillo ; bib:Tian2017 ; bib:Tian2018 ; bib:Tian2018PhysChem . Devising means to reduce the force with which nanoparticles stick to surfaces, is crucial in many applications. In photolithographic systems, for instance, small particles may lead to undesired light scattering causing intensity losses and interference which can destroy or damage the device geometry. In other fields the opposite, strong particle adhesion, may be desirable bib:Haun ; bib:vdMaaden ; bib:Lamprecht .
In our study, we focus on adhesion in the model system of spherical silica nanoparticles on a silicon surface, which is of particular interest in the aforementioned applications. Frictional aging has been the focus of recent studies bib:Li ; bib:Tian2017 ; bib:Tian2018 ; bib:Tian2018PhysChem examining rate and state friction laws in slide-hold-slide experiments with an atomic force microscope. Multiple processes contributing to the adhesion have already been identified, ranging from a thin water film on the surface bib:opitz , as well as the formation of a water meniscus bib:Kwon between particles and surface, to electrostatic interaction or chemical reactions bib:ranade ; bib:Li .
An important aspect regarding the adhesion mechanism we claim stems from the oxidation of the surface around the particles. Oxidation of silicon surfaces in general has been widely researched starting from Deal and Grove in 1965 Deal and Grove (1965) describing the thermally activated, diffusion limited oxidation. Oxide growth has been investigated experimentally in different temperature regimes Deal and Grove (1965); bib:Deal , among other things at room temperature bib:Morita . They identified the presence of water and oxygen as crucial ingredients for the growth process under these conditions. The chemical components forming in the reaction have been analysed by Ling et al bib:Ling showing that not only oxides but also hydrogen compounds are created. The kinetics of contributing reactions were studied theoretically by Lora-Tamayo et al bib:Lora-Tamayo1978 . Furthermore, Gould et al showed that cleaning agents also have an impact on the oxide growth bib:GouldIrene . Applications of a controlled oxide growth in electrical insulators were researched by Ohmi et al bib:Ohmi .
While the subject of all of these studies was the growth of extended oxide layers, we report the local formation of oxide layers of nanometer thickness, which we dub plateaus, beneath and around nanoparticles in a wet nitrogen environment at room temperature. They also grow in ambient air. The result is a permanently damaged surface with an increased roughness.
Using atomic force microscopy (AFM), we determine the plateau height as function of the storage time over days. We show that the growth height is compatible with the Deal-Grove model. In addition, we quantify the interactions between particle and surface by measuring the lateral force needed to remove a single particle with an AFM tip in contact mode. We demonstrate a correlation between lateral force and plateau thickness suggesting that the oxidation is a major contributor to the particle adhesion.
II Experimental Procedure
Sample Preparation: The samples are prepared on silicon wafers bib:si-mat with an epitaxial grown surface layer covered by their native oxide layer. They are coated with a diluted solution of bib:siSolution sized silica nanoparticles through spin coating. This yields samples with mainly solitary nanoparticles decorated on the surface ideal for individual manipulation and measurement.
Measurements and Data Processing: In order to obtain good statistics and high reproducibility for both the lateral force and the plateau height measurements, we use an automated procedure. The experiments are performed with Bruker’s AFM Multimode V equipped with silica cantilevers bib:brukerAFM .
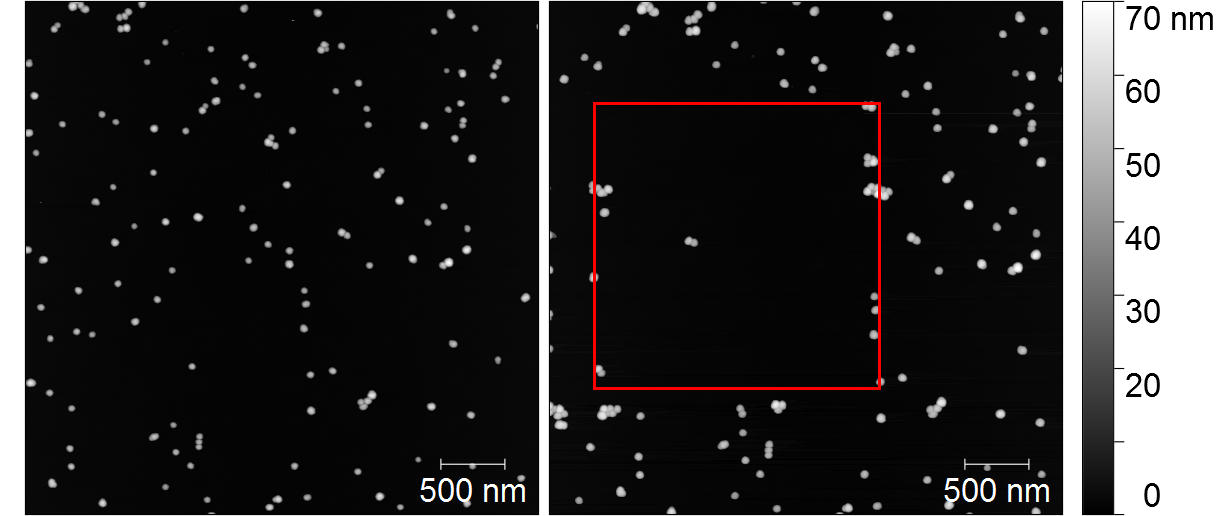
After a first tapping mode image providing an overview and means of orientation, a smaller measurement region is chosen in which many solitary particles are located. Secondly, a contact mode measurement is performed in this region with a scan line separation corresponding to the apparent diameter of the beads thus ensuring that most particles will only be hit once and ideally no particle is missed. This way, the nanoparticles are pushed out of the measurement region. The first peak in the recorded lateral force corresponding to the first hit of a particle is identified from this data as lateral force associated with the removal of this particle. Finally, a second tapping mode image of this particular region gives an overview of the particle removal and allows to identify the height of the plateaus underneath the particles.
Basic post processing to correct image artefacts like bow and tilt is done with gwyddion bib:Necas2012 , the data processing takes place in Mathematica bib:Mathematica . Following the correction of an offset in the force resulting from a tilt of the AFM tip induced by dynamic friction, the maximal peak in the lateral force is determined. Obtaining the plateau height requires more finesse. While the approximate region of the individual plateaus can be determined via inbuilt Mathematica component detection methods, the actual plateau height can be determined accurately from a fit. Since we studied the regime of small heights where the average plateau height stayed below , the tip broadening washed out any structure on and around the plateaus so that a parabola fit accurately reproduced their shape. The plateau height is then given by the maximum of the parabola and the corresponding error is determined from the fit errors and parameters. This procedure allows the very precise calculation of the plateau height so that heights below can still be resolved despite the adverse signal-to-noise ratio for such small heights.
In order to achieve high temporal resolution, we performed measurements every or every few days. Both lateral force and height were measured at predetermined times over days. The number of measured particles per measurement day ranged between and particles. For most of the measurement days there were well over particles. This ensures meaningful statistics and allows the statistically significant determination of both the lateral force and the plateau height.
Storage: Between measurements the sample was stored in a wet nitrogen environment inside a desiccator. In order to flush out the ambient air, it was pumped out to create a vacuum. After closing the valve connected to the vacuum pump, the nitrogen gas was slowly released into the desiccator after passing through an ultra pure Millipore water bib:millipore reservoir thus creating a humid environment inside the vessel. The valve was closed once first signs of condensation are visible on the inside of the desiccator. This process was repeated three times in order to increase the purity of the gas mixture.
Both storage and measurements were carried out at an ambient temperature of approximately . The sample was exposed to ambient air only for the comparatively short period of one hour during the measurements.
III Results
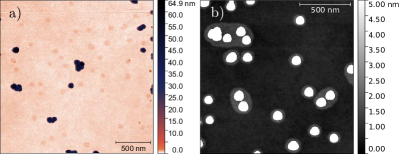
After the particle removal via the described method, plateaus become visible in the AFM image in the places of the particles, see Fig. 2a).
for the square-root law and in
for the linear law. As seen from the inset, both p-value and Akaike information criterion (AIC) bib:Akaike are in favour of the square-root law.
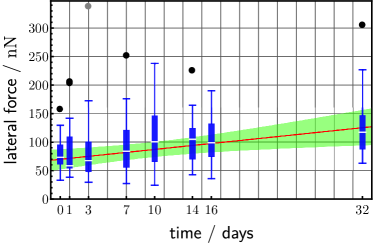
Figs. 3 and 4 show the development of lateral force and height with time, respectively. The increase in lateral force at the release of the particle may not be significant at first sight, but the fit of the lateral force to a linear model with single prediction bands proves that the increase is statistically significant. The large variation of the force values stems from the probabilistic scanning method bib:Geiger . The single prediction bands mark the region of confidence level. We chose a linear model as the most simple monotonically increasing function. Since the upper boundary of the single prediction band on day is lower than the lower boundary of the single prediction band on day , one can conclude with certainty that there is an increase in lateral force during this time span. We propose possible models for the functional dependence of the force on height (and time) below.
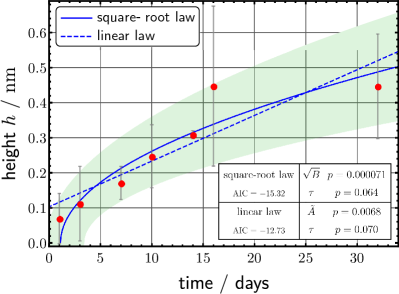
The plateau height also shows a significant increase, which we compare to the Deal-Grove model for the height of the oxide layer after time . It has two extreme cases: a square-root law for large time when diffusion dominates, and a linear law for short times when thermal activation plays the main role. and are coefficients characterising the velocity of the reaction depending on the effective diffusion constant and the partial pressure, and accounts for an initial oxide layer. For further details see the supplementary material.
In Fig. 4 we compare the two models. The linear law is unlikely since it predicts the existence of an oxide layer in place of the plateaus before the sample preparation. Both the p-values and the Akaike criterion obtained from the fit show that the square-root law agrees much better with the measurement results. Using this model, we determined the constant of the Deal-Grove model . As discussed in the supplementary material, this value agrees with literature results. This agreement of the Deal-Grove model with the development of the plateau height clearly is a strong indication that the growing material is silicon oxide. The prevalence of the square-root law over the linear contribution indicates that the process is dominated by diffusion and that the thermal activation time is less relevant which is plausible in this temperature and time regime.
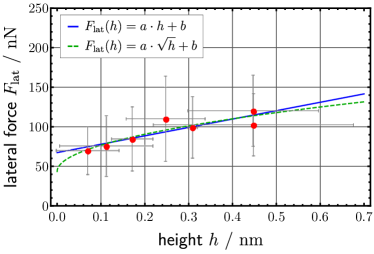
Correlation of Lateral Force and Plateau Height: Fig. 5 shows the lateral force corresponding to a particular plateau height. A clearly increasing trend is visible, for which we propose two possible functional dependences below.
,
whereas the proportionality to the circumference results in
.
To devise a relation between the plateau height and the measured lateral force upon particle release, we assume that the lateral force is proportional to the interaction forces between particle and contact surface bib:Geiger . Picturing a spherical particle lying in a spherical shell of silicon oxide growing around the particle, we suggest two intuitive options: 1) the lateral force is proportional to the contact area between particle and spherical shell or 2) it is proportional to the circumference of the shell, as for a droplet. Additionally, one may expect an offset in the force due to the formation of a water meniscus around the particles bib:ranade .
Geometrical considerations lead to a linear dependence of the lateral force on the plateau height for option one, whereas option two results in a dependence on the square root of the height. The two models can therefore be written as and , respectively. While both models agree with the data, the fit results do not show a statistically significant distinction of one over the other.
Since we attribute the increase in plateau height to the growth of an oxide layer around the particle and there appears to be a strong correlation between lateral force and height, we conclude that both effects are caused by the same mechanism, namely in this case the oxidation process of silicon.
Plateau Formation Mechanism: Apart from agreeing with the Deal-Grove model we justify our claim that the forming material is silicon oxide with additional observations. The plateaus are robust against multiple scans in contact mode with increased normal force, i.e. the adhesion or cohesion is strong enough to prevent the layers from being scratched off with a silica tip. This also rules out that these layers arise from the agglomeration of macromolecules stemming from a contamination. Such molecules should have already been visible in the AFM scans directly after the preparation, yet our samples appear clean. This is supported by our observations made under equal storage conditions but in a dry nitrogen environment with no oxidising substances present, in which the plateau formation process is suppressed. Hence, oxide growth is a viable explanation.
A second qualitative measurement series not reported here with storage in a pure oxygen environment also showed the growth of plateaus, albeit at a slower rate. This is consistent with a lower activation energy for the diffusion process in a wet environment rather than pure oxygen gas leading to a larger growth constant in the former case bib:Deal . The formation of plateaus in this environment marks oxygen as vital ingredient in the process and makes a contribution of nitrogen unlikely.
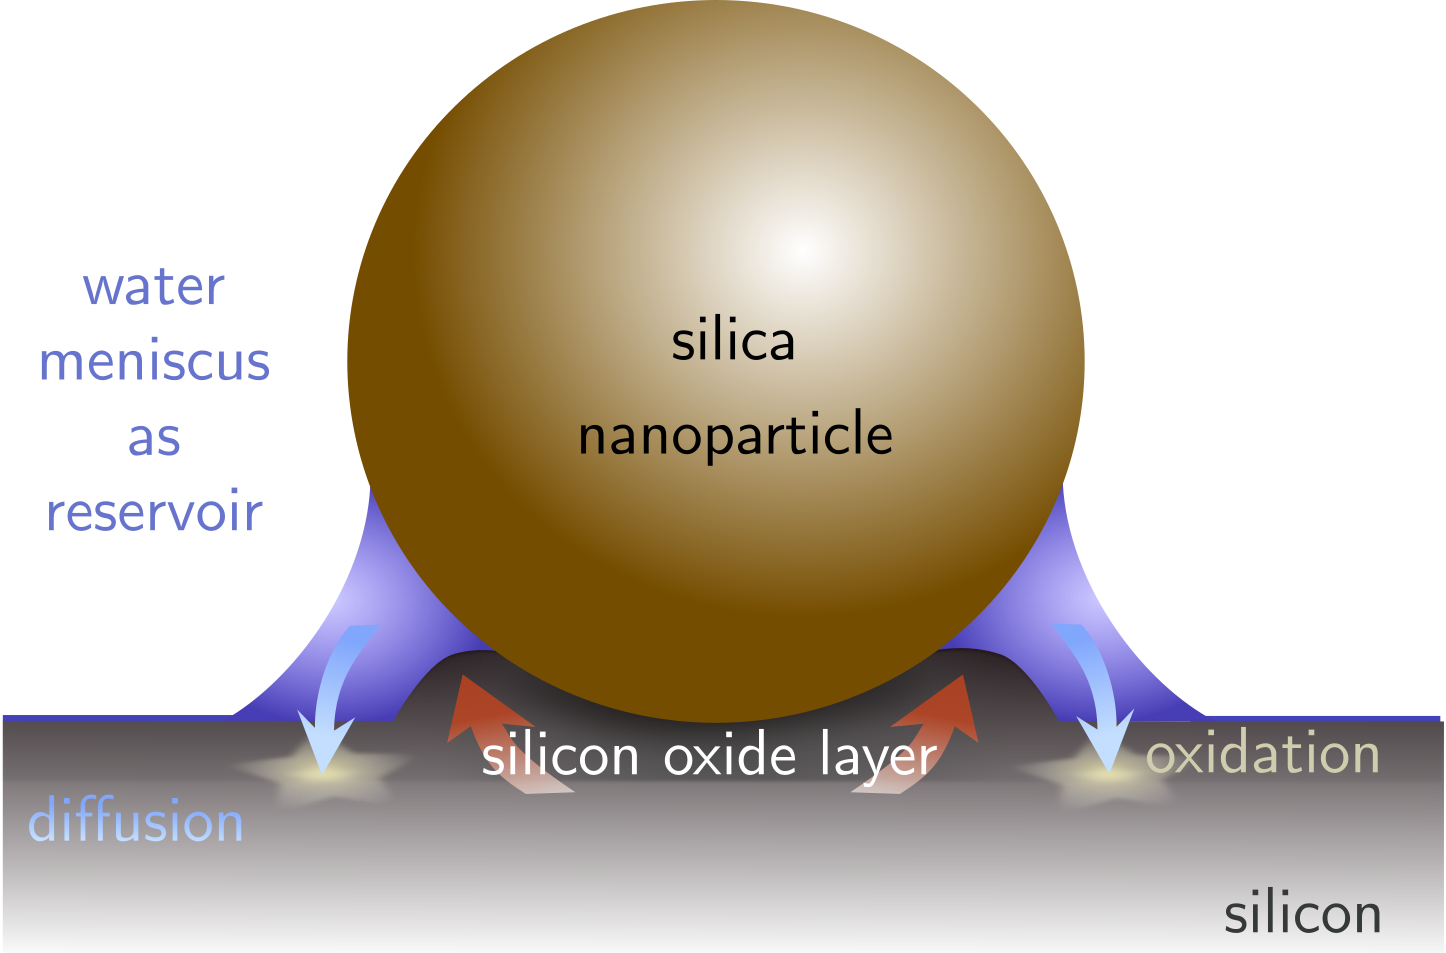
Concluding that the plateaus consist of oxide, we propose the following explanation for the localisation of these structures around the particles. Acting as condensation seeds, a water meniscus naturally forms as a ring around them between particle and silicon surface. The locally higher concentration of oxidising substance leads to a faster growth of oxide beneath the particles, see Fig. 6. The meniscus effectively acts as water reservoir for the diffusion of the water molecules through existing oxide layers to the native silicon, where an oxidation reaction takes place. Since the oxide grows into the bulk and since both and will be created, the large resulting tensions will result in the build-up of an amorphous silicon oxide layer and will lift up the surface around the silica particles.
As the nanoparticles also consist of silica, the formation of chemical bonds between particles and surface is likely, which leads to an increase in adhesion force in accordance with recent studies of frictional aging bib:Li ; bib:Tian2017 ; bib:Tian2018 ; bib:Tian2018PhysChem .
Once the plateaus have reached a certain height, the water meniscus will form at the flank of the plateau rather than between particle and surface leading to a growth of the plateaus in area rather than height. This is visible on samples stored in humid environments for many weeks as the one in Fig. 2b). On such samples, the plateaus reach heights on the order of - and extend over multiple hundred square micrometer.
While we observe a differential increase of the plateau height around the particles, we also expect oxidation to take place on the rest of the sample, but at a slower rate. According to bib:opitz silicon samples handled in ambient air are covered by a thin water film of approximately thickness. Being much thinner, the resulting water concentration in the surface layers leads to a slower growth as is proportional to the concentration Deal and Grove (1965). Consequently, we can detect the oxide height around the particles only in contrast to their neighbourhood, which is expected to grow much more slowly. This inhomogeneous growth leads to a considerable increase in surface roughness, which persists even after the removal of the nanoparticles.
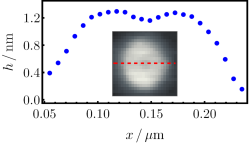
Due to the shape of the water meniscus, we expect the oxide to grow around the particle forming a spherical shell and we thus anticipate to see a dip in the middle of the plateaus. For small layer heights this is difficult to observe since the used AFM tips do not allow to resolve such fine spherical hollows very well. However, for larger heights it is indeed possible to see the aforementioned dip as shown in Fig. 7.
IV Conclusion
We have shown the growth of oxide structures (plateaus) beneath and around nanoparticles, as well as investigated the increase in lateral removal force depending on the storage time in a wet nitrogen environment. Moreover, we have demonstrated a correlation between lateral force and plateau height indicating that both processes are governed by the same mechanism. Since the plateaus likely grow due to an oxidation process, this points to a chemical reaction also being responsible for the increased adhesion of the particle.
Furthermore, we have shown that our results for the oxide growth are in accordance with the Deal-Grove model. Their original model described the growth of extended oxide layers with a homogeneous distribution of oxidising substance on the surface. Remarkably, the model still seems to apply here despite the low temperatures and the locally enhanced concentration.
While we observe a layer growth of only about in days, we expect the growth to continue and have observed heights of - on samples stored for weeks. A plateau thickness in the nanometer range is already likely to lead to diffraction and scattering losses in photolithography applications, where the wavelength is on the order of . Furthermore, the plateaus increase the surface roughness considerably. The chemical structure is altered locally due to the presence of the nanoparticles leading to the irreparable damage of the surface.
Therefore, this study shows that in order to maintain a smooth silicon surface it is necessary to keep them clean from dust and other particle sources and store them in the absence of oxidising substances, such as water vapour and oxygen.
V Acknowledgements
C.W. is grateful for the financial support received by the German Academic Scholarship Foundation. Furthermore, we would like to thank Ivana Sfarcic who assisted in the chemical lab, and the other members of the Institute for Experimental Physics at Ulm University. We are grateful to Kay-Eberhard Gottschalk (Institute for Experimental Physics, Ulm University) for fruitful discussions.
References
- (1) J.-M.Y. Carrillo and A.V. Dobrynin. Dynamics of nanoparticle adhesion. The Journal of Chemical Physics, 137(21):214902, 2012.
- (2) K. Tian, N.N. Gosvami, D.L. Goldsby, Y. Liu, I. Szlufarska, and R.W. Carpick. Load and time dependence of interfacial chemical bond-induced friction at the nanoscale. Phys. Rev. Lett., 118:076103, Feb 2017.
- (3) K. Tian, D.L. Goldsby, and R.W. Carpick. Rate and state friction relation for nanoscale contacts: Thermally activated prandtl-tomlinson model with chemical aging. Phys. Rev. Lett., 120:186101, May 2018.
- (4) K. Tian, N.N. Gosvami, D.L. Goldsby, and R.W. Carpick. Stick–slip instabilities for interfacial chemical bond-induced friction at the nanoscale. The Journal of Physical Chemistry B, 122(2):991–999, 2018. PMID: 29190097.
- (5) J.B. Haun and D.A. Hammer. Quantifying nanoparticle adhesion mediated by specific molecular interactions. Langmuir, 24(16):8821–8832, 2008. PMID: 18630976.
- (6) K. van der Maaden, K. Sliedregt, A. Kros, W. Jiskoot, and J. Bouwstra. Fluorescent nanoparticle adhesion assay: a novel method for surface pka determination of self-assembled monolayers on silicon surfaces. Langmuir, 28(7):3403–3411, 2012. PMID: 22224905.
- (7) A. Lamprecht. Selective nanoparticle adhesion can enhance colitis therapy. Nature Reviews Gastroenterology & Hepatology, 7(6):311–312, 2010.
- (8) Z. Li and I. Szlufarska. Multiphysics model of chemical aging in frictional contacts. Phys. Rev. Materials, 2:063602, Jun 2018.
- (9) A. Opitz, M. Scherge, S.I-U. Ahmed, and J.A. Schaefer. A comparative investigation of thickness measurements of ultra-thin water films by scanning probe techniques. Journal of Applied Physics, 101(6):064310, 2007.
- (10) S. Kwon, B. Kim, S. An, W. Lee, H.-Y. Kwak, and W. Jhe. Adhesive force measurement of steady-state water nano-meniscus: Effective surface tension at nanoscale. Scientific Reports, 8(1), 2018.
- (11) M.B. Ranade. Adhesion and removal of fine particles on surfaces. Aerosol Science and Technology, 7(2):161–176, 1987.
- (12) B.E. Deal and A.S. Grove. General relationship for the thermal oxidation of silicon. Journal of Applied Physics, 36(12):3770–3778, 1965.
- (13) B.E. Deal. The oxidation of silicon in dry oxygen, wet oxygen, and steam. Journal of The Electrochemical Society, 110(6):527–533, 1963.
- (14) M. Morita, T. Ohmi, E. Hasegawa, M. Kawakami, and M. Ohwada. Growth of native oxide on a silicon surface. Journal of Applied Physics, 68(3):1272–1281, 1990.
- (15) L. Ling, S. Kuwabara, T. Abe, and F. Shimura. Multiple internal reflection infrared spectroscopy of silicon surface structure and oxidation process at room temperature. Journal of Applied Physics, 73(6):3018–3022, 1993.
- (16) A. Lora-Tamayo, E. Dominguez, E. Lora-Tamayo, and J. Llabres. A new model of the thermal growth of a silicon dioxide layer. Applied physics, 17(1):79–84, Sep 1978.
- (17) G. Gould and E.A. Irene. The influence of silicon surface cleaning procedures on silicon oxidation. Journal of The Electrochemical Society, 134(4):1031–1033, 1987.
- (18) T. Ohmi, M. Morita, A. Teramoto, K. Makihara, and K.S. Tseng. Very thin oxide film on a silicon surface by ultraclean oxidation. Applied Physics Letters, 60(17):2126–2128, 1992.
- (19) si-mat, Kaufering, Germany.
- (20) solution of ; nanoparticles (Kisker Biotech GmbH & Co. KG, Steinfurt, Deutschland) are diluted with ethanol absolut (EMSURE, Merck Chemicals GmbH, Darmstadt, Germany).
- (21) AFM MultiMode SPM (Bruker MMAFM-2, 1997) (Bruker Corporation, USA) with Silicon cantilever OMCL-AC240TS-R3 (Olympus Corporation, Japan).
- (22) D. Nečas and P. Klapetek. Gwyddion: an open-source software for spm data analysis. Central European Journal of Physics, 10(1):181–188, Feb 2012.
- (23) Wolfram Research, Inc. Mathematica, Version 10.1. Champaign, IL, 2015.
- (24) Millipore, Merck Chemicals GmbH, Darmstadt, Germany.
- (25) H. Akaike. Information theory and an extension of the maximum likelihood principle. Proceedings of the 2nd International Symposium on Information Theory, pages 267–281, 1973.
- (26) D. Geiger, I. Schrezenmeier, M. Roos, T. Neckernuss, M. Lehn, and O. Marti. Measurement of nano particle adhesion by atomic force microscopy using probability theory based analysis. Journal of Physics D: Applied Physics, 50(20):205301, 2017.
Deal-Grove Oxidation and Nanoparticle Adhesion – an AFM Study
Supplemental Material
Appendix A The Deal-Grove Model
The Deal-Grove model Deal and Grove (1965) describes the thermally activated, diffusion limited growth of silicon oxide on a silicon surface by an oxidising gas or vapour. For the growth of an oxide layer of thickness Deal and Grove found Deal and Grove (1965)
| (1) |
where and are coefficients characterising the velocity of the reaction depending on the effective diffusion constant and the partial pressure of the oxidising gas or vapour. accounts for an initial layer on the sample. This equation simplifies for different time regimes: for small times, i.e. , one finds
| (2) |
whereas for large times as in this experiment the diffusion process dominates over the thermal activation and one recovers
| (3) |
Appendix B Comparison to Different Temperature Regimes
Originally, Deal and Grove observed a rapid oxidation growth process for wet oxygen at temperatures in a range between and . This raises the question, whether the observations can be attributed to the same mechanism. However, the following comparison of the temperature dependent coefficient from our measurement data and the respective coefficient extracted from the data given by Deal and Grove shows that they are of the same order of magnitude.
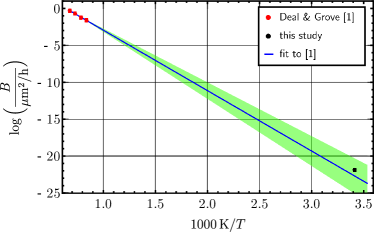
Deal and Grove determined the constant in their paper for wet oxygen at four different temperatures. They state the dependence of as
| (4) |
where is the effective diffusion constant, is the equilibrium concentration of the oxidant in the oxide and is the number of molecules of the oxidant inside a volume unit of the oxide layer Deal and Grove (1965). According to Henry’s law, the diffusion constant is proportional to the partial pressure of the oxidant. Doremus Doremus (1976) gives the temperature dependence of as
| (5) |
with the activation energy of the diffusion process. Fitting this temperature dependence in the form of
| (6) |
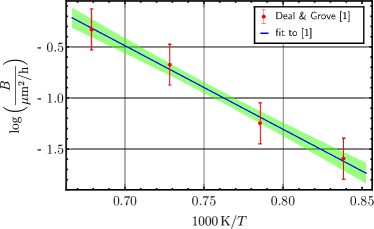
to the data determined by Deal and Grove and comparing it to the value of obtained in this study at , we find a very good agreement. Fig. 1(a) shows the fit containing the original data of Deal and Grove, while Fig. 1(b) shows a larger temperature range including our value of at room temperature. The error bars are too small to be visible in this scaling. The value of obtained in this study lies close to the line given by the fit through the data of Deal and Grove. Thus, it seems plausible that the same growth process takes place at room temperature, although more data points at different temperatures would be preferable to check this statement. In addition, we expect the same process to occur since there are no phase transitions of silicon within this temperature range.
The small discrepancy between the fit to the data by Deal and Grove and the result from this study may stem from different types of oxidants. Deal and Grove used wet oxygen, whereas wet nitrogen was used for this measurement series. In addition, one needs to take into account that a different partial pressure of the oxidant might influence the temperature dependence of . Nevertheless, the good agreement speaks in favour of oxidation taking place on our sample leading to the plateau growth in our case.
References
- Deal and Grove (1965) Deal, B. and Grove, A., Journal of Applied Physics 36, 3770 (1965), https://doi.org/10.1063/1.1713945 .
- Doremus (1976) Doremus, R., The Journal of Physical Chemistry 80, 1773 (1976), https://doi.org/10.1021/j100557a006 .