The effect of finite pore length on ion structure and charging
Abstract
Nanoporous supercapacitors play an important role in modern energy storage systems, and their modeling is essential to predict and optimize the charging behaviour. Two classes of models have been developed that consist of finite and infinitely long pores. Here, we show that although both types of models predict qualitatively consistent results, there are important differences emerging due to the finite pore length. In particular, we find that the ion density inside a finite pore is not constant but increases linearly from the pore entrance to the pore end, where the ions form a strongly layered structure. This hinders a direct quantitative comparison between the two models. In addition, we show that although the ion density between the electrodes changes appreciably with the applied potential, this change has a minor effect on charging. Our simulations also reveal a complex charging behaviour, which is adsorption-driven at high voltages, but it is dominated either by co-ion desorption or by adsorption of both types of ions at low voltages, depending on the ion concentration.
I Introduction
Electrical double-layer capacitors, or supercapacitors, are an important player on the market of energy storage devices. Supercapacitors store energy by electrosorption of counter-charge into the porous electrodes and provide high power densities and cyclability, but the stored energies are relatively low Miller and Simon (2008); Simon and Gogotsi (2013). To increase the energy storage, electrodes with subnanometer pores are used, which show anomalously high capacitances (per surface area) Raymundo-Piñero et al. (2006); Chmiola et al. (2006); Largeot et al. (2008) and hence high stored energies Kondrat et al. (2012). This anomalous increase of capacitance is due to the emergence of a superionic state Kondrat and Kornyshev (2011); Kondrat et al. (2011), i.e., screening of the electrostatic interactions in narrow conducting pores Rochester et al. (2013a); Goduljan et al. (2014); Mohammadzadeh et al. (2015). In this work we shall focus on electrodes with such narrow pores only.
Modelling plays a crucial role in understanding and predicting the properties of supercapacitors, such as capacitance, energy storage and charging times. There have been many models and methods developed, but they can be conventionally spit into two classes. One class consists of models that literary ‘mimic’ a supercapacitor, i.e., they consider an ionic liquid confined between two electrodes with porous structures, either with slit-shaped Vatamanu et al. (2010); Feng and Cummings (2011); Wu et al. (2012); Vatamanu et al. (2013, 2015) or cylindrical Vatamanu et al. (2010); Shim and Kim (2010) pores, or even featuring a complex pore network Merlet et al. (2012); Burt et al. (2016). However, since (typically molecular dynamics) simulations of such models are computationally demanding, they are necessarily ‘scaled-down’ as compared to their experimental counterparts. For instance, the pore length in a typical simulation is tens of nanometers at best, while in the experimental systems the pores can be micrometer long, as follows from the carbon particle sizes (see, e.g., Refs. Li et al. (2007); Dyatkin et al. (2016), and Ref. 11footnotemark: 1); likewise, the size of the region between the electrodes is of the order of nanometers in simulations, but it is hundreds of micrometers or millimeters in real supercapacitors.
On the other hand, there is a class of simplified models that consider an ionic liquid confined to a single pore, either slit-shaped Kondrat and Kornyshev (2011); Kondrat et al. (2011); Kiyohara and Asaka (2007); Kiyohara et al. (2010, 2011); Jiang et al. (2011); Jiang and Wu (2014); Dudka et al. (2016) or cylindrical Kornyshev (2014); Lee et al. (2014a); Schmickler (2015); Rochester et al. (2016). These models are likely to describe more closely the long pores of real porous electrodes 111While the electrodes with long well-defined slit pores exist Yang et al. (2013); Lukatskaya et al. (2013), extended long pores might not be present in some porous materials, such as CDCs, which consist of interconnected networks of different pores (see e.g. Ref. Oschatz et al. (2016)). However, although such a network can be described as a collection of shorter pores, the ionic liquid is nevertheless mainly present deeply in the porous carbons and far from the contact with the bulk electrolyte or pore closings. In this sense, infinitely extended pores can still be considered as good models for these porous materials too. We note, however, that such pore networks and surface roughness may lead to less structured ionic liquid configurations inside the pores, which can influence the charging behaviour., but their deficiency is that the effects related to the pore closing and opening are ignored and the charging dynamics are not straightforward to study. Often such simplified models can be treated analytically Kondrat and Kornyshev (2011); Kornyshev (2014); Lee et al. (2014a); Schmickler (2015); Rochester et al. (2016); Dudka et al. (2016), but also Monte Carlo (MC) simulations Kiyohara and Asaka (2007); Kiyohara et al. (2010, 2011); Kondrat et al. (2011); Rochester et al. (2016) and classical density functional theories Jiang et al. (2011); Jiang and Wu (2014); Wu and Li (2007) have been applied.
The main goal of this work is to connect these two types of models and to study the effects of finite and infinite pore lengths on the ion structure and charging. To this end, we take a variation of the model of a single slit nanopore of infinite length developed in Refs. Kondrat and Kornyshev (2011); Kondrat et al. (2011). We shall also present a new model for supercapacitors, which consists of two electrodes with slit nanopores; in contrast to other similar models Feng and Cummings (2011); Wu et al. (2012); Vatamanu et al. (2013, 2015), our model considers pores that are open on one side only (cf. Fig. 1a), i.e., we take into account the pore closings explicitly. We shall first show how the superionic state emerges in this model (Section II; in this section we also describe the details of both models and the methods used to study them). Then, we shall discuss how the parameters of the two models can be connected (Section III) and how to adjust the simulations and the analysis to make a meaningful comparison (Section IV). The results obtained by these two models are compared and discussed in Section V. In Section VI we discuss how the ion structure and charging behaviour depend on the pore wall-ion interactions. We summarize and conclude in Section VII.
II Models and Methods
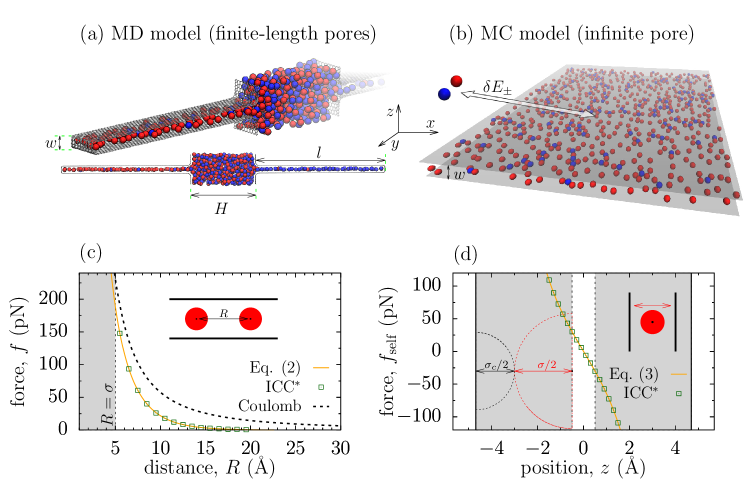
We compare two models of nanoporous supercapacitors. In one model we consider a supercapacitor that consists of two electrodes separated by a distance , with each electrode featuring a slit nanopore of the specified width and finite length (Fig. 1a). This model will be used in MD simulations as described below; we shall call it the MD model.
In addition, we consider a model consisting of a single nanopore, i.e., an ionic liquid confined between two parallel metal plates, which are infinitely extended in the lateral directions (Fig. 1b); this model will be treated by MC simulations and will be called the MC model henceforth. We apply a potential at the plates of the MC model (see Section II.3), which by symmetry corresponds to the applied potential between the two electrodes of the MD model.
In both models and in all simulations, we shall use the same pore width Å. We note that the pore width accessible to the ions is smaller, as will be discussed below.
II.1 Ionic liquid
In both MD and MC simulations, we have taken charged soft spheres to model an ionic liquid. The ion-ion soft potential was the repulsive-only Week-Chandler-Anderson (WCA) potential Weeks et al. (1971), . We recall that is the standard 12-6 Lennard-Jones potential cut at the ion-ion separation , where is the ion diameter, and shifted such that at ; this is to ensure that the corresponding force is a continuous function of .
The following parameters have been used in all simulations: Interaction parameter kJ/mol and the ion diameter Å. In the solvent-free case, these parameters give the pressure atm for the ion volume fraction (molar concentration M) and at temperature K.
II.2 Pore walls
In the MD model the electrodes have been constructed from carbon atoms, which, however, we modeled as WCA particles with the following parameters: Å and kJ/mol. The hexagonal structure of the pore walls was obtained by subdividing the surface into equilateral triangles and placing the atoms in their centers. A side length of Å provides an atom-atom bond length of Å, similar as in graphene. The pore entrance was curved with a radius of Å, and the pore closing was curved with a radius of Å.
In the MC model we neglect the pore wall structure and consider flat soft walls instead. To this end we propose the 10-4 Lennard-Jones (LJ) interaction potential
| (1) |
where and are the wall-ion energy and diameter parameters, is the two-dimensional number density of carbon atoms, and is the location of the wall. This potential is obtained by integrating the LJ inter-particle interaction potential over a surface of LJ particles, where the surface is infinitely extended in the directions.
In order to match the MC and MD models, we have fitted the interaction potential (1) to the averaged potential that an ion experiences when approaching an atomistic wall. We emphasize that (i) this fit is difficult to do accurately in the whole range of the wall-ion distances, and (ii) the atomistic wall-ion potential is not homogeneous in the lateral directions (Supplementary Fig. LABEL:si:fig:wall-ion-wca). We will discuss this in Section VI, where we also consider the case of hard pore walls with the accessible pore width Å for comparison.
II.3 Grand canonical Monte Carlo simulations
In the MC model a slit pore is infinitely extended in the directions (Fig. 1b), which is modeled by applying periodic boundary conditions in these directions. The electrostatic potential was applied to the pore walls, which amounts to setting the electro-chemical potential to , where is the elementary charge and is an energy of transfer of a ion from the bulk of a supercapacitor into the pore (assumed equal for anions and cations). Note that does not include the change in the ion’s self-energy (cf. Eq. (3)), and that its typical values lie between and Lee et al. (2016).
The electrostatic interaction energy between two ions confined in a metal slit pore is Kondrat and Kornyshev (2011)
| (2) |
where and are the ion charges ( in this work), is the lateral distance between the ions, are their positions across the pore, and is the dielectric constant (taken in this work).
An ion confined in a narrow conducting nanopore experiences an image-force attraction to the pore walls. For a slit metallic pore, infinitely extended in the lateral directions, this interaction energy can be calculated analytically Kondrat and Kornyshev (2011)
| (3) |
where is the position across the pore. Note that does not depend on the ion charge but only on its valency (taken in this work); thus, we shall omit index in .
The interaction potentials (2) and (3) constitute the superionic state. They were implemented in towhee simulation package Martin ; Kondrat et al. (2011) and grand canonical Monte Carlo simulations were performed using the Widom insertion-deletion move Widom (1963), translational move, and the molecular-type swap move Kondrat et al. (2011). We performed equilibration runs and up to production runs at temperature K.
II.4 Molecular dynamics simulations
MD simulations have been performed using ESPResSo simulation package esp ; Limbach et al. (2006); Arnold et al. (2013a) with the velocity-Verlet algorithm for integration and a Langevin thermostat (at temperature and damping constant ps-1) to model a NVT ensemble.
For constant potential simulations, we used the ICC∗ algorithm Arnold and Holm (2002); Kesselheim et al. (2010); Arnold et al. (2013b) in combination with the 3D-periodic electrostatic solver P3M Ballenegger et al. (2008). In the ICC∗ method, the induced ICC∗ charges are defined on a discretized closed surface, and their values are determined iteratively each simulation step. Since the standard P3M solver does not take into account the applied potential between the electrodes, we have additionally superimposed the corresponding external electrostatic potential, which has been pre-calculated numerically by solving the Laplace equation with the appropriate boundary conditions; this has been done iteratively on a equidistant lattice using a seven-point-stencil relaxation algorithm Press (2007).
To test how the superionic state emerges within the ICC∗ approach, we have calculated the force between two ions in the pore middle, and compared it with the force obtained from Eq. (2) as (note that ). Figure 1c demonstrates an excellent agreement between the two methods. We have also compared the force due to image forces acting between an ion and the pore walls obtained by the ICC∗ approach and from Eq. (3) as ; again the agreement is very good (Fig. 1d). We note however that the corresponding potential acquires an additional contribution due to periodicity (see Supplementary Fig. LABEL:si:fig:Eself), which can be corrected by considering larger systems. However, this shift in does not influence the ion-pore walls forces, as Fig. 1d demonstrates, and therefore the results of the MD simulations (i.e., it only shifts the energy level, but the energy differences remain the same).
III Non-polarized nanopores
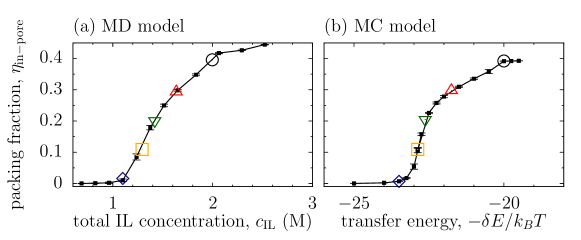
In order to facilitate a comparison between the two models (Fig. 1a-b), we have matched the in-pore ion packing fractions at zero potential, . We calculated this packing fraction as , where Å is the ion diameter and is the volume of a pore; here is the lateral area and the accessible pore width. In the MD model, unless otherwise specified, only the middle parts of the pores were taken into account when calculating , i.e., the entrance and the closing of the pores were excluded (see Section IV.1). Since is not known a priori and is expected to vary with the applied potential, for definiteness we took , where Å is the diameter of the carbon atom. The pore width Å gives Å. Note that this is the accessible pore width for a system with hard pore walls.
In the MC model, the pore occupation is controlled by the ion transfer energy . Figure 2a shows that the in-pore packing fraction decreases as increases, and the pore becomes more ionophobic Kondrat and Kornyshev (2016); Lee et al. (2016).
In the MD model, the in-pore ion packing fraction can be controlled by changing the total concentration of ions in a supercapacitor, . Physically this can be realized by varying the pressure in the case of neat ionic liquids or by varying the salt concentration in the case of electrolyte solutions. Figure 2b demonstrates that the pore becomes less populated as decreases. However, at extremely low concentrations our MD simulations predict the formation of ionic liquid clusters in the bulk electrolyte (i.e., between the electrodes), which influence the charging behaviour; we have therefore decided not to consider such cases in this work.
After having matched the pore occupancies at no applied potential, we perform voltage-dependent MC and MD simulations for the systems shown by symbols in Fig. 2.
IV Charging of nanopores of finite length (MD model)
There are two important parameters in the MD model that are not present in our MC system, viz. the pore length and the size of the bulk of a supercapacitor. In order to understand better their potential impact on charging, we first discuss how they influence the structure of an ionic liquid, in comparison to the MC model of a single infinitely-long nanopore.
IV.1 Ion structure
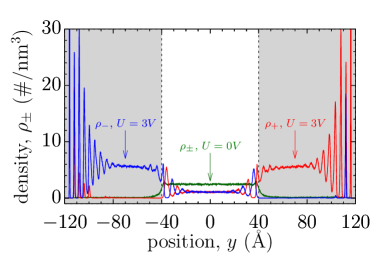
Figure 3 shows the average ion density profiles between the two electrodes for zero and non-zero applied potentials. We can make the following observations:
-
1.
The average ion density in the bulk electrolyte depends on the applied voltage. This implies that the chemical potential of the bulk ionic liquid changes with voltage, while it is taken constant in the MC model.
-
2.
Some co-ions become trapped near the pore closings on the time scales of our MD simulations. This means that the system has not reached equilibrium. Note that this is unlikely to happen in the MC model as we perform grand canonical simulations.
-
3.
The ions exhibit a clear layering near the pore closings and openings, while they seem to form a nearly homogeneous structure in the middle of a pore. However, for non-zero potentials the counter-ion density is not constant along the pore and increases from the pore entrance to the pore end. Clearly, in the MC model the average ion densities are position independent.
We shall now discuss how to correct the MD simulations to be able to approach more closely the single-pore supercapacitor models. We will see, however, that although points (1) and (2) can be corrected relatively easily, point (3) is more subtle and makes it difficult to compare the MC and MD models quantitatively.
IV.2 Bulk density calibration
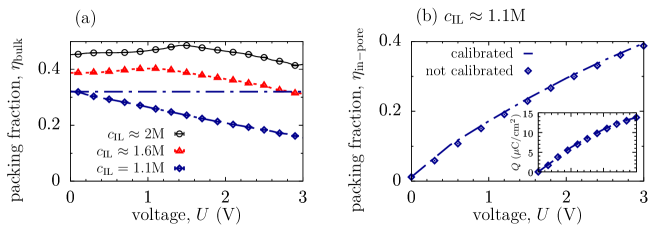
Clearly, also in experimental systems and commercially fabricated supercapacitors, the ion density in the bulk (i.e., between the supercapacitor electrodes) can vary with the applied voltage. However, the volume of a bulk region in these systems is typically large, as compared to the total pore volume, and this change is expected to be small. In MD simulations, the size of a bulk region () is often comparable to the pore size Feng and Cummings (2011); Wu et al. (2012); Vatamanu et al. (2013, 2015), and its effect on the bulk density can therefore be significant (Fig. 4a).
One way to deal with this problem is to consider systems with sufficiently large , which would, however, increase the computational costs accordingly. We have therefore taken a different route. We chose to calibrate the total number of ions in a system during equilibration runs each time the voltage is changed. This was done by inserting ion pairs into the system (or removing them from the system when necessary) until the bulk density equilibrates to . After the calibration we run production runs as usual.
Surprisingly at first glance, we have found that although the total ion density in the pore is slightly altered by calibration, it has practically no effect on the charge storage (Fig. 4b). This is likely because a change in the chemical potential due to the change in the ion density is small compared to what the system gains from the applied potential, i.e., . We could not accurately estimate for our system, but we expect it to be of the order of few ’s Kato et al. (2008). This is supported by an observation that the change in the transfer energy of about (in the MC model) corresponds to the change in the total ion concentration from M to more than M (see Fig. 2). For comparison, at K and at an applied potential of V.
IV.3 Avoiding ion trapping
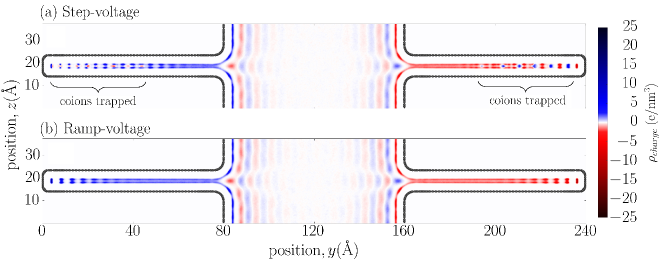
Figures 3 and 5a show that at high voltages the co-ions in the pore become ‘trapped’ near the pore closing on the time scales of our MD simulations (ns). Such a co-ion trapping leads to a decreased charge storage and sluggish dynamics Pak and Hwang (2016). To avoid ion trapping in this work we have used a linear voltage ramp to charge our system, instead of a typically used step-voltage charging as in Fig. 5a. Figure 5b demonstrates that this strategy allows us to avoid co-ion trapping on computationally accessible time scales.
The analysis of this approach will be presented in detail elsewhere.
IV.4 Effect of finite pore length, and pore entrance and closing
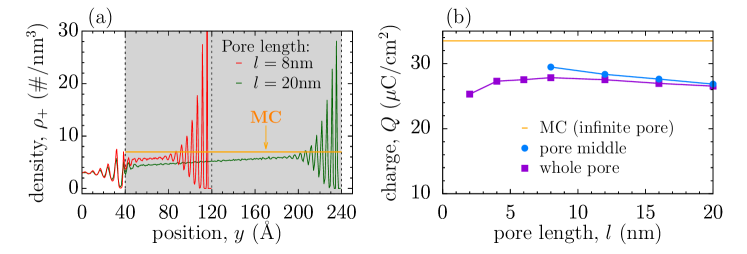
We have pointed out in Section IV.1 that the pore entrance and closing influence the in-pore structure of ions, particularly strongly at non-zero voltages (Fig. 3). Figure 6a shows that this behaviour remains true also for long pores (nm), i.e., the counter-ion density is systematically higher at the pore end and correspondingly lower where it begins; we note that these ion density profiles persist for long simulation runs (up to 200ns) and are likely the equilibrium profiles. Such a behaviour is understandable because image forces are weaker at the entrance, where the conducting pore walls end; in contrast, near the pore end the additional (closing) surface amplifies the image-force effects and hence attracts more ions. As a result, the counter-ion density along the pore changes approximately linearly between these two points.
Interestingly, the MC simulations predict the counter-ion densities that are closer to those at the pore end, rather than at the entrance (at the same applied potentials and for the same densities at zero potential). The exact reason for this is not clear to us, but it is tempting to speculate that it is actually the pore entrance that reduces the ion density, and in this way affects the ion concentration in the whole pore and hence its charging behaviour. On the other hand, it is also possible that the atomistic pore-wall structure in the MD model induces a weak ordering of an ionic liquid, and thus leads to an additional entropic cost for dense ion packing (recall that the pore walls in the MC model are flat). This implies that in the MD model a higher voltage is needed to induce the same counter-ion density as in the MC model, and this is indeed what we observe (cf. Fig. 7). It is worth noting that similar effects have been reported for ionic liquids at flat (non-porous) electrodes Breitsprecher et al. (2015).
This inhomogeneity of the ion distribution manifests itself in the accumulated charge (), which depends sensitively on the pore length and shows a non-monotonic behaviour (squares in Fig. 6b). Interestingly, decreases as increases (for long pores), which is because the ion density at the pore entrance becomes less affected by the pore closing, attending a lower value (Fig. 6a). Since the effects due to the pore closing and opening weaken with increasing , approaches as , where takes into account only the middle part of a pore. However, both and are smaller than obtained within the MC model featuring an infinitely long pore. As discussed, this is likely due to the effect that the pore entrance has on the in-pore ion density (Fig. 6a).
Thus, Fig. 6 demonstrates that there is no well-defined bulk region inside the pore, where the average ion density would be constant along the pore. This behaviour affects the charging behaviour and hinders a direct quantitative comparison between the MC and MD models. We therefore restrict further discussions mainly to qualitative comparisons.
V Comparison of the results for finite and infinite pores
We are now in position to compare the simulation results of the MD and MC models with finite and infinitely long nanopores, respectively. In the MD simulations, we have taken a voltage ramp of V/ns whenever necessary (at voltages V we observe no trapping for the pore length considered); the size of a bulk region was Å. The pore length was Å, but only the middle region of size Å was used to analyse the results (this is to exclude the contribution from strong ionic-liquid layering at the pore ends and entrances).
Since in MD simulations we had to adjust the ICC∗ charges each simulation step to keep a constant potential on the electrode surfaces, these constant-potential simulations are computationally demanding, and we have performed them only for a limited number of voltages. As a result, since the differential capacitance and the charging parameter (see below) require numerical differentiations with respect to voltage, we have calculated them with lower resolutions. This can be contrasted with our MC simulations, in which the metallic nature of the electrodes is taken into account via the interaction potentials (2) and (3). This allows to reduce the computational costs significantly (note that such analytical solutions exist only for a few simple geometries Rochester et al. (2013b)).
V.1 Pore filling and charging mechanisms
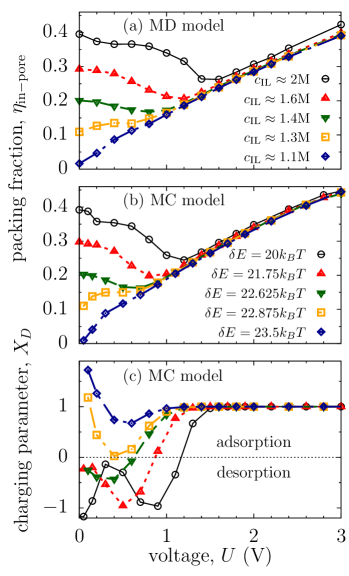
Figure 7 shows the total ion packing fraction as a function of the applied potential, and demonstrates that pore filling proceeds similarly in the MC and MD models. Interestingly, in all cases of strongly ionophilic pores, i.e., the pores with a substantial amount of an ionic liquid at no voltage, first decreases for increasing voltage, and starts to increase only when there are no co-ions left in the pore. In other words, at low voltages charging is dominated by co-ion desorption, while it is the counter-ion adsorption that drives charging at higher applied potentials Kondrat and Kornyshev (2011); Wu et al. (2012); Vatamanu et al. (2013); Kondrat and Kornyshev (2016). This is in agreement with the recent observation Kondrat and Kornyshev (2016) showing that desorption (and swapping) are thermodynamically preferable over adsorption in most cases, except of a narrow window of parameters in which desorption and swapping are infeasible due to the lack of co-ions.
To characterize charging mechanisms in more detail, we introduce a charging parameter, similar to the parameter of Forse et al. Forse et al. (2016),
| (4) |
where is the elementary charge, the differential capacitance, denotes the accumulated charge and the total number of ions. expresses how charging is related to pore filling or de-filling, and thus describes which charging mechanism takes place. If charging is driven solely by swapping of coions for counter-ions, then the total ion density does not change, , and hence . For pure electrosorption we have and thus , while for desorption and so . The parameter of Forse et al. is related to in a similar fashion as the integral capacitance is related to the differential capacitance, i.e.,
| (5) |
which can be seen as a voltage-averaged with the weight , where is a normalization constant.
The charging parameter obtained from MC simulations is presented in Fig. 7c. It shows that at high voltages charging is solely due to counter-ion adsorption, i.e., , but at low voltages it can be either co-ion desorption or counter-ion adsorption, depending on the transfer energy . Interestingly, for high values of , i.e., when the pore is nearly empty at no applied potential, the parameter is significantly greater unity, which means that both counter and co-ions are adsorbed into the pore at low voltages. This is likely because the additional ‘ion pairs’ screen the interactions between the counter-ions, reducing the thermodynamic cost of adsorption (note that at low densities the entropic cost of ion insertion is low).
V.2 Charging and differential capacitance
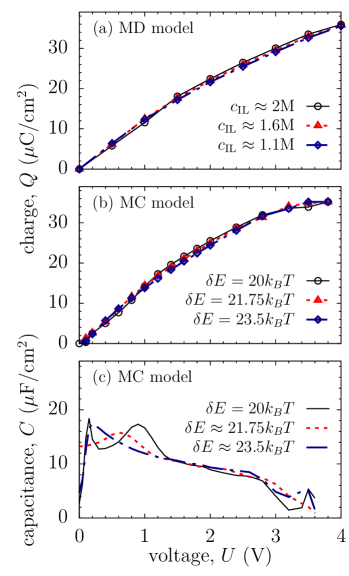
Figure 8 compares the accumulate charge from MC and MD simulations for pores with different occupancies at zero voltage, and demonstrates that also the charging process proceeds similarly in the MC and MD models. Interestingly, is practically independent of the transfer energies (MC simulations) and ionic liquid concentrations (MD simulations). This is because the electrostatic contribution () to the total electrochemical potential dominates the contribution due to and , respectively (see Section IV.2).
Fine details of the charging process are captured by the differential capacitance . Although does not seem to vary significantly with (Fig. 8b), shows nevertheless a complex behaviour, particularly for densely populated ionophilic pores. For such pores, the capacitance exhibits a first maximum corresponding to the co-ion/counter-ion swapping and a second maximum associated with the co-ion desorption, before it finally decreases as the pore becomes more and more occupied by counter-ions at high voltages. For weakly ionophobic pores there is only one maximum in at low pore occupancies, while at high potentials the charging proceeds similarly for all pores. For strongly ionophobic pores, the charging curves are shifted to higher voltages (Supplementary Fig. LABEL:si:fig:mc:capen). However, we have not been able to obtain such ionophobic pores in the MD model by varying the ionic liquid concentration ; thus, we shall not discuss this case further in this work.
V.3 Ion structure
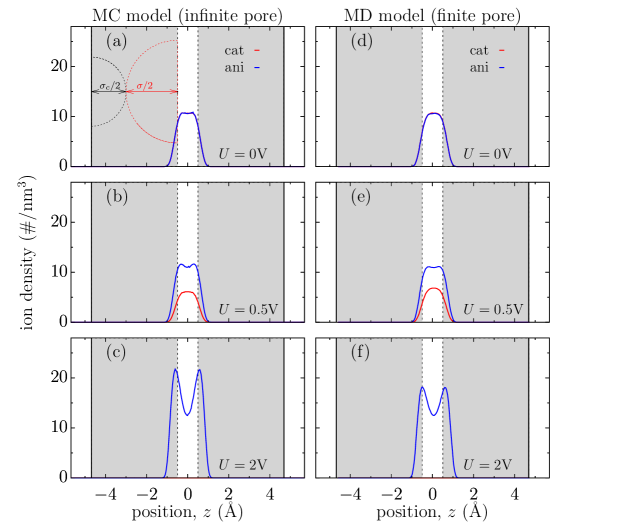
We have also looked at the ion structure across the pore. This is shown in Fig. 9, where we compare the density profiles obtained from MC and MD simulations for different voltages. The agreement is very good; small discrepancies are because we could not match exactly the ion densities at zero voltage.
At zero voltage the ion density has a maximum at the middle of the pore. This might seem surprising at first glance, since the image-force wall-ion attraction exhibits a maximum at the pore center (Fig. 1d). However, for ultranarrow pores considered in this work, this is altered by the wall-ion repulsive van-der Waals interactions, which produce a minimum rather than a maximum in the total wall-ion interaction potential (Supplementary Fig. LABEL:si:fig:wall-ion). Nevertheless, at high applied potentials, the counter-ions prefer to locate themselves at the pore walls. This is because the electrostatic energy () dominates the unfavourable van der Waals interactions between the walls and the ions, while the increased ion density pushes the counter-ions closer to the walls.
VI Effect of pore walls
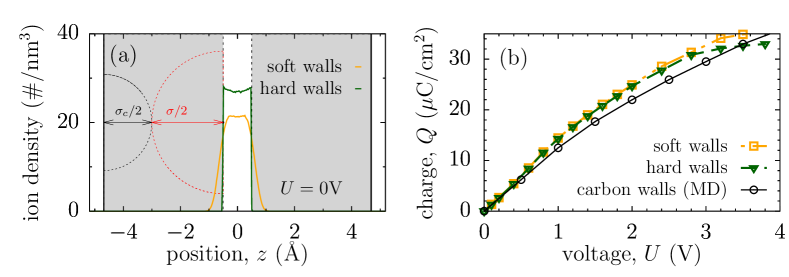
In addition to the soft pore walls, which interact with the ions via Eq. (1), we have considered the model of hard walls, which are widely used in the literature Kondrat et al. (2011); Kiyohara and Asaka (2007); Kiyohara et al. (2010, 2011); Jiang et al. (2011); Jiang and Wu (2014). Figure 10 shows that the hard walls strongly influence the ionic liquid structure inside a pore, but their effect on the charge storage is moderate. For low voltages, the accumulated charge in both systems practically coincides, and the only significant differences arise at high applied potentials, where the pore with hard walls saturates while the soft-wall pore can accommodate more charge.
We have also considered the soft walls with the standard 9-3 Lennard-Jones interaction potential between the walls and the ions. This interaction potential is more difficult to fit to the average interaction potential between the ions and the atomistic wall of the MD model, which is not very surprising. We have found that the in-pore ion structure depends sensitively on the fitting parameters (results not shown). However, as in the case of the hard walls, it has no significant effect on the charging behaviour.
We can conclude that although fine details of the non-electrostatic wall-ion interactions are important for the ion structure, their impact on charging is minor, at least at low and intermediates voltages.
VII Conclusions
We have studied charge storage in supercapacitors with slit narrow pores using two models. In one model, treated by MD simulations, a supercapacitor consisted of two electrodes, each with a slit pore of a finite length. In the second model, we focused on a single pore, infinitely extended in the lateral directions; this model was studied grand-canonically by MC simulations (Fig. 1). Our main conclusion is that although these two models are qualitatively consistent with each other (Figs. 7, 8 and 9), there are some important differences due to the finite pore length. In particular, the pore entrances and closings seem to have a vivid effect on the ion structure inside a pore. At high concentrations and/or high applied potentials, the ion density is not constant along the pore but varies roughly linearly between the pore entrance and the pore end, where it exhibit a strongly oscillatory structure (Fig. 6). This impedes a direct quantitative comparison of the two models.
We have also shown that:
-
•
In the MD model with finite pores, the ion density between the electrodes of a supercapacitor can vary appreciably with the applied voltage. This can be corrected by calibrating during equilibration runs, to keep it constant, as in the single-pore MC model. However, this change in the bulk density seems to have a minor effect on the charging behaviour (Fig. 4). This result means that it is safe to consider relatively small electrode-electrode separations in supercapacitor models and refrain from computationally expansive bulk calibrations. Note that the studies of the charging dynamics would not be straightforward if the bulk calibration were necessary.
-
•
At intermediate and high voltages (and for long pores), the co-ions become trapped in the pores on our typical simulation time sales (ns), producing non-equilibrium states. We have overcome this difficulty by using a voltage-ramp charging, instead of an abrupt step-voltage charging typically used in simulations (Fig. 5).
As co-ion trapping is expected to occur in experimental systems as well, we have studied this problem in more detail. In particular, we worked out a method to accelerate charging in systems with co-ion trapping and determined optimal charge/discharge regimes; the results of this study will be presented in a separate article.
-
•
At high voltages, charging proceeds exclusively via counter-ion adsorption, while at low voltages the charging process is dominated by either co-ion desorption or counter-ion adsorption, depending on the ion transfer energy or the total ion concentration (Fig. 7). Remarkably, at high transfer energies, implying low ion concentrations, both counter and co-ions are adsorbed into the pore at low voltages (the charging parameter , see Eq. (4) and Fig. 7c).
-
•
Interestingly, the accumulated charge seems to be only weekly dependent on the total ions density in a supercapacitor (Fig. 8). This observation provides an additional degree of freedom for optimizing the charging dynamics by varying the ion concentration without significantly compromising the energy density (note that the fine details of the charging process are resolved by the differential capacitance, which does depend on the total ion concentration/ion transfer energy, Fig. 8c).
-
•
Even though hard and soft pore walls lead to significant differences in the in-pore ion structure, they show practically the same charging behaviour (Fig. 10). This is because the applied potential ‘overrules’ all fine details of the non-electrostatic wall-ion interactions and the resulting ionic liquid structure.
In the context of the recent studies on ionophobicity of pores, it is instructive to emphasize that the pore occupancy at zero voltage, which determines the pore ionophobicity, can be varied by changing the total ion concentration () in a supercapacitor. However, by changing alone we could not achieve a state corresponding to strongly ionophobic pores, which provide high stored energies Kondrat and Kornyshev (2016); Lee et al. (2016); Lian et al. (2016) and fast charging Kondrat and Kornyshev (2013); Kondrat et al. (2014); Lee et al. (2014b). Thus, another method must be proposed to control effectively the ionophobicity of pores.
Finally, we have considered only a few aspects of modeling supercapacitors and restricted our attention to charged soft spheres as a model for ionic liquids. Our results on the pore walls suggest that non-electrostatic interactions and image forces can have a profound impact on the in-pore ion structure. It will thus be interesting and fruitful to understand the effects due to the differences in ionic liquid models Breitsprecher et al. (2014a, b), and whether such simple and computationally inexpensive models can capture the charging behaviour correctly.
VIII Supplementary Material
Supplementary figures show the ion-wall repulsive interaction potential (Fig. LABEL:si:fig:wall-ion-wca); the ion’s self-energy across the pore (Fig. LABEL:si:fig:Eself); the total wall-ion interaction potential (Fig. LABEL:si:fig:wall-ion); the effect of calibration on the ion density and accumulated charge (Fig. LABEL:si:fig:md:bulk_calibration); the comparison of the charging parameter (see Eq. (4)) obtained within the MD and MC models (Fig. LABEL:si:fig:mcmd:XD); the accumulated charge within the MD and MC models (Fig. LABEL:si:fig:mcmd:charge); the differential capacitance within the MD and MC models (Fig. LABEL:si:fig:mcmd:cap); the differential capacitance and stored energy from MC simulations (Fig. LABEL:si:fig:mc:capen); and the ion density profiles across the pore for pores with soft and hard walls from MC simulations (Fig. LABEL:si:fig:mc:rhoz).
Acknowledgements.
C.H. and K.B. acknowledge the Deutsche Forschungsgemeinschaft (DFG) through the cluster of excellence “Simulation Technology” and the SFB 716 for financial support. We are also grateful for the computing resources on the Cray XC40 (Hazel Hen) from the HLRS in Stuttgart. This project has received funding from the European Unions Horizon 2020 research and innovation programme under the Marie Skłodowska-Curie grant agreement No 734276 (S.K. contribution).References
- Miller and Simon (2008) J. R. Miller and P. Simon, “Materials science – electrochemical capacitors for energy management,” Science 321, 651–652 (2008).
- Simon and Gogotsi (2013) P. Simon and Y. Gogotsi, “Capacitive energy storage in nanostructured carbon–electrolyte systems,” Acc. Chem. Res. 46, 1094–1103 (2013).
- Raymundo-Piñero et al. (2006) E. Raymundo-Piñero, K. Kierczek, J. Machnikowski, and F. Béguin, “Relationship between the nanoporous texture of activated carbons and their capacitance properties in different electrolytes,” Carbon 44, 2498–2507 (2006).
- Chmiola et al. (2006) J. Chmiola, G. Yushin, Y. Gogotsi, C. Portet, P. Simon, and P. L. Taberna, “Anomalous increase in carbon capacitance at pore sizes less than 1 nanometer,” Science 313, 1760 (2006).
- Largeot et al. (2008) C. Largeot, C. Portet, J. Chmiola, P.-L. Taberna, Y. Gogotsi, and P. Simon, “Relation between the ion size and pore size for an electric double-layer capacitor,” J. Am. Chem. Soc. 130, 2730–2731 (2008).
- Kondrat et al. (2012) S. Kondrat, C. R. Pérez, V. Presser, Y. Gogotsi, and A. A. Kornyshev, “Effect of pore size and its dispersity on the energy storage in nanoporous supercapacitors,” Energy Environ. Sci. 5, 6474 (2012).
- Kondrat and Kornyshev (2011) S. Kondrat and A. Kornyshev, “Superionic state in double-layer capacitors with nanoporous electrodes,” J. Phys.: Condens. Matter 23, 022201 (2011).
- Kondrat et al. (2011) S. Kondrat, N. Georgi, M. V. Fedorov, and A. A. Kornyshev, “A superionic state in nano-porous double-layer capacitors: insights from monte carlo simulations,” Phys. Chem. Chem. Phys. 13, 11359–11366 (2011).
- Rochester et al. (2013a) C. C. Rochester, A. A. Lee, G. Pruessner, and A. A. Kornyshev, “Interionic interactions in electronically conducting confinement,” ChemPhysChem 16, 4121 (2013a).
- Goduljan et al. (2014) A. Goduljan, F. Juarez, L. Mohammadzadeh, P. Quaino, E. Santos, and W. Schmickler, “Screening of ions in carbon and gold nanotubes – a theoretical study,” Electrochem. Comm. 45, 48–51 (2014).
- Mohammadzadeh et al. (2015) L. Mohammadzadeh, A. Goduljan, F. Juarez, P. Quaino, E. Santos, and W. Schmickler, “Nanotubes for charge storage – towards an atomistic model,” Electrochim. Acta 162, 11–16 (2015).
- Vatamanu et al. (2010) J. Vatamanu, O. Borodin, and G. D. Smith, “Molecular dynamics simulations of atomically flat and nanoporous electrodes with a molten salt electrolyte,” Phys. Chem. Chem. Phys 12, 170 (2010).
- Feng and Cummings (2011) G. Feng and P. T. Cummings, “Supercapacitor capacitance exhibits oscillatory behavior as a function of nanopore size,” J. Phys. Chem. Lett. 2, 2859–2864 (2011).
- Wu et al. (2012) P. Wu, J. Huang, V. Meunier, B. Sumpter, and R. Qiao, “Voltage dependent charge storage modes and capacity in sub-nanometer pores,” J. Phys. Chem. Lett. 3, 1732–1737 (2012).
- Vatamanu et al. (2013) J. Vatamanu, Z. Hu, D. Bedrov, C. Perez, and Y. Gogotsi, “Increasing energy storage in electrochemical capacitors with ionic liquid electrolytes and nanostructured carbon electrodes,” J. Phys. Chem. Lett. 4, 2829 (2013).
- Vatamanu et al. (2015) J. Vatamanu, M. Vatamanu, and D. Bedrov, “Non-faradic energy storage by room temperature ionic liquids in nanoporous electrodes,” ACS nano 9, 5999 (2015).
- Shim and Kim (2010) Y. Shim and H. J. Kim, “Nanoporous carbon supercapacitors in an ionic liquid: A computer simulation study,” ACS Nano 4, 2345 (2010).
- Merlet et al. (2012) C. Merlet, B. Rotenberg, P. A. Madden, P.-L. Taberna, P. Simon, Y. Gogotsi, and M. Salanne, “On the molecular origin of supercapacitance in nanoporous carbon electrodes,” Nature Mater. 11, 306 (2012).
- Burt et al. (2016) R. Burt, K. Breitsprecher, B. Daffos, P.-L. Taberna, P. Simon, G. Birkett, X. S. Zhao, C. Holm, and M. Salanne, “Capacitance of nanoporous carbon-based supercapacitors is a trade-off between the concentration and the separability of the ions,” J. Chem. Phys. Lett. (2016).
- Li et al. (2007) H.-Q. Li, J.-Y. Luo, X.-F. Zhou, C.-Z. Yu, and Y.-Y. Xia, “An ordered mesoporous carbon with short pore length and its electrochemical performances in supercapacitor applications,” J. Electrochem. Soc. 154, A731–A736 (2007).
- Dyatkin et al. (2016) B. Dyatkin, O. G. B. Malinovskiy, YuliyaZozulya, P. Simon, and Y. Gogotsi, “High capacitance of coarse-grained carbide derived carbon electrodes,” J. Power Sources 306, 32–41 (2016).
- Note (1) While the electrodes with long well-defined slit pores exist Yang et al. (2013); Lukatskaya et al. (2013), extended long pores might not be present in some porous materials, such as CDCs, which consist of interconnected networks of different pores (see e.g. Ref. Oschatz et al. (2016)). However, although such a network can be described as a collection of shorter pores, the ionic liquid is nevertheless mainly present deeply in the porous carbons and far from the contact with the bulk electrolyte or pore closings. In this sense, infinitely extended pores can still be considered as good models for these porous materials too. We note, however, that such pore networks and surface roughness may lead to less structured ionic liquid configurations inside the pores, which can influence the charging behaviour.
- Kiyohara and Asaka (2007) K. Kiyohara and K. Asaka, “Monte carlo simulation of porous electrodes in the constant voltage ensemble,” J. Phys. Chem. C 111, 15903–15909 (2007).
- Kiyohara et al. (2010) K. Kiyohara, T. Sugino, and K. Asaka, “Electrolytes in porous electrodes: Effects of the pore size and the dielectric constant of the medium,” J. Chem. Phys. 132, 144705 (2010).
- Kiyohara et al. (2011) K. Kiyohara, T. Sugino, and K. Asaka, “Phase transition in porous electrodes,” J. Chem. Phys. 134, 154710 (2011).
- Jiang et al. (2011) D. E. Jiang, Z. H. Jin, and J. Z. Wu, “Oscillation of capacitance inside nanopores,” Nano Lett. 11, 5373–5377 (2011).
- Jiang and Wu (2014) D. Jiang and J. Wu, “Unusual effects of solvent polarity on capacitance for organic electrolytes in a nanoporous electrode,” Nanoscale (2014), 10.1039/c4nr00046c.
- Dudka et al. (2016) M. Dudka, S. Kondrat, A. Kornyshev, and G. Oshanin, “Phase behaviour and structure of a superionic liquid in nonpolarized nanoconfinement,” J. Phys.: Condens. Matter 28, 464007 (2016).
- Kornyshev (2014) A. A. Kornyshev, Faraday Discuss. 164, 117–133 (2014).
- Lee et al. (2014a) A. A. Lee, S. Kondrat, and A. A. Kornyshev, “Charge storage in conducting cylindrical nanopores,” Phys. Rev. Lett. 113, 048701 (2014a).
- Schmickler (2015) W. Schmickler, “A simple model for charge storage in a nanotube,” Electochim. Acta 173, 91–95 (2015).
- Rochester et al. (2016) C. C. Rochester, S. Kondrat, G. Pruessner, and A. A. Kornyshev, “Charging ultra-nanoporous electrodes with size-asymmetric ions assisted by apolar solvent,” J. Phys. Chem. C 120, 16042 (2016).
- Wu and Li (2007) J. Wu and Z. Li, “Density-functional theory for complex fluids,” Annu. Rev. Phys. Chem. 58, 85 (2007).
- Weeks et al. (1971) J. D. Weeks, D. Chandler, and H. C. Andersen, “Role of repulsive forces in determining the equilibrium structure of simple liquids,” J. Chem. Phys. 54, 5237 (1971).
- Lee et al. (2016) A. A. Lee, D. Vella, A. Goriely, and S. Kondrat, “Capacitance-power-hysteresis trilemma in nanoporous supercapacitors,” Phys. Rev. X 6, 021034 (2016).
- (36) M. G. Martin, http://towhee.sourceforge.net/.
- Widom (1963) B. Widom, “Some topics in the theory of fluids,” J. Chem. Phys. 39, 2808–2812 (1963).
- (38) “Espresso - extensible simulation package for research on soft matter,” http://espressomd.org, visited on 07/28/2016.
- Limbach et al. (2006) H. J. Limbach, A. Arnold, B. A. Mann, and C. Holm, “ESPResSo – an extensible simulation package for research on soft matter systems,” Comp. Phys. Comm. 174, 704–727 (2006).
- Arnold et al. (2013a) A. Arnold, O. Lenz, S. Kesselheim, R. Weeber, F. Fahrenberger, D. Roehm, P. Košovan, and C. Holm, “ESPResSo 3.1 — Molecular Dynamics Software for Coarse-Grained Models,” in Meshfree Methods for Partial Differential Equations VI, Lecture Notes in Computational Science and Engineering, Vol. 89, edited by M. Griebel and M. A. Schweitzer (Springer, 2013) pp. 1–23.
- Arnold and Holm (2002) A. Arnold and C. Holm, “MMM2D: a fast and accurate summation method for electrostatic interactions in 2D slab geometries,” Comp. Phys. Comm. 148, 327–348 (2002).
- Kesselheim et al. (2010) S. Kesselheim, M. Sega, and C. Holm, “The ICC* algorithm: A fast way to include dielectric boundary effects into molecular dynamics simulations,” arXiv preprint arXiv:1003.1271 (2010).
- Arnold et al. (2013b) A. Arnold, K. Breitsprecher, F. Fahrenberger, S. Kesselheim, O. Lenz, and C. Holm, “Efficient algorithms for electrostatic interactions including dielectric contrasts,” Entropy 15, 4569–4588 (2013b).
- Ballenegger et al. (2008) V. Ballenegger, J. J. Cerdà, O. Lenz, and C. Holm, “The optimal P3M algorithm for computing electrostatic energies in periodic systems,” Journal of Chemical Physics 128, 034109 (2008).
- Press (2007) W. H. Press, Numerical recipes: the art of scientific computing (Cambridge Univ Pr, 2007).
- Kondrat and Kornyshev (2016) S. Kondrat and A. Kornyshev, “Pressing a spring: What does it take to maximize the energy storage in nanoporous supercapacitors?” Nanoscale Horiz. 1, 45–52 (2016).
- Kato et al. (2008) H. Kato, K. Nishikawa, H. Murai, T. Morita, and Y. Koga, “Chemical potentials in aqueous solutions of some ionic liquids with the 1-ethyl-3-methylimidazolium cation,” J. Phys. Chem. B 112, 13344–13348 (2008).
- Pak and Hwang (2016) A. J. Pak and G. S. Hwang, “Charging rate dependence of ion migration and stagnation in ionic-liquid-filled carbon nanopores,” J. Phys. Chem. C 120, 24560 (2016).
- Breitsprecher et al. (2015) K. Breitsprecher, K. Szuttor, and C. Holm, “Electrode models for ionic liquid-based capacitors,” J. Phys. Chem. C 119, 22445–22451 (2015).
- Rochester et al. (2013b) C. C. Rochester, A. A. L. G. Pruessner, and A. A. Kornyshev, “Interionic interactions in conducting nanoconfinement,” ChemPhysChem 14, 4121–4125 (2013b).
- Forse et al. (2016) A. C. Forse, C. Merlet, J. M. Griffin, and C. P. Grey, “New perspectives on the charging mechanisms of supercapacitors,” J. Am. Chem. Soc 138, 5731–5744 (2016).
- Lian et al. (2016) C. Lian, H. Liu, D. Henderson, and J. Wu, “Can ionophobic nanopores enhance the energy storage capacity of electric-double-layer capacitors containing nonaqueous electrolytes?” J. Phys.: Condens. Matter 28, 414005 (2016).
- Kondrat and Kornyshev (2013) S. Kondrat and A. Kornyshev, “Charging dynamics and optimization of nanoporous supercapacitors,” J. Phys. Chem. C 117, 12399–12406 (2013).
- Kondrat et al. (2014) S. Kondrat, P. Wu, R. Qiao, and A. Kornyshev, “Accelerating charging dynamics in subnanometre pores,” Nature Materials 13, 387 (2014).
- Lee et al. (2014b) A. A. Lee, S. Kondrat, G. Oshanin, and A. A. Kornyshev, “Charging dynamics of supercapacitors with narrow cylindrical nanopores,” Nanotechnology 25, 315401 (2014b).
- Breitsprecher et al. (2014a) K. Breitsprecher, P. Košovan, and C. Holm, “Coarse grained simulations of an ionic liquid-based capacitor I: density, ion size, and valency effects,” Journal of Physics: Condensed Matter 26, 284108 (2014a).
- Breitsprecher et al. (2014b) K. Breitsprecher, P. Košovan, and C. Holm, “Coarse grained simulations of an ionic liquid-based capacitor II. Asymmetry in ion shape and charge localization,” Journal of Physics: Condensed Matter 26, 284114 (2014b).
- Yang et al. (2013) X. Yang, C. Cheng, Y. Wang, L. Qiu, and D. Li, “Liquid-mediated dense integration of graphene materials for compact capacitive energy storage,” Science 341, 534–537 (2013).
- Lukatskaya et al. (2013) M. R. Lukatskaya, O. Mashtalir, C. E. Ren, Y. Dall’Agnese, P. Rozier, P. L. Taberna, M. Naguib, P. Simon, M. W. Barsoum, and Y. Gogotsi, “Cation intercalation and high volumetric capacitance of two-dimensional titanium carbide,” Science 341, 1502 (2013).
- Oschatz et al. (2016) M. Oschatz, P. P. S. Doröfler, W. Nickel, P. Beaunier, J.-N. Rouzaud, C. Fischer, E. Brunner, and S. Kaskel, “Nanostructure characterization of carbide-derived carbons by morphological analysis of transmission electron microscopy images combined with physisorption and raman spectroscopy,” Carbon 105, 314–322 (2016).