Fermi level pinning by defects can explain the large reported carbon 1s binding energy variations in diamond.
Abstract
The quantitative evaluation of the carbon hybridization state by X-ray photoelectron spectroscopy (XPS) has been a surface-analysis problem for the last three decades due to the challenges associated with the unambiguous identification of the characteristic binding energy values for sp2 and sp3-bonded carbon. While the sp2 binding energy is well established, there is disagreement for the sp3 value in the literature. Here, we compute the binding energy values for model structures of pure and doped-diamond using density functional theory. The simulation results indicate that the large band-gap of diamond allows defects to pin the Fermi level, which results in large variations of the C(1s) core electron energies for sp3-bonded carbon, in agreement with the broad range of experimental C(1s) binding energy values for sp3 carbon reported in the literature. Fermi level pinning by boron is demonstrated by experimental C(1s) binding energies of highly B-doped ultrananocrystalline diamond that are in good agreement to simulations.
I Introduction
X-ray photoelectron spectroscopy is one of the most powerful tools for the characterization of carbon-based materials Chu and Li (2006). The analysis of the bonding configuration of carbon is normally carried out by XPS through the acquisition of carbon 1s (C(1s)) spectra. The spectra are often fitted with two distinct features, one assigned to threefold-coordinated (sp2) carbon and one assigned to fourfold-coordinated (sp3) carbon. In spite of the wide use of this analytical procedure for the quantitative evaluation of the carbon hybridization state on the basis of C(1s) XPS signals, the validity of this methodology has recently been questioned Mezzi and Kaciulis (2010a); Kaciulis (2012) and still remains a matter of discussion in the literature Fujimoto et al. (2016).
We have recently shown that absolute XPS peak positions can be predicted by facile spin-paired DFT calculations within the frozen core approximation Walter et al. (2016, 2019). In this approach, an empirical shift appears that can be obtained from experimental gas-phase XPS data. The main difficulty in assigning core hole energies in general, and C(1s) energies in particular, is the unambiguous definition of the reference energy. This is not the case for gas-phase investigations, where the energy of an electron in vacuum far away from the mother ion can be used as a well-defined reference for the core electron binding energy .
For solid samples the Fermi energy is usually used as the reference energy level,Riga et al. (1977) but this energy can only be defined correctly for systems without a band gap, i.e., metals or semi-metallic systems like graphite. Accordingly, the experimental variation in C(1s) energies of semi-metal graphite is moderate and found to range from 284.28 eV to 284.63 eV Keiser and Kleber (1976); Morar et al. (1986); Lascovich et al. (1991); Waite and Shah (1992); Xie and Sherwood (1992); Witek et al. (1996); Bastl (1995); Graupner et al. (1998); Leung et al. (1999); Bobrov et al. (2001); Kusunoki et al. (2001); Yan et al. (2004); Saw and du Plessis (2004); Ghodbane et al. (2010); Mezzi and Kaciulis (2010a); Kaciulis (2012); Schenk et al. (2016). Diamond, in contrast, has a very large band gap (its experimental value is 5.5 eV Ashcroft and Mermin (1976)), which hinders the consistent definition of an energy reference. Additional difficulties arise from the presence of defects, impurities, and dopants in diamond (such as nitrogen or boronKaiser and Bond (1959); Dannefaer (2007); Himpsel et al. (1979)), which may pin the Fermi energy. These factors, together with effects of surface charging when acquiring XPS spectra on diamond, have resulted in the publication of a wide range of binding energy values for the C(1s) signal of sp3-bonded carbon (in the range of 283.25 eV - 291.35 eV) Graupner et al. (1998); Leung et al. (1999); Sawa (2004); Yusaku et al. (2004). Despite the difficulties in unambiguously assigning a characteristic binding energy value to sp3-bonded carbon, the quantitative evaluation of the carbon hybridization state on the basis of C(1s) XPS signals is still widely performed on the basis of fitting the C(1s) XPS spectra with two synthetic peaks, one assigned to sp2-hybridized carbon and one to sp3-hybridized carbon. Here, we use DFT calculations to compute the characteristic C(1s) binding energy values for sp3-bonded carbon in diamond and sp2-bonded carbon in graphite.
II Methods
Our DFT calculations were carried out with the GPAW Mortensen et al. (2005); Enkovaara et al. (2010) package, an implementation of the projector augmented wave (PAW) method Blöchl (1994). The PAW method splits the Kohn-Sham wave functions into a smooth part, representable on configuration or momentum space grids, and corrections that are local near to the atoms. We use the configuration space grid implementation, and apply a grid spacing of 0.2 Å for representing the smooth part of the Kohn-Sham wavefunctions, unless noted otherwise. The exchange correlation energy was approximated by the generalized gradient correction as proposed by Perdew, Burke and Ernzerhof (PBE)Perdew et al. (1996). We have used a spin-paired description for simplicity of band-structure analysis presented below. We have checked that the inclusion of spin does not change our results significantly. The structures were relaxed until all forces on the atoms dropped below 0.05 eVÅ-1.
Lower energy atomic states can be conveniently held fixed in their atomic form within the frozen core approximation, where we include the electrons for C and the diamond dopant atoms B, N, and the electrons for the diamond dopant atom P in our calculations. A similar approach is adopted to describe the core hole by lowering the occupation of the relevant state in the atomic calculation by one. The resulting self-consistently obtained Kohn-Sham orbitals in the presence of the core hole are then used to construct the frozen core Enkovaara et al. (2010); Ljungberg et al. (2011); Susi et al. (2014).
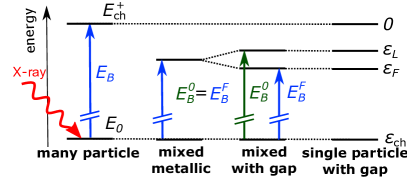
The calculation of core-hole binding energies follows the methodology developped in Ref. Walter et al., 2016, as illustrated in Fig. 1 and is briefly summarized in what follows. XPS energies of molecules or clusters in the gas phase are well defined by the many body ground state energy and the core hole excited energy . The latter can be approximated as the ground state of the system with a core hole in the frozen core, where the self-consistent calculation of the valence orbitals in the field of the core hole automatically takes into account relaxation effects. The photoelectrons’ binding energy is then:
| (1) |
XPS energies for periodic systems as modeled here have to be treated in a mixed many-body and single-particle picture. Experimentally, the core level energy is measured relative to the single particle Fermi level (smaller than zero) that is aligned to the Fermi level of the detector by holding them at a common groundRiga et al. (1977); Ozaki and Lee (2017):
| (2) |
The computational difficulty of charged super-cells Bruneval et al. (2014) for the description of the core ionized final state can be overcome by neutralizing the super-cell by an extra electron. This electron will locate itself in the lowest unoccupied “molecular” orbital (LUMO). Neglecting all other contributions due to the change in the electron density, this approach adds the energy to . We obtain a binding energy in the neutralized system of the form:
| (3) |
For a system without a band gap, and hence conveniently . Systems with a band gap pose several problems, however. The position of the Fermi level is not defined in these systems which prohibits a defined value for .
III Results
In the first step, we consider the case of bulk diamond, which is the most problematic system due to its large band-gap. We model diamond by unit cells containing 64 atoms in tetrahedral configurations with the experimental lattice constant of 3.5669 ÅLide (2004) resulting in a CC bond-length of 1.55 Å. We are particularily interested in the effect of defects and impurities on the expected C(1s) value.
One of the most common impurities in natural diamond gemstones is nitrogenKaiser and Bond (1959); Dannefaer (2007) which can be present in amounts of up to 0.5 at. % Lombardi et al. (2003). Different possibilities for the presence of nitrogen are considered in the literature, where the replacement of a C atom with a N atom with or without a neighboring vacancy are believed to be the most common configurationsGoss et al. (2004). In the former case, the P1 centerIakoubovskii and Adriaenssens (2000); Lombardi et al. (2003) is modeled as the replacement of a single C atom by N (C63N). The nitrogen vacancy (NV) centerJelezko and Wrachtrup (2006) is modeled by the replacement of a single C atom by N and a neighboring vacancy (C62N). The A center Goss et al. (2004) is two neighboring N atoms (C62N2), and the N3 centerGoss et al. (2004); Lu et al. (2012) consists of three nitrogen atoms near to a vacancy (C60N3). The B centerGoss et al. (2004) is four N surrounding a vacancy (C59N4).
Other common impurities are boron or phosphorusKoizumi et al. (2000). These elements are either present in natural diamonds (type IIb in the case of boronMorar et al. (1986); Bobrov et al. (2001)) or introduced artificiallyBobrov et al. (2001); Kusunoki et al. (2001); Ghodbane et al. (2010). Boron- or phosphorus-doped structures are modeled by replacing a single C atom by B (C63B) or P (C63P), respectively. All model structures were relaxed to their next local minimum while the unit cell was kept fixed. Relaxed structures and distributions of calculated C(1s) values are depicted in Supplemental Material.
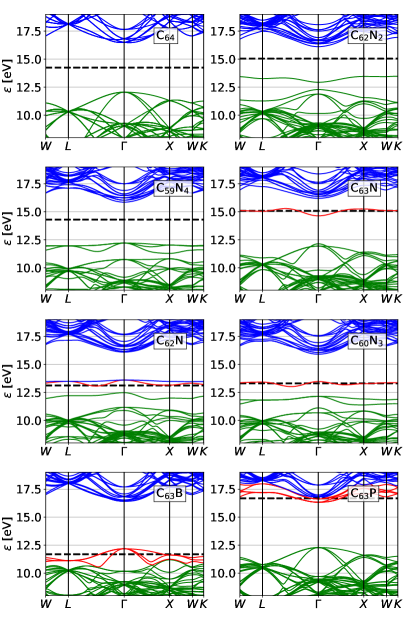
Fig. 2 shows the effect of defects on the diamond band structure. While the overall band-structure is rather similar in all cases, the defects or dopants introduce states at different positions within the diamond band gap. The gap is found to be 4.42 eV wide according to PBEMatsuda et al. (2010); Yang et al. (2013); Rivero et al. (2016) underestimating the experimental value of 5.5 eV.Ristein (2006); Oyama et al. (2009) This well known tendency of local and semilocal functionals to understimate the gap can be improved by computationally more demanding hybrid functionalsYang et al. (2013); Rivero et al. (2016), but will not affect the general effect of Fermi level pinning discussed in the following.
The two N in C62N2 slightly disturb a high lying unoccupied (acceptor) levels near to the conduction band edge and introduce a rather high occupied (donor) level above the valence band edge Goss et al. (2004), thus reducing the band gap. These levels show some variation with the wave vector in our calculation indicating interaction between periodic images. The variations are rather small (a few 100 meV) and are neglected in the following. A similar effect as in C62N2 is observed in C59N4, where mainly states slightly above are introduced. Similar to pure diamond, the Fermi level is located in the middle between the maximum of the highest occupied and the minimum of the lowest unoccupied band. An infinitesimal charge could move the Fermi energy towards the valence or the conduction band depending on its sign.
The freedom of moving the Fermi level by slight charging is not the case anymore for the other models presented in Fig. 2 as these contain an unpaired electron. There, is pinned by this half-filled state and is therefore well defined. The exact positions of the Fermi level relative to the band structure of diamond varies largely depending on the nature of the defect, however. While the half filled state is close to the conduction band in C63N, it is found in the middle of the band gap for C62N and C60N3. The most extreme positions are found in C63B where the partially filled states (degenerate at the -point) are near to Lee and Pickett (2006); Oyama et al. (2009) and for C63P where partially filled states are found near to .Oyama et al. (2009)
Assuming that the C(1s) core level energy relative to the vacuum level is mainly constant for carbon atoms far from any defect, the variation in will be reflected in a variation in [c.f. eq. (2)], which is indeed the case as will be shown now.
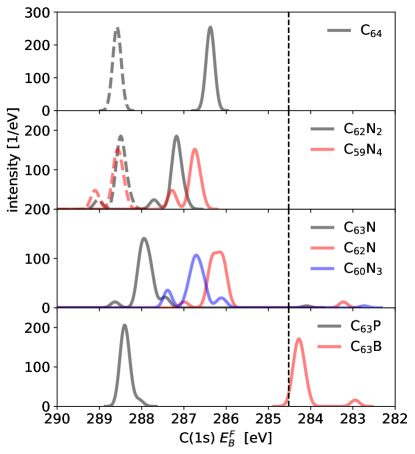
The C(1s) XPS spectra corresponding to the defects are compared to pure diamond in Fig. 3. The unshifted spectra [broken lines, corresponding to in eq. (2)] of the C64, C62N2 and C59N4 models are very similar in their main peak as they share the same lowest unoccupied level (c.f. Fig. 2). The spectra are different when they are corrected to located at the center of the gap (as usually assumed in semiconductors Yu and Cardona (2010)) due to the different band gap values. Unshifted and shifted coincide for the cases involving an unpaired electron as in these cases. The largest core level energy is found for C63N and the lowest energy for C63B as expected from the positions of the unpaired levels in Fig. 2. The main C(1s) energy in C63B of 284.27 eV is in good agreement to the value of 284.4 eV measured for artificially boron-doped diamondKusunoki et al. (2001) and to the main peak of strongly boron-doped ultranano-crystalline diamond (UNCD) found at 284.090.05 eV discussed in detail below.
| structure | model | gap [eV] | C(1s) [eV] | shift [eV] |
|---|---|---|---|---|
| pure | C64 | 4.42 | 286.36∗ | 1.85 |
| P1 center | C63N | 0 | 288.41 | 3.43 |
| NV center | C62N | 0 | 286.15 | 1.68 |
| A center | C62N2 | 2.64 | 287.17∗ | 2.65 |
| N3 center | C60N3 | 0 | 286.70 | 2.18 |
| B center | C59N4 | 3.65 | 286.74∗ | 2.22 |
| B | C63B | 0 | 284.27 | -0.25 |
| P | C63P | 0 | 288.41 | 3.89 |
| graphite | C72 | 0 | 284.52Walter et al. (2016) |
Various side peaks appear for the different defects. In C62N2, there is a peak at slightly higher energy that comes from the six carbon atoms surrounding the two nitrogen atoms forming a N(CR3)3 like structure with an NC bond length of 1.45 Å very similar to the 1.46 Å in N(CH3)3. In contrast, a lower energy peak from the four carbon atoms surrounding N is found in C63N. Here, the N has to share the bonds with four C due to symmetry. The NC bond-length is thus much longer (1.60 Å) exceeding the diamond CC bond.
For the N impurity with a neighboring vacancy (C62N), the lower energy peak (283.2 eV) is from the three carbons surrounding the cavity and the higher energy peak (287 eV) from the three carbons connected to nitrogen. The NC bond-length of 1.48 Å is quite similar to N(CH3)3 again.
The four carbon atoms surrounding the P atom symmetrically with a bond length of 1.70 Å in C63P produce the lower energy shoulder in the corresponding C(1s) spectrum. Similarly, the lower energy peak around 283 eV in C63B is from the four carbon atoms surrounding B. Structurally, the B impurity atom shares four equal bonds with large CB bond length of 1.59 Å as compared to 1.55 in CC.
Besides these side peaks the main effect is the strong variation of the C(1s) peak with defect type. A defect in diamond dictates the C(1s) position of E even for carbon atoms far apart due to its influence on the Fermi level. Therefore we can conclude that diamond is a problematic system to define the sp3 C(1s) energy as the C(1s) energy depends on the nature of defects that are omnipresent in real diamonds. This finding can contribute explaining the broad range of C(1s) values for diamond reported in the literature.Fujimoto et al. (2016)
We finally seek for an experimental validation of the computional analysis presented so far. Experimental XPS data were acquired on hydrogen-terminated ultrananocrystalline diamond (UNCD Aqua 25, Advanced Diamond Technologies, Romeoville, IL, USA), boron-doped ultrananocrystalline diamond (UNCD Aqua 25, Advanced Diamond Technologies, Romeoville, IL, USA),Zeng et al. (2015) and freshly cleaved highly ordered pyrolitic graphite (HOPG, grade 2, SPI Supplies, West Chester, PA, USA). Near-edge X-ray absorption fine structure (NEXAFS) spectroscopy measurements indicated that the fraction of sp3-bonded carbon in undoped and boron-doped UNCD was 94+/-3% and 96+/-3%, respectively Mangolini et al. (2014); Zeng et al. (2015); Mangolini et al. (2016). In the present work, the X-ray source was run at 30 mA and 12 kV, whereas the analyzer was operated in constant-analyzer-energy (CAE) mode. Survey spectra were acquired with the pass energy and step size equal to 200 eV and 1 eV, respectively. For the high-resolution (HR) spectra, the pass energy and step size were, respectively, 100 and 0.05 eV (full width at half maximum (FWHM) of the peak height for the Ag 3d5/2 equal to 0.57 eV). The curved slit at the entrance of the hemispherical analyzer has a width of 0.8 mm. The residual pressure in the analysis chamber was always below 10-6 Pa. The spectrometer was calibrated according to ISO 15472:2001 with an accuracy better than 0.05 eV. All the XPS results reported here are mean values calculated from at least three independent measurements, with the corresponding standard deviation reported.
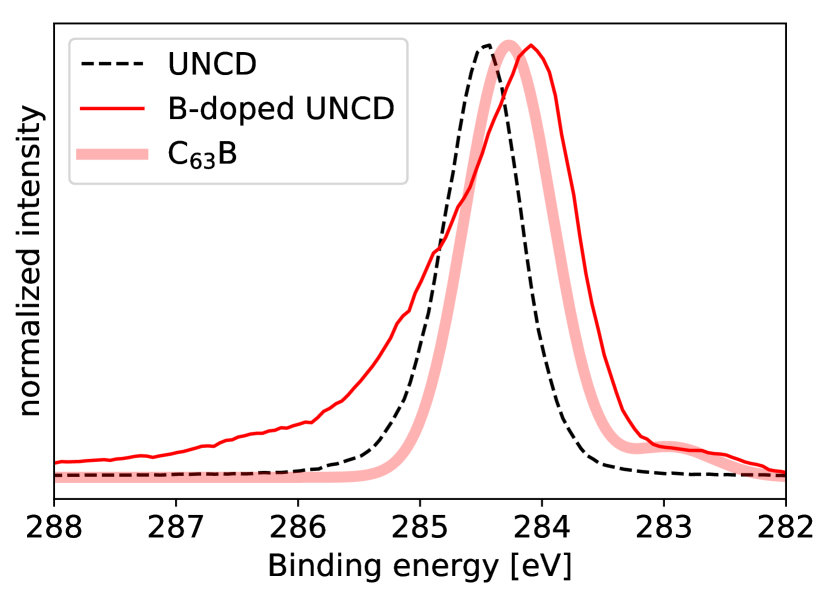
The DFT calculations are in good agreement with experimental XPS data acquired on undoped and B-doped UNCD shown in Fig. 4. First, the binding energy of the characteristic C(1s) peak for B-doped UNCD is lower than the binding energy of the C(1s) signal of undoped UNCD (284.090.05 eV vs. 284.470.05 eV, respectively in experiments) and agrees well with the 284.27 eV from DFT. Second, as in the simulation, there is a clear shoulder on the lower binding energy side in the experiment. Note that the shoulder on the high binding energy side of the experimental spectrum (286-288 eV) is caused by C-O bondsArezzo et al. (1994); Dementjev and Petukhov (1997); Kaciulis (2012); Mezzi and Kaciulis (2010b); Retzko and Unger (2003); Wilson et al. (2001); Yang et al. (2011) in the near-surface region. The experimental C(1s) of undoped UNCD does not agree with the calculation for pure diamond. This is not surprising with respect to the large band gap of diamond and the resulting undefined Fermi level. UNCD is not single-crystal diamond and the grain boundaries contain sp2-carbon, defects, and are rich in hydrogen. The effect of hydrogen on the shape and position of C(1s) signal of carbon materials will be presented in a later publication. The strong influence of these defects is also inline with the observation that etching can shift the C(1s) value by several eV in UNCD films Sumant et al. (2007).
IV Conclusions
In conclusion, we have shown that the sp3 C(1s) binding energies determined from diamond are highly affected by the presence and nature of defects. This strong dependence of the binding energy of the characteristic C(1s) peak for sp3 carbon on the type and number density of defects in diamond samples makes the use of diamond as reference material for XPS analysis potentially misleading. This is a consequence of the large gap, i.e. the insulating nature,Kaciulis (2012) of undoped carbon and the resulting absence of a defined refence energy within the system. This conclusion is not restricted to diamond, but applies for XPS measurements of other wide band gap materials, where similar spreads in experimental core hole binding energies have been observed as discussed in Ref. Walter et al., 2016.
Acknowledgements.
M.W. and M.M. thank G. Moras for useful discussions. Computational resources of FZ-Jülich and NEMO are thankfully acknowledged. R.W.C. acknowledges support from the U.S. National Science Foundation (NSF) through the University of Pennsylvania Materials Research Science, and Engineering Center (MRSEC) (DMR-1720530). F.M. acknowledges support from from the Welch Foundation under Grant F-2002-20190330, the Marie Curie International Outgoing Fellowship for Career Development within the 7th European Community Framework Programme under contract no. PIOF-GA-2012-328776 and the Marie Skłodowska-Curie Individual Fellowship within the European Union’s Horizon 2020 Program under Contract No. 706289. J.B.M. acknowledges support of a Graduate Research Supplement for Veterans from the Directorate for Mathematical and Physical Sciences at the National Science Foundation.References
- Chu and Li (2006) P. K. Chu and L. Li, Materials Chemistry and Physics 96, 253 (2006).
- Mezzi and Kaciulis (2010a) A. Mezzi and S. Kaciulis, Surface and Interface Analysis 42, 1082 (2010a).
- Kaciulis (2012) S. Kaciulis, Surf. Interface Anal. 44, 1155 (2012).
- Fujimoto et al. (2016) A. Fujimoto, Y. Yamada, M. Koinuma, and S. Sato, Analytical Chemistry 88, 6110 (2016).
- Walter et al. (2016) M. Walter, M. Moseler, and L. Pastewka, Physical Review B 94, 041112(R) (2016).
- Walter et al. (2019) M. Walter, M. Vogel, V. Zamudio-Bayer, R. Lindblad, T. Reichenbach, K. Hirsch, A. Langenberg, J. Rittmann, A. Kulesza, R. Mitrić, M. Moseler, T. Möller, B. v. Issendorff, and J. Tobias Lau, Physical Chemistry Chemical Physics 21, 6651 (2019).
- Riga et al. (1977) J. Riga, J.-J. Pireaux, and J. J. Verbist, Molecular Physics 34, 131 (1977).
- Keiser and Kleber (1976) J. Keiser and R. Kleber, J. Appl. Phys. 9, 315 (1976).
- Morar et al. (1986) J. F. Morar, F. J. Himpsel, G. Hollinger, J. L. Jordan, G. Hughes, and F. R. McFeely, Physical Review B 33, 1340 (1986).
- Lascovich et al. (1991) J. C. Lascovich, R. Giorgi, and S. Scaglione, Applied Surface Science 47, 17 (1991).
- Waite and Shah (1992) M. M. Waite and S. I. Shah, Applied Physics Letters 60, 2344 (1992).
- Xie and Sherwood (1992) Y. Xie and P. Sherwood, Surf. Sci. Spectra 1, 367 (1992).
- Witek et al. (1996) G. Witek, M. Noeske, G. Mestl, S. Shaikhutdinov, and R. Behm, Catal. Lett. 37, 35 (1996).
- Bastl (1995) Z. Bastl, Collect. Czech. Chem. Commun. 60, 383 (1995).
- Graupner et al. (1998) R. Graupner, F. Maier, J. Ristein, L. Ley, and C. Jung, Phys. Rev. B 57, 12397 (1998).
- Leung et al. (1999) T. Leung, W. Man, P. Lim, W. Chan, F. Gaspari, and S. Zukotynski, Journal of Non-Crystalline Solids 254, 156 (1999).
- Bobrov et al. (2001) K. Bobrov, G. Comtet, G. Dujardin, L. Hellner, P. Bergonzo, and C. Mer, Physical Review B 63, 165421 (2001).
- Kusunoki et al. (2001) I. Kusunoki, M. Sakai, Y. Igari, S. Ishidzuka, T. Takami, T. Takaoka, M. Nishitani-Gamo, and T. Ando, Surface Science 492, 315 (2001).
- Yan et al. (2004) X. B. Yan, T. Xu, S. R. Yang, H. W. Liu, and Q. J. Xue, Journal of Physics D: Applied Physics 37, 2416 (2004).
- Saw and du Plessis (2004) K. G. Saw and J. du Plessis, Materials Letters 58, 1344 (2004).
- Ghodbane et al. (2010) S. Ghodbane, D. Ballutaud, F. Omnès, and C. Agnès, Diamond and Related Materials Proceedings of Diamond 2009, The 20th European Conference on Diamond, Diamond-Like Materials, Carbon Nanotubes and Nitrides, Part 1, 19, 630 (2010).
- Schenk et al. (2016) A. K. Schenk, K. J. Rietwyk, A. Tadich, A. Stacey, L. Ley, and C. I. Pakes, Journal of Physics: Condensed Matter 28, 305001 (2016).
- Ashcroft and Mermin (1976) N. W. Ashcroft and N. D. Mermin, Solid State Physics (Thomson Learning, Inc., 1976) iSBN: 0030839939.
- Kaiser and Bond (1959) W. Kaiser and W. L. Bond, Physical Review 115, 857 (1959).
- Dannefaer (2007) S. Dannefaer, physica status solidi (c) 4, 3605 (2007).
- Himpsel et al. (1979) F. J. Himpsel, J. A. Knapp, J. A. VanVechten, and D. E. Eastman, Physical Review B 20, 624 (1979).
- Sawa (2004) K. Sawa, J. du Plessis Materials Letters 58, 1344 (2004).
- Yusaku et al. (2004) K. Yusaku, T. Jun, and M. Iwao, Diamond and Related Materials 13, 93 (2004).
- Mortensen et al. (2005) J. J. Mortensen, L. B. Hansen, and K. W. Jacobsen, Phys. Rev. B 71, 035109 (2005).
- Enkovaara et al. (2010) J. Enkovaara, C. Rostgaard, J. J. Mortensen, J. Chen, M. Dułak, L. Ferrighi, J. Gavnholt, C. Glinsvad, V. Haikola, H. A. Hansen, H. H. Kristoffersen, M. Kuisma, A. H. Larsen, L. Lehtovaara, M. Ljungberg, O. Lopez-Acevedo, P. G. Moses, J. Ojanen, T. Olsen, V. Petzold, N. A. Romero, J. Stausholm-Møller, M. Strange, G. A. Tritsaris, M. Vanin, M. Walter, B. Hammer, H. Häkkinen, G. K. H. Madsen, R. M. Nieminen, J. K. Nørskov, M. Puska, T. T. Rantala, J. Schiøtz, K. S. Thygesen, and K. W. Jacobsen, J. Phys.: Condens. Matter 22, 253202 (2010).
- Blöchl (1994) P. E. Blöchl, Phys. Rev. B 50, 17953 (1994).
- Perdew et al. (1996) J. P. Perdew, K. Burke, and M. Ernzerhof, Phys. Rev. Lett. 77, 3865 (1996).
- Ljungberg et al. (2011) M. P. Ljungberg, J. J. Mortensen, and L. G. M. Pettersson, J. Electr. Spectr. Rel. Phen. 184, 427 (2011).
- Susi et al. (2014) T. Susi, M. Kaukonen, P. Havu, M. P. Ljungberg, P. Ayala, and E. I. Kauppinen, Beilstein J. Nanotechnol. 5, 121–132 (2014).
- Ozaki and Lee (2017) T. Ozaki and C.-C. Lee, Physical Review Letters 118, 026401 (2017).
- Bruneval et al. (2014) F. Bruneval, J.-P. Crocombette, X. Gonze, B. Dorado, M. Torrent, and F. Jollet, Phys. Rev. B 89, 045116 (2014).
- Lide (2004) D. R. Lide, ed., CRC Handbook of Chemistry and Physics, 85th ed. (CRC Press, Boca Raton, 2004).
- Lombardi et al. (2003) E. B. Lombardi, A. Mainwood, K. Osuch, and E. C. Reynhardt, Journal of Physics: Condensed Matter 15, 3135 (2003).
- Goss et al. (2004) J. P. Goss, P. R. Briddon, R. Jones, and S. Sque, Diamond and Related Materials 14th European Conference on Diamond, Diamond-Like Materials, Carbon Nanotubes, Nitrides and Silicon Carbide, 13, 684 (2004).
- Iakoubovskii and Adriaenssens (2000) K. Iakoubovskii and G. J. Adriaenssens, Journal of Physics: Condensed Matter 12, L77 (2000).
- Jelezko and Wrachtrup (2006) F. Jelezko and J. Wrachtrup, physica status solidi (a) 203, 3207 (2006).
- Lu et al. (2012) H.-C. Lu, M.-Y. Lin, S.-L. Chou, Y.-C. Peng, J.-I. Lo, and B.-M. Cheng, Analytical Chemistry 84, 9596 (2012).
- Koizumi et al. (2000) S. Koizumi, T. Teraji, and H. Kanda, Diamond and Related Materials 9, 935 (2000).
- Matsuda et al. (2010) Y. Matsuda, J. Tahir-Kheli, and W. A. Goddard, The Journal of Physical Chemistry Letters 1, 2946 (2010).
- Yang et al. (2013) L. Yang, H. Y. He, and B. C. Pan, The Journal of Chemical Physics 138, 024502 (2013).
- Rivero et al. (2016) P. Rivero, W. Shelton, and V. Meunier, Carbon 110, 469 (2016).
- Ristein (2006) J. Ristein, Surface Science Berlin, Germany: 4–9 September 2005Proceedings of the 23th European Conference on Surface Science, 600, 3677 (2006).
- Oyama et al. (2009) K. Oyama, S.-G. Ri, H. Kato, M. Ogura, T. Makino, D. Takeuchi, N. Tokuda, H. Okushi, and S. Yamasaki, Applied Physics Letters 94, 152109 (2009).
- Lee and Pickett (2006) K.-W. Lee and W. E. Pickett, Physical Review B 73, 075105 (2006).
- Yu and Cardona (2010) P. Yu and M. Cardona, Fundamentals of Semiconductors: Physics and Materials Properties, 4th ed., Graduate Texts in Physics (Springer-Verlag, Berlin Heidelberg, 2010).
- Zeng et al. (2015) H. J. Zeng, A. R. Konicek, N. Moldovan, F. Mangolini, T. Jacobs, I. Wylie, P. U. Arumugam, S. Siddiqui, R. W. Carpick, and J. A. Carlisle, Carbon 84, 103 (2015).
- Mangolini et al. (2014) F. Mangolini, J. B. McClimon, F. Rose, and R. W. Carpick, Analytical Chemistry 86, 12258 (2014).
- Mangolini et al. (2016) F. Mangolini, J. B. McClimon, and R. W. Carpick, Analytical Chemistry 88, 2817 (2016).
- Arezzo et al. (1994) F. Arezzo, E. Severini, and N. Zacchetti, Surface and Interface Analysis 22, 218 (1994).
- Dementjev and Petukhov (1997) A. P. Dementjev and M. N. Petukhov, Diamond and Related Materials 6, 486 (1997).
- Mezzi and Kaciulis (2010b) A. Mezzi and S. Kaciulis, Surface and Interface Analysis 42, 1082 (2010b).
- Retzko and Unger (2003) I. Retzko and W. E. S. Unger, Advanced Engineering Materials 5, 519 (2003).
- Wilson et al. (2001) J. I. B. Wilson, J. S. Walton, and G. Beamson, Journal of Electron Spectroscopy and Related Phenomena 121, 183 (2001).
- Yang et al. (2011) M. Yang, M. J. Marino, V. J. Bojan, O. L. Eryilmaz, A. Erdemir, and S. H. Kim, Applied Surface Science 257, 7633 (2011).
- Sumant et al. (2007) A. V. Sumant, D. S. Grierson, J. E. Gerbi, J. A. Carlisle, O. Auciello, and R. W. Carpick, Physical Review B 76, 235429 (2007).