Identification of epileptic regions from electroencephalographic data: Feigenbaum graphs
Abstract
Diagnosing epilepsy is a problem of crucial importance. So analysing EEG data is of much importance to help this diagnosis. Assembling the Feigenbaum graphs for EEG signals. And calculating their average clustering, average degree, and average shortest path length. We manage to characterize two different data sets from each other.
Each data set consisted of focal and non-focal activity, from where epileptic regions could be identified. This method yields good results for identifying sets of data from epileptic zones. Suggesting our approach could be used to aid physicians with diagnosing epilepsy from EEG data.
Keywords: EEG, Epilepsy, Feigenbaum graphs, visibility graph
1 Introduction
Epilepsy is a disease that affects sixty five million people in different countries [1]. And two and a half million new cases are detected every year [1]. Epilepsy is a disease characterized, by an enduring predisposition to generate epileptic seizures. And by the neurobiological, cognitive, psychological, and social consequences of this condition [2].
Epileptic people are two or three times more likely to die prematurely [3]. And of the cases, begin in childhood or adolescence [4].
Epilepsy is characterized by seizures, which can affect persons of any age. The seizures can be as sparse as once a year, or as often as several times a day [5]. Seizure disorders are not necessarily epilepsy. Or in other words, not all seizures are epileptic fits [6, 7].
Epileptic seizures are unprovoked, due the involvement of the central nervous system. And, non-epileptic seizures could be due to several measurable causes [6]. Such as stroke, dementia, head injury, brain infections, congenital birth defects, birth-related brain injuries, tumors and other space occupying lesions [6, 8].
Given this factors, the importance of diagnosing epilepsy is very high [9]. And so, are the tools and techniques used and developed for this end [10, 11].
One of the procedures for diagnosing epilepsy, comes from analysing the EEG of a patient [12]. The EEG measures the electrical activity of the cortical area, by means of electrodes placed on the scalp of the patient [13]. More accurately, it measures the electrical potential of the dendrites of the neurons adjacent to cortical surface. Hence, the relevance of EEG analysis in diagnosing neural disorders, and epilepsy in particular [14].
Due to the fact that, EEG recordings are in essence a time series with lots of noise [15]. The task of analysing, and achieving a diagnosis, becomes a very difficult one [16, 17]. And requires a very well trained physician [9].
That is why many scientists, are trying to develop techniques to ease this workload, and facilitate the physician’s job [18, 19, 20].
One field of study of much relevance, is the automated EEG analysis. Which includes many computer aided algorithms, such as: component analysis [21], Fourier Transform [22, 23], wavelet transform [24, 25], and entropy analysis[26, 27, 28] among others [22, 29, 27, 30, 20].
Resenty Zhong-Ke Gao et al [31] presented a time-frequency visibility graph to classify epileptiform EEG data. They build the Adaptive Optimal time-frequency representation of the EEG, that renders a diagnostic energy distribution. Then, they assemble the visibility graphs, and classify them. Mainly by clustering coefficient, degree and coefficient entropy. Where they manage to achieve promising results to classify between, data with epileptiform activity and data without it.
Guohun Zhu et al [32] characterized sleep stages from EEG data. Using visibility graphs, and degree distributions for segments of single channel EEG recordings. They assembled the visibility graph, and subtracted a horizontal visibility graph edges, to obtain essential degree sequences. With this, they manage to obtain an accuracy for a six sleep stage classification.
On other hand, Deng Wang et al [33] manage to identify epilepsy seizure features. Using the basis-based wavelet packet entropy method, and a cross validation with the k-nearest neighbors. They manage to identify epilepsy on EEG recordings, with accuracy of about . Via 2- ,5-, and 10-fold cross validation.
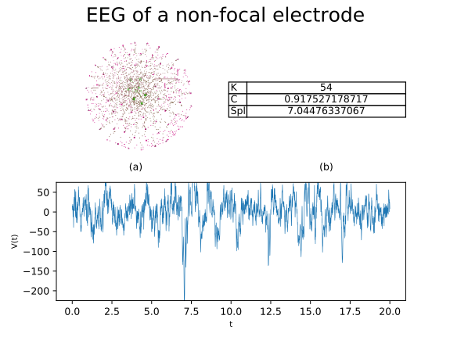
In this study, we use Feigenbaum graphs to analyse EEG data from [34]. Using statistical criteria, such as average shortest path length and average clustering coefficient. We discern between signals “F” form a focal region, and “N” from the non focal region.
The data was taken from intracranial EEG, from five different epileptic patients. It was divided into two different datasets: the F set, that is the data from the focal epileptic point. The focal point was identified as the first electrode that measure the epileptic seizure. And the “N” set, that is the data from the non focal point. A non focal point is any other point that didn’t shows the epileptic seizure first [34].
2 Theory
2.1 Feigenbaum graphs
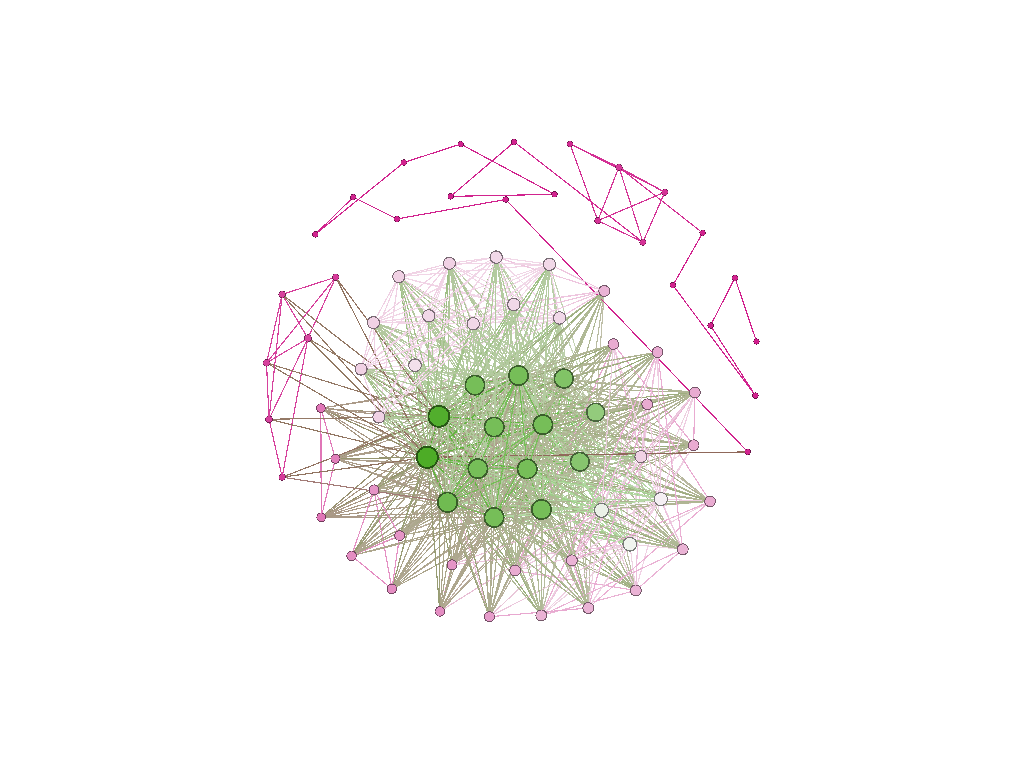
The Feigenbaum graphs are a tool to characterize time series data, by constructing a network from a given time series data set [35, 36]. Where the structure of the network, subtracts important information from the time series [37, 38, 39, 40].
The process for building the network is as follows: for each point in the data set, a node is added to the network. Then for each pair of points, and in the set. Every time the criterion , for all , such that is met. An edge is added between nodes and [6, 39].
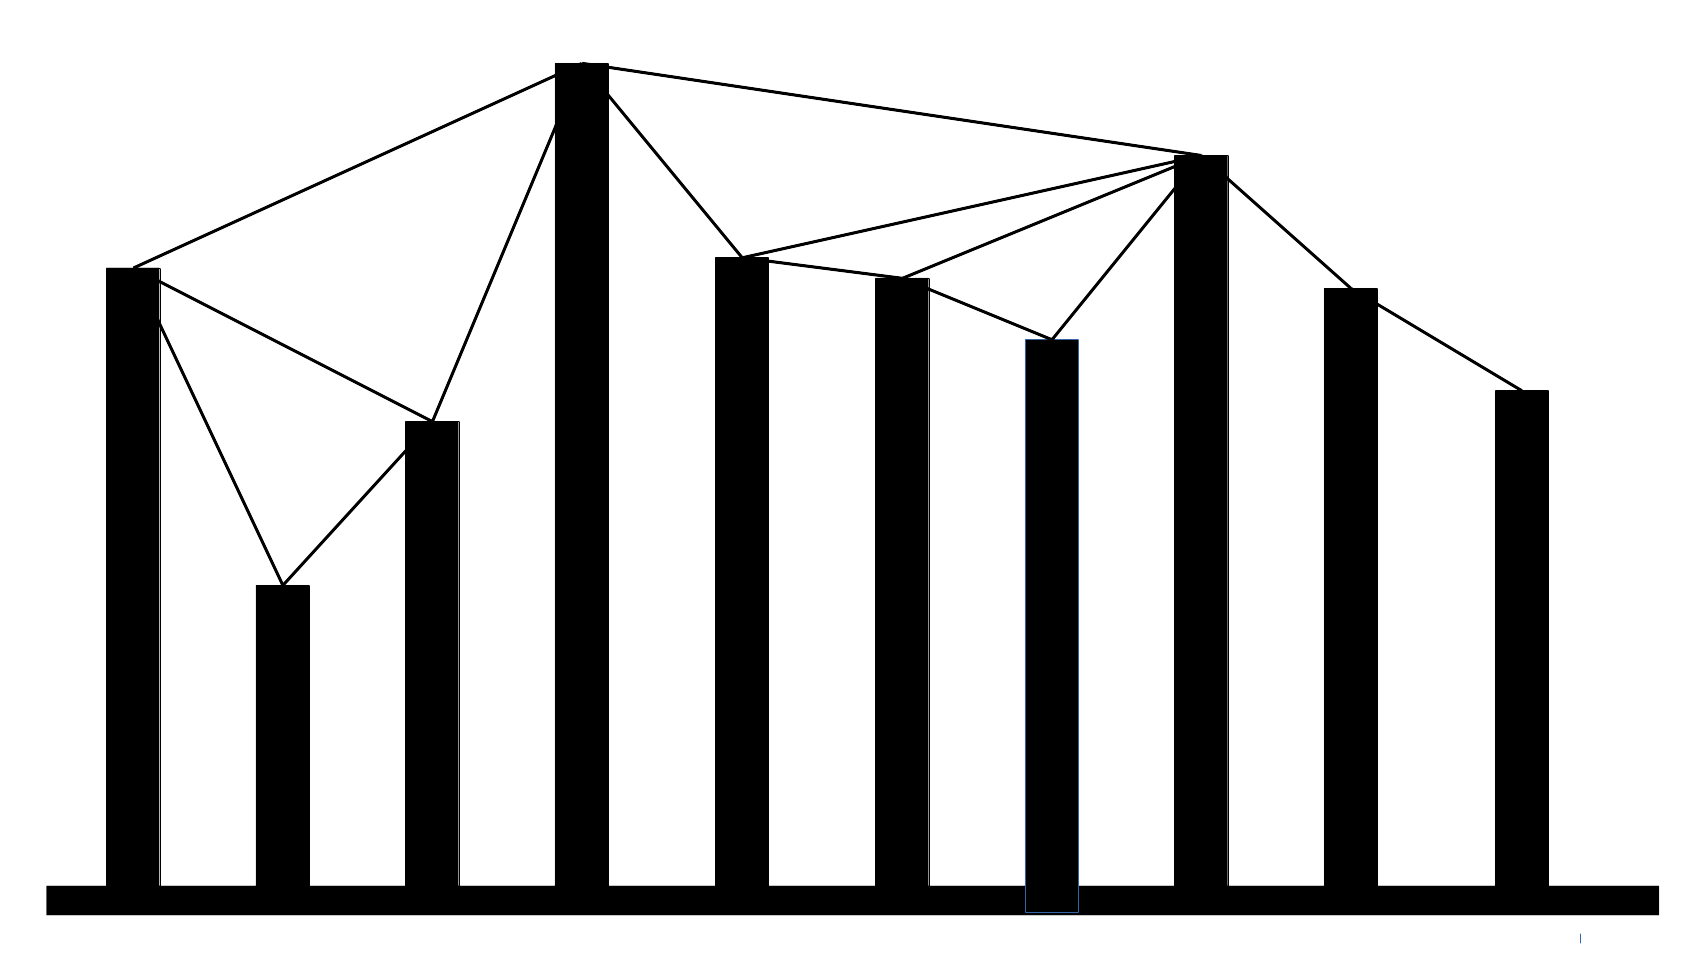
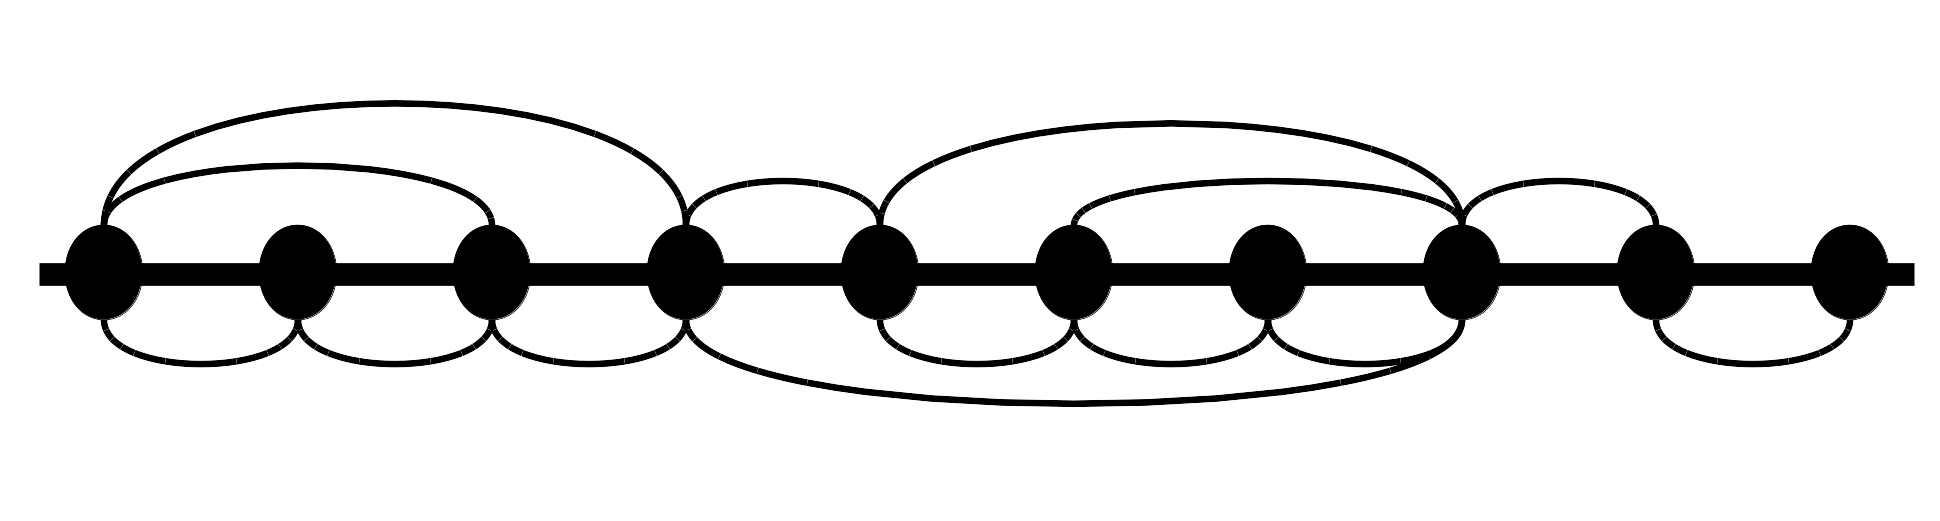
Take the EEG from figure 5. For each data point, a node is added to the network in figure 6. And the edges are created following the procedure in figures 3 and 4 .
3 Statistical measurements
Having assembled the Feigenbaum graphs, we proceeded to analyse them. To find a measure to characterize them as “N” or “F” whichever was the case.
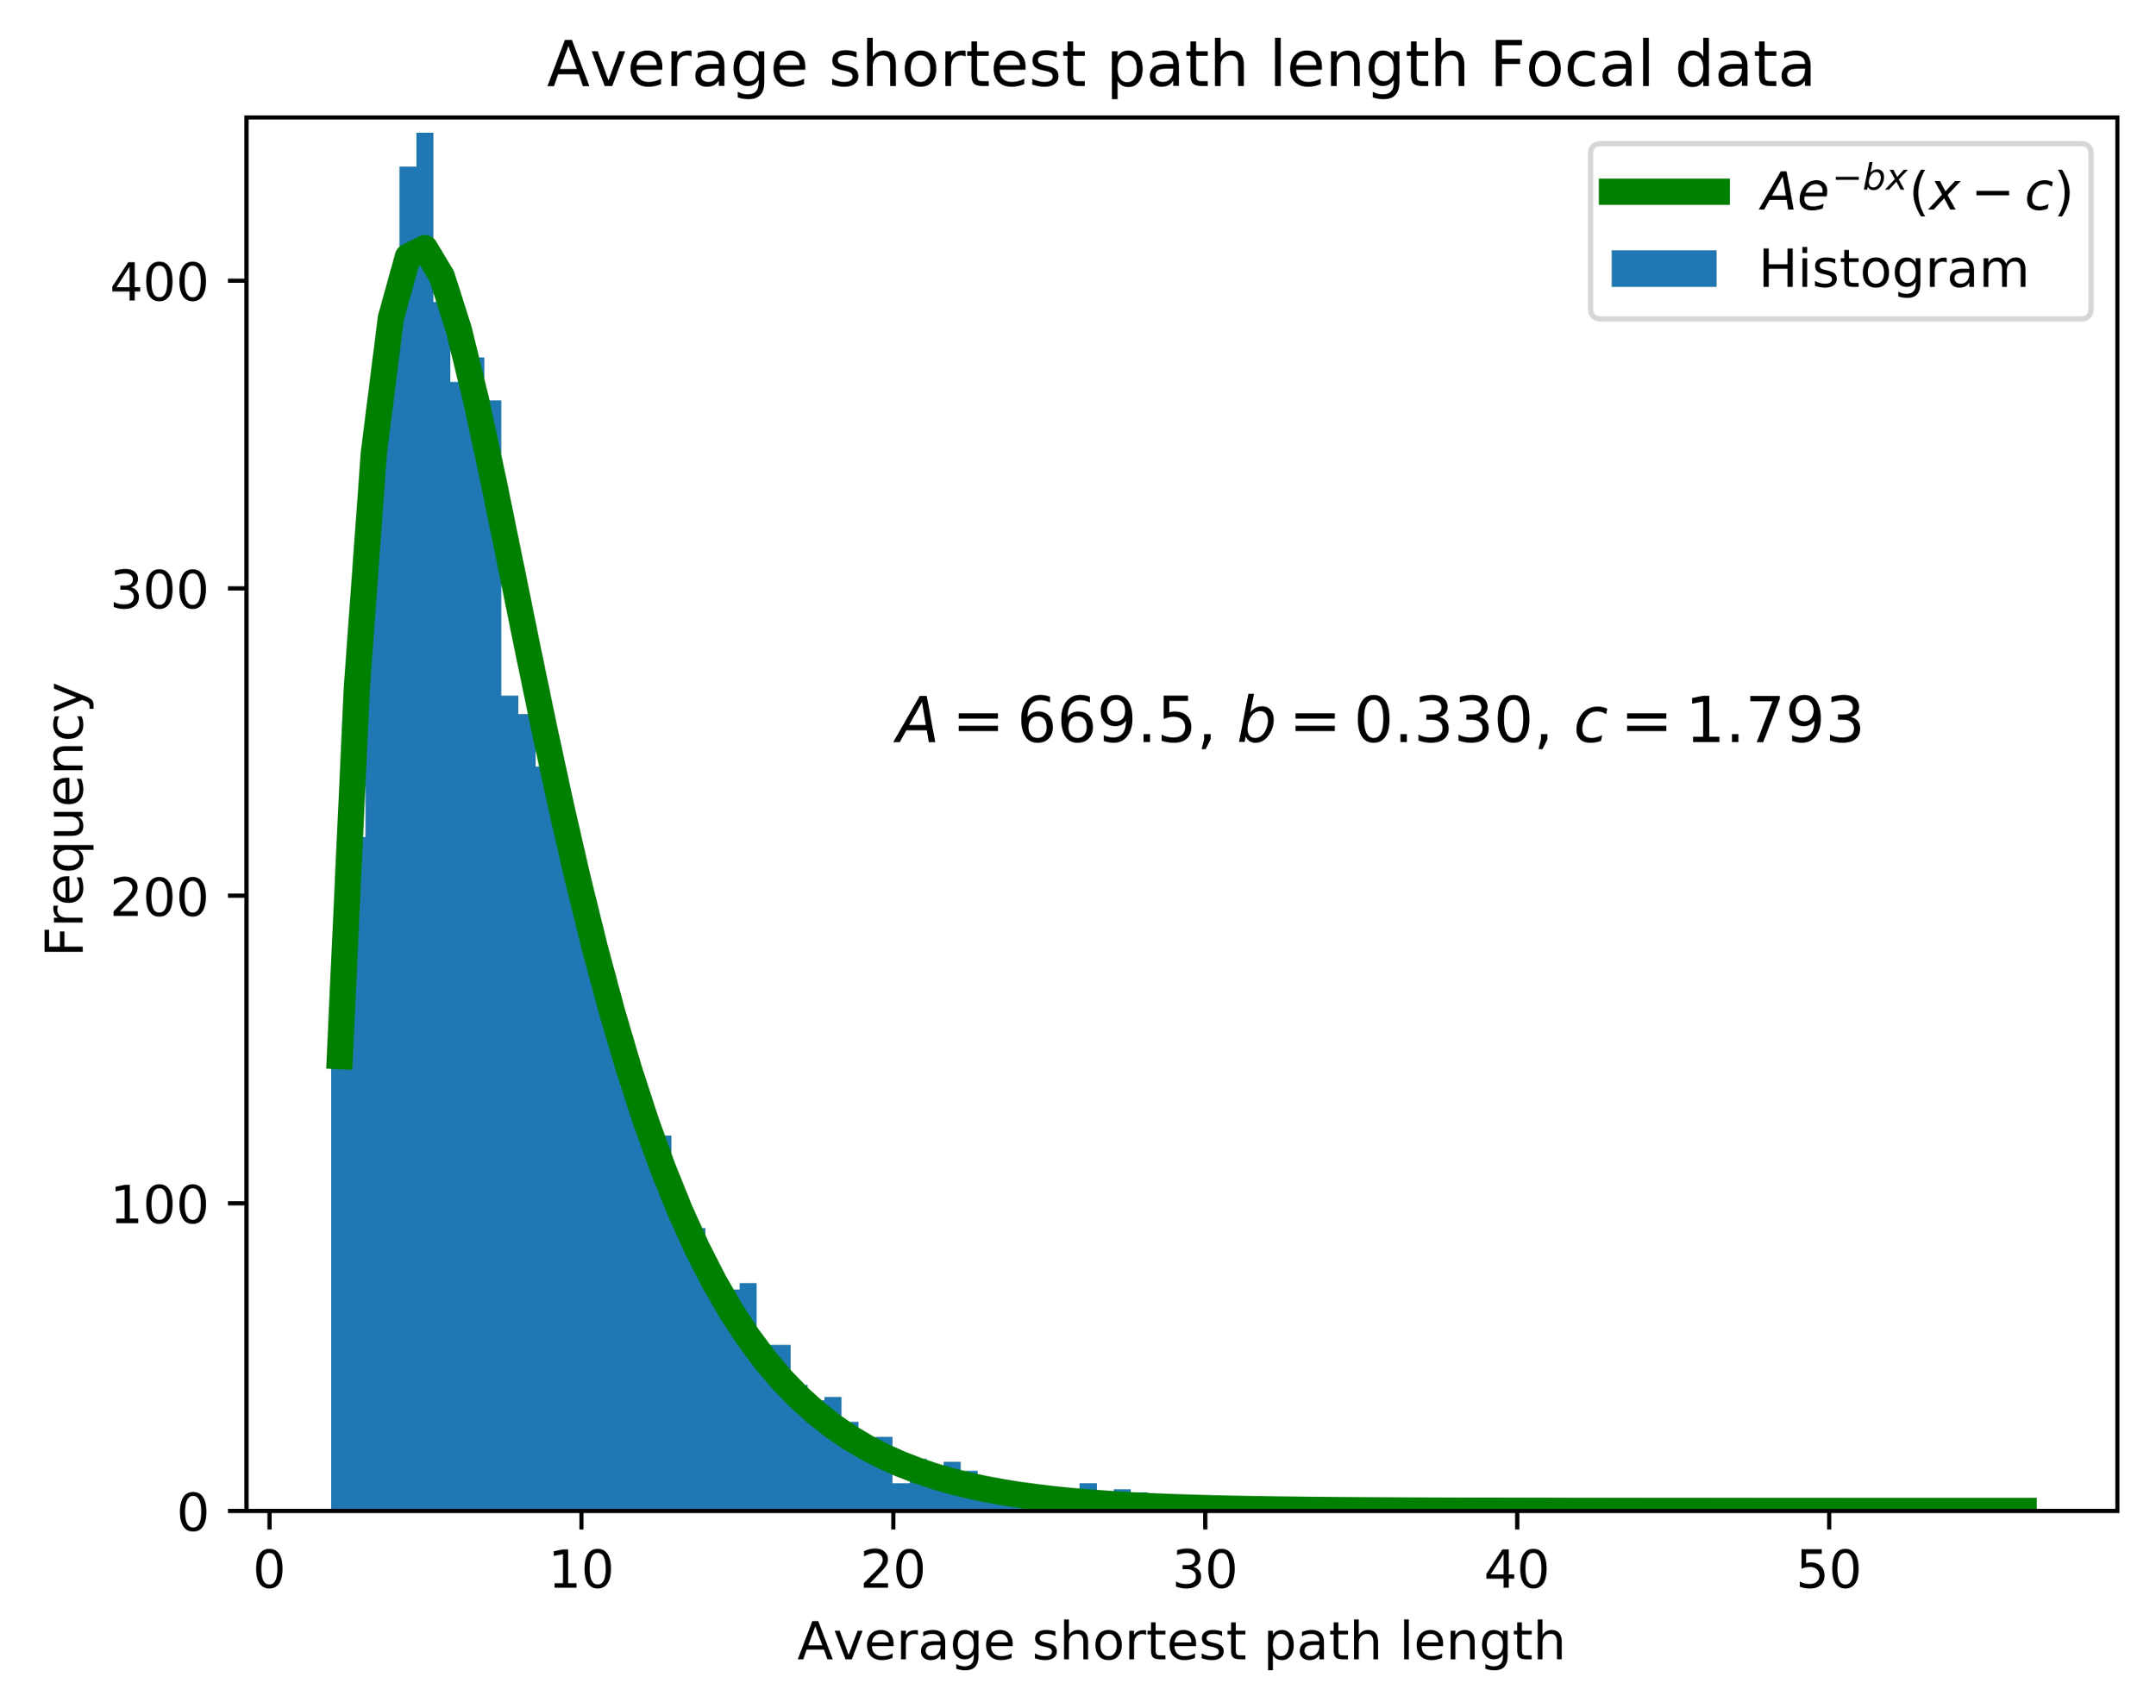
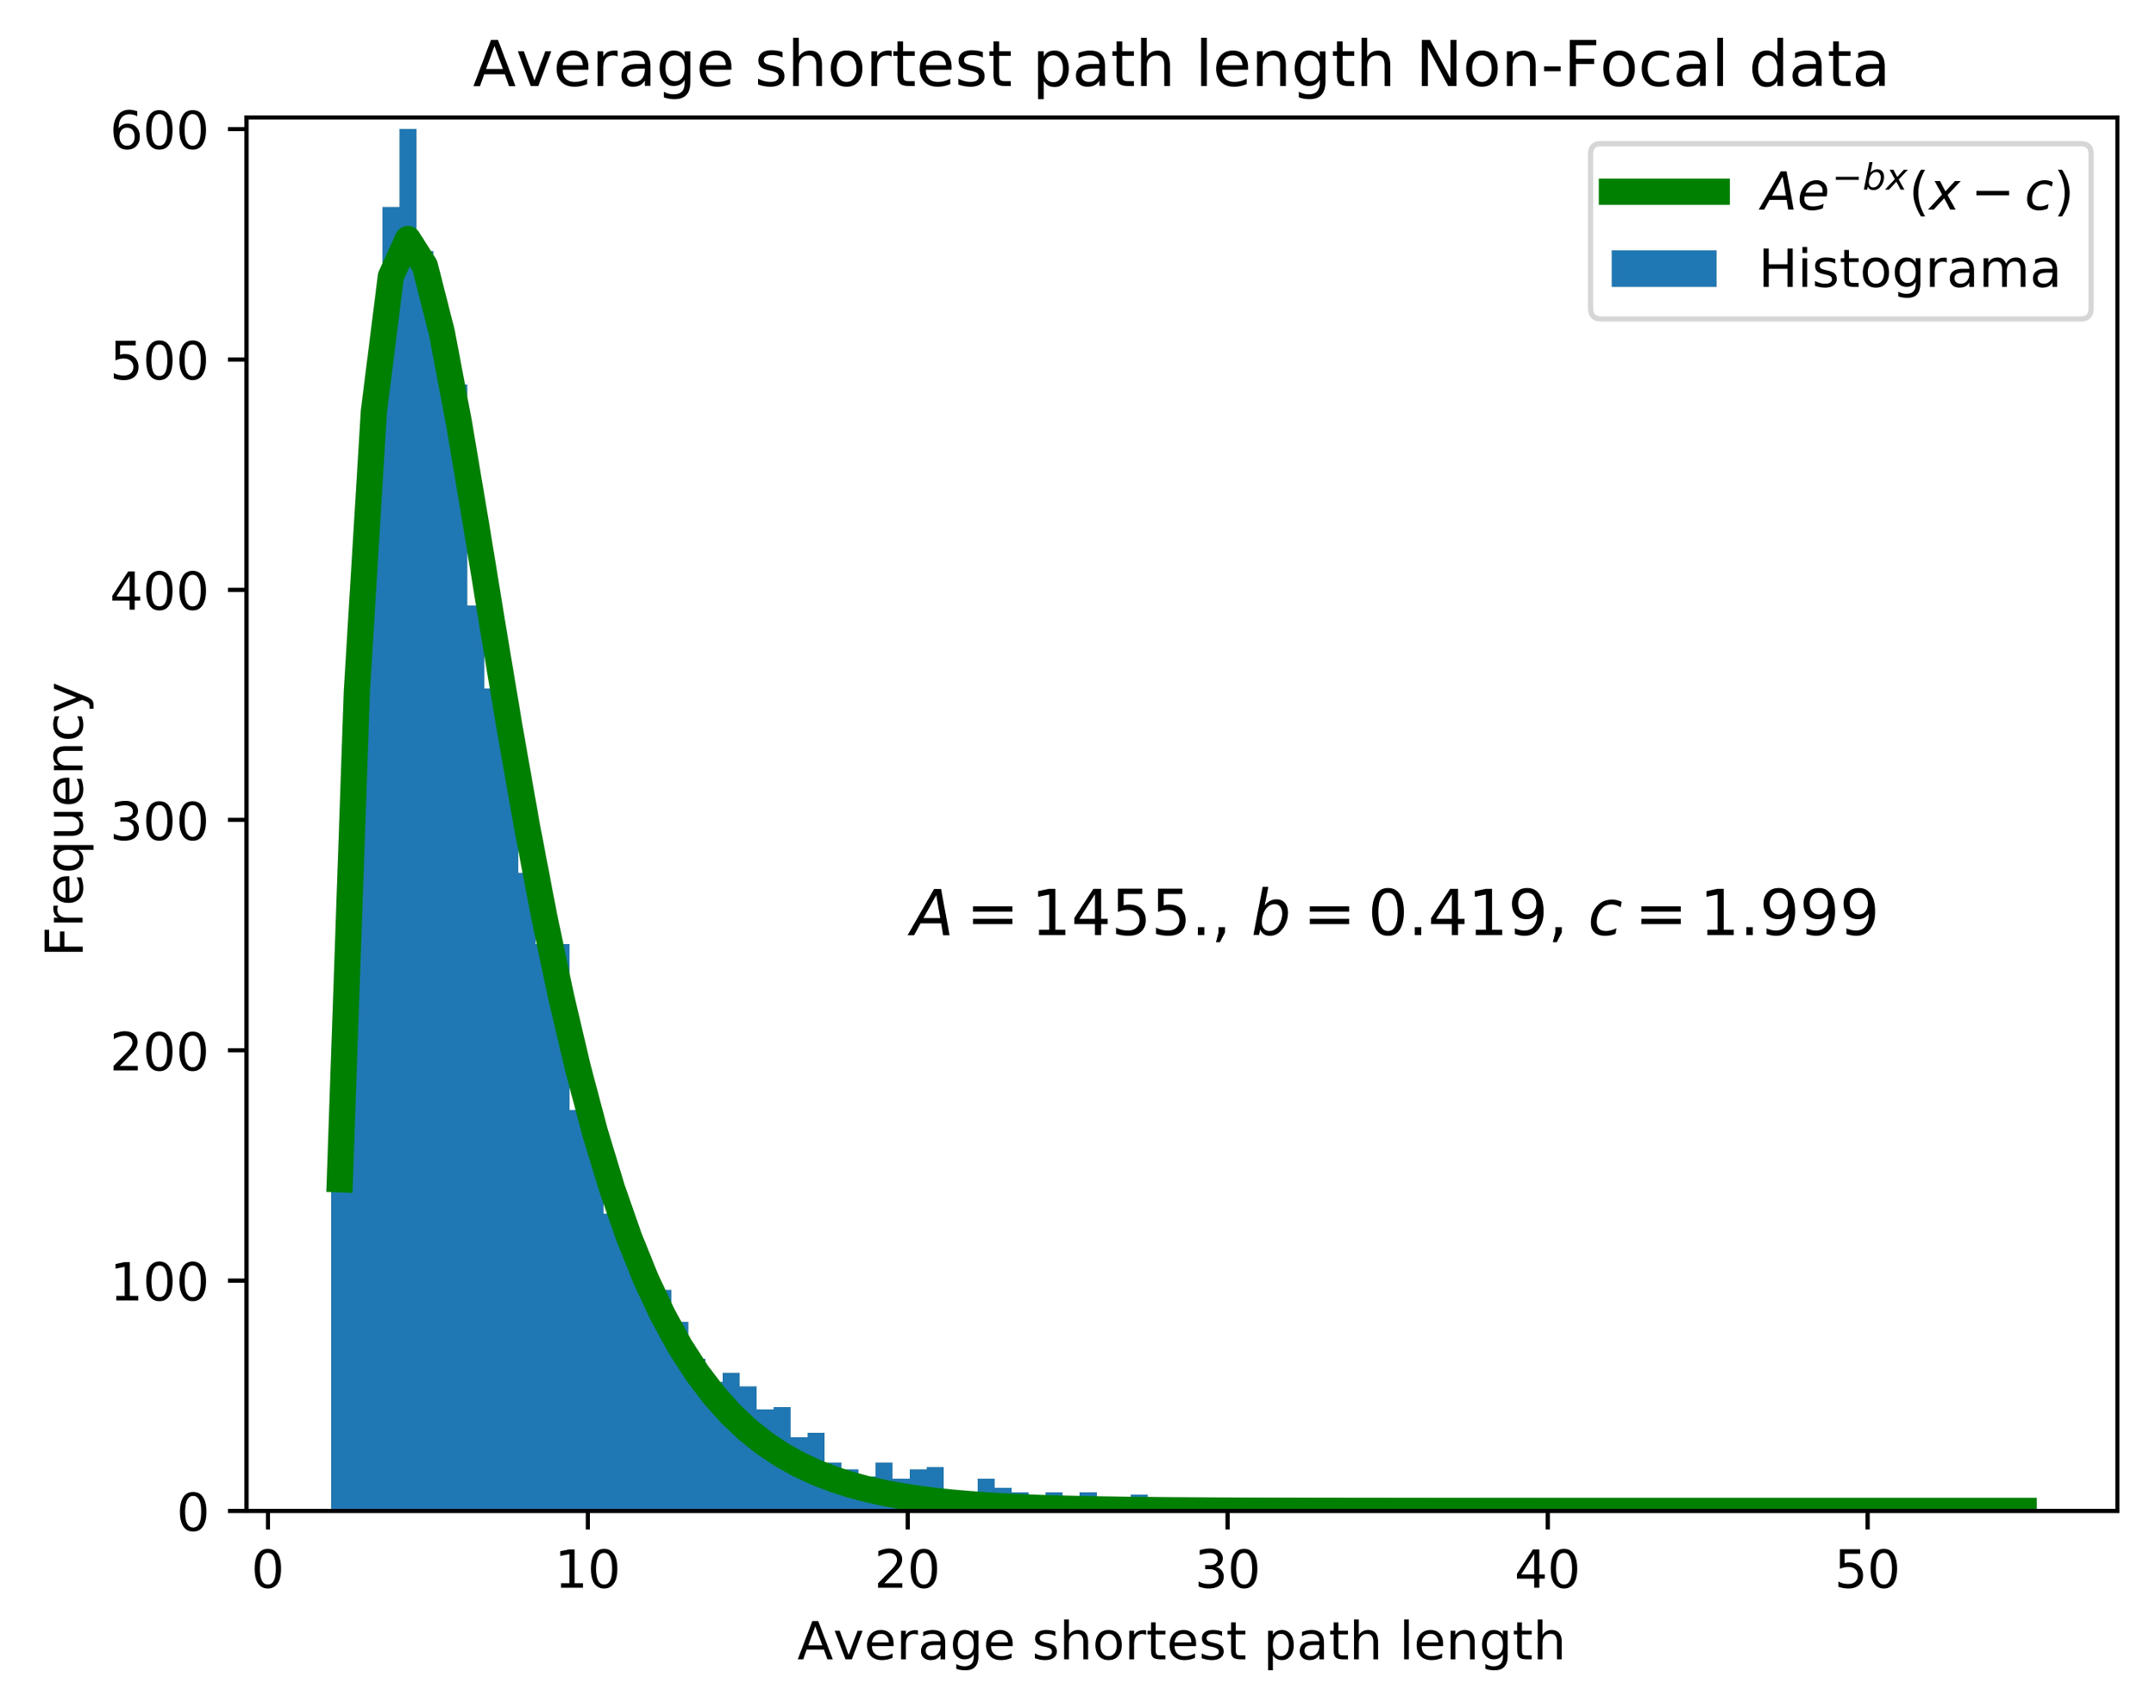
For this end, we calculated the average shortest path length for each graph. Which has a direct correlation to the size of the graph, and the data itself. On other hand, we calculated the average clustering coefficient. That is a measurement, of how the network is connected. And has correlation with how auto-similar the data is.
| (1) |
Where is the number of nodes in the network , and is the clustering coefficient for each node .
| (2) |
Where is the number of triangles through node , and is the degree of .
| (3) |
Where is the set of nodes in the graph, is the shortest path length from to . And is the number of nodes in the graph.
4 Results and Discussion
For each EEG signal in the data set, a feigenbaum graph was generated. Once all the graphs for each signal type (focal “F” and non-focal “N”) were obtained. The average shortest path length is calculated. The same as average clustering coefficient.
This renders two numbers to characterize each signal. Since we aim to characterize the data set as a hole. A distribution of this single parameter values comes in hand. Hence the figures 8, 9, 11, and 12.
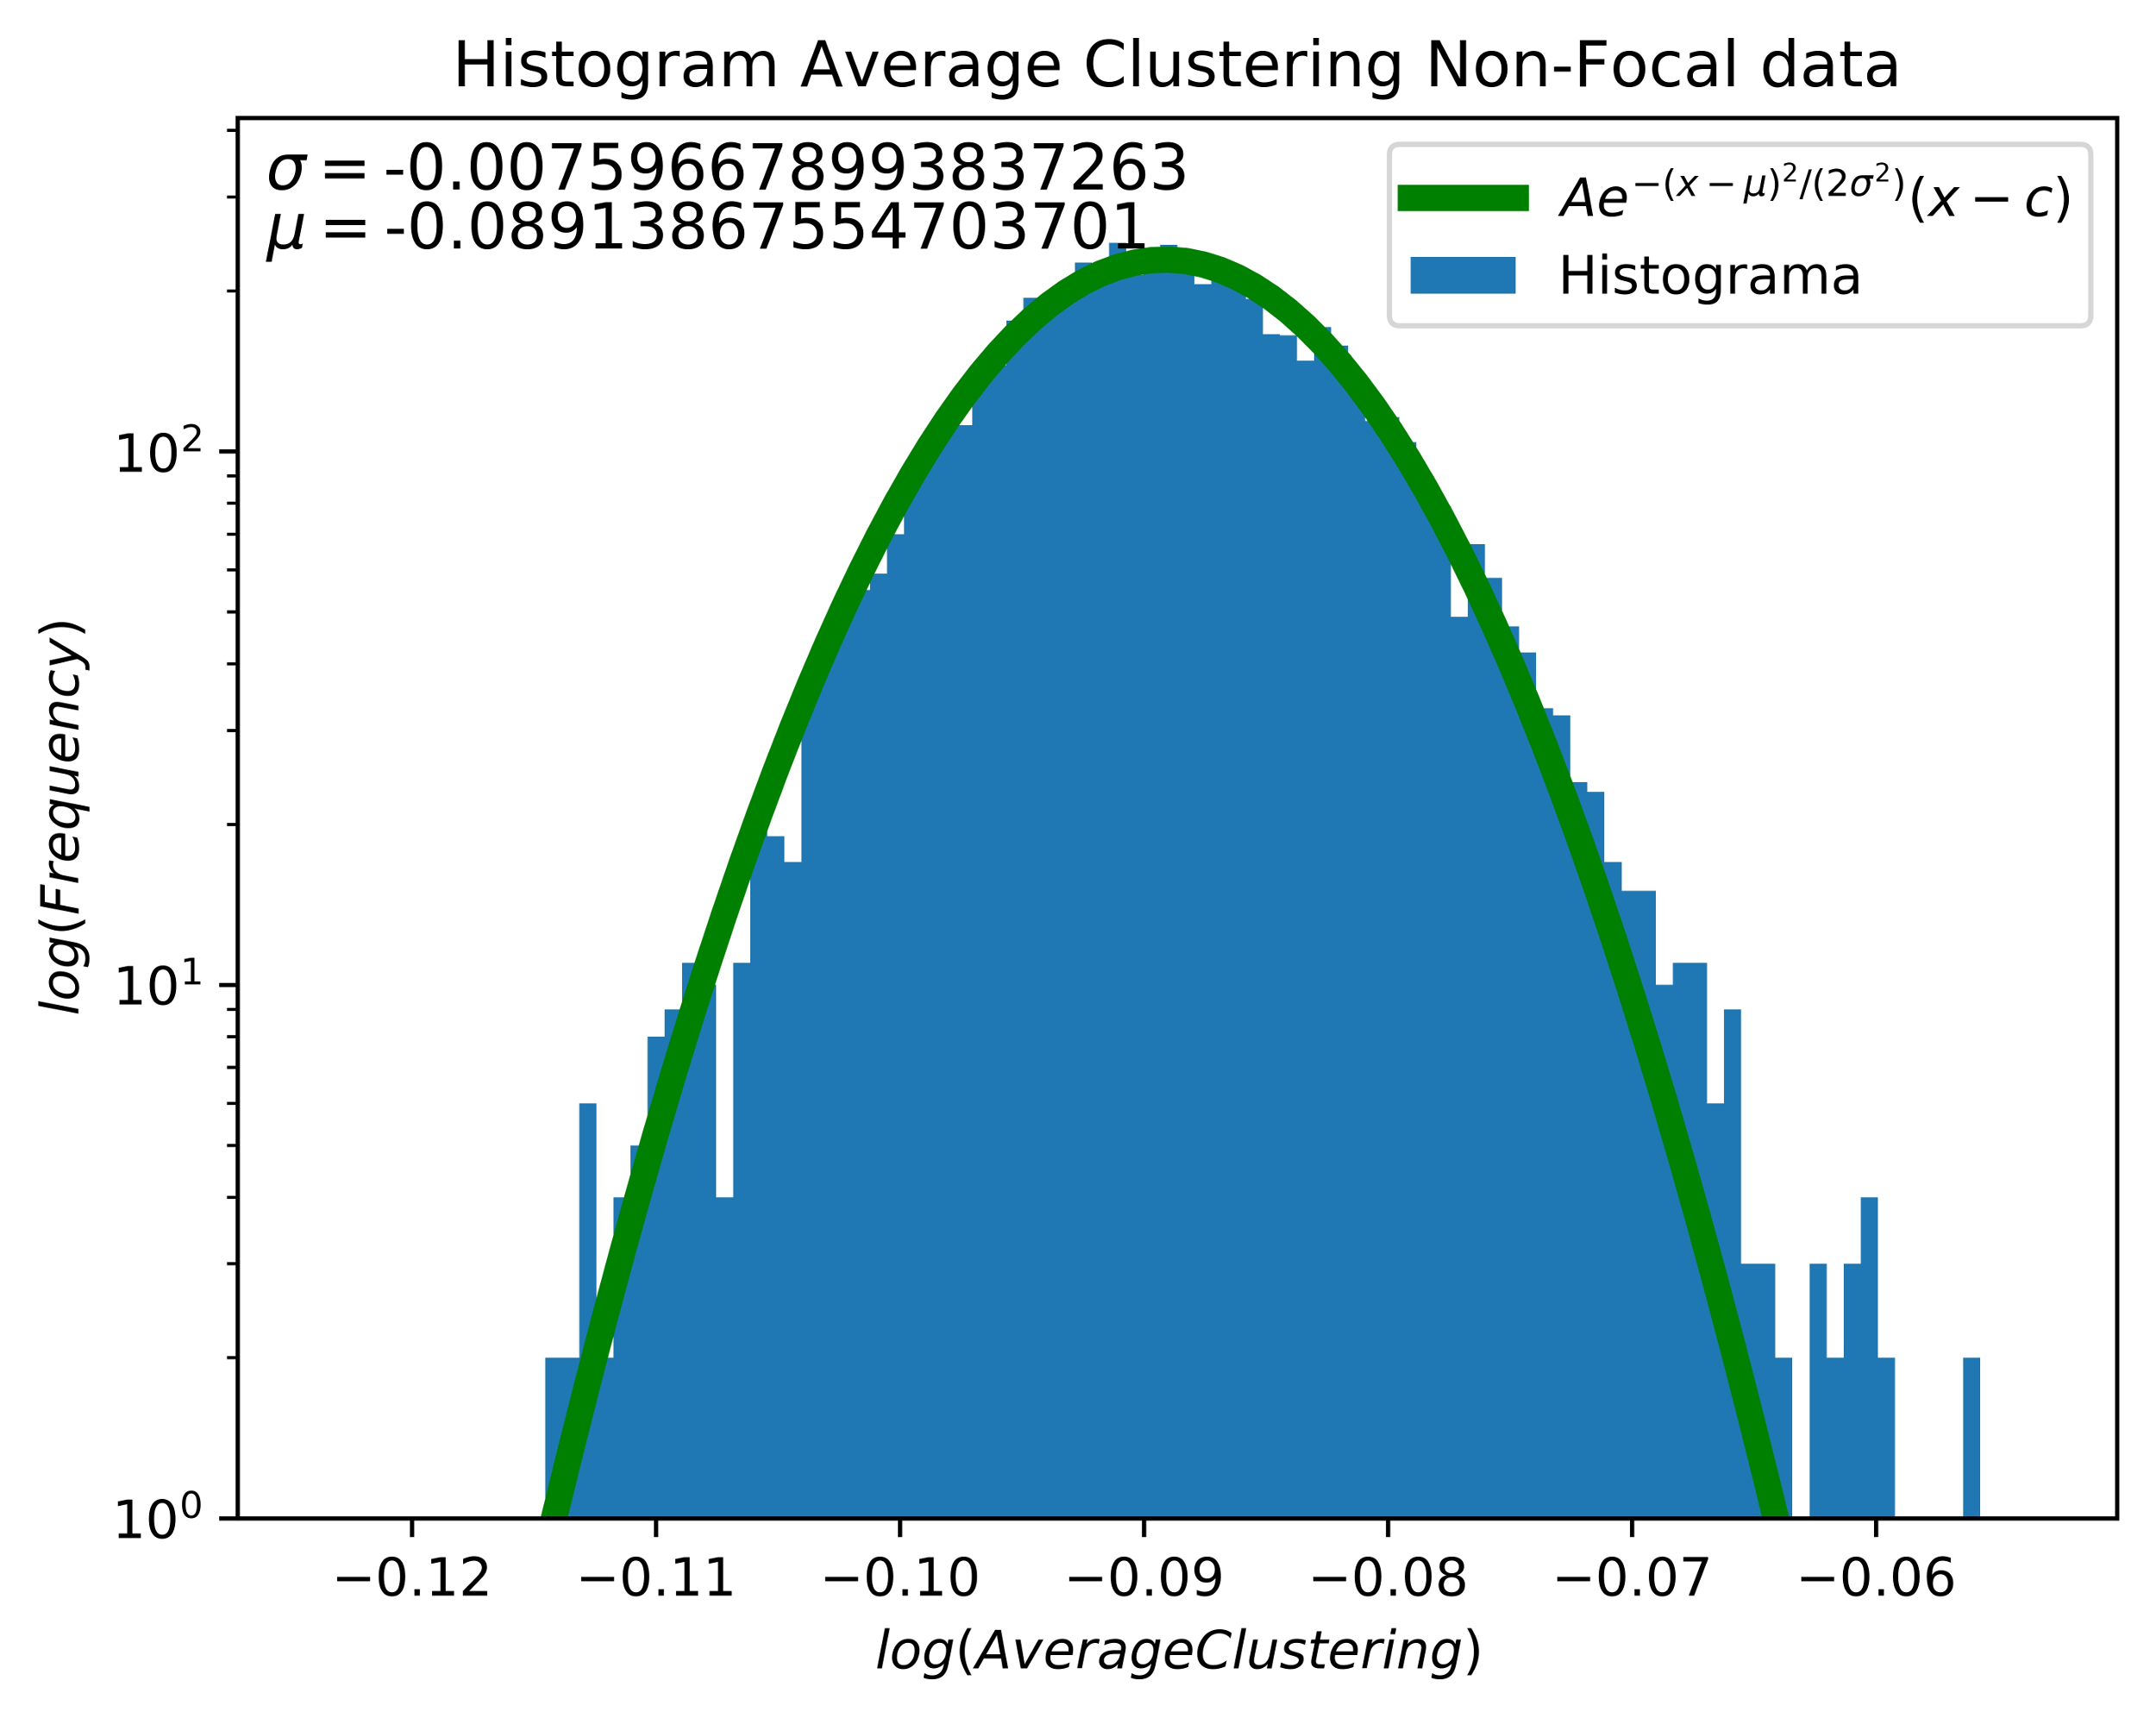
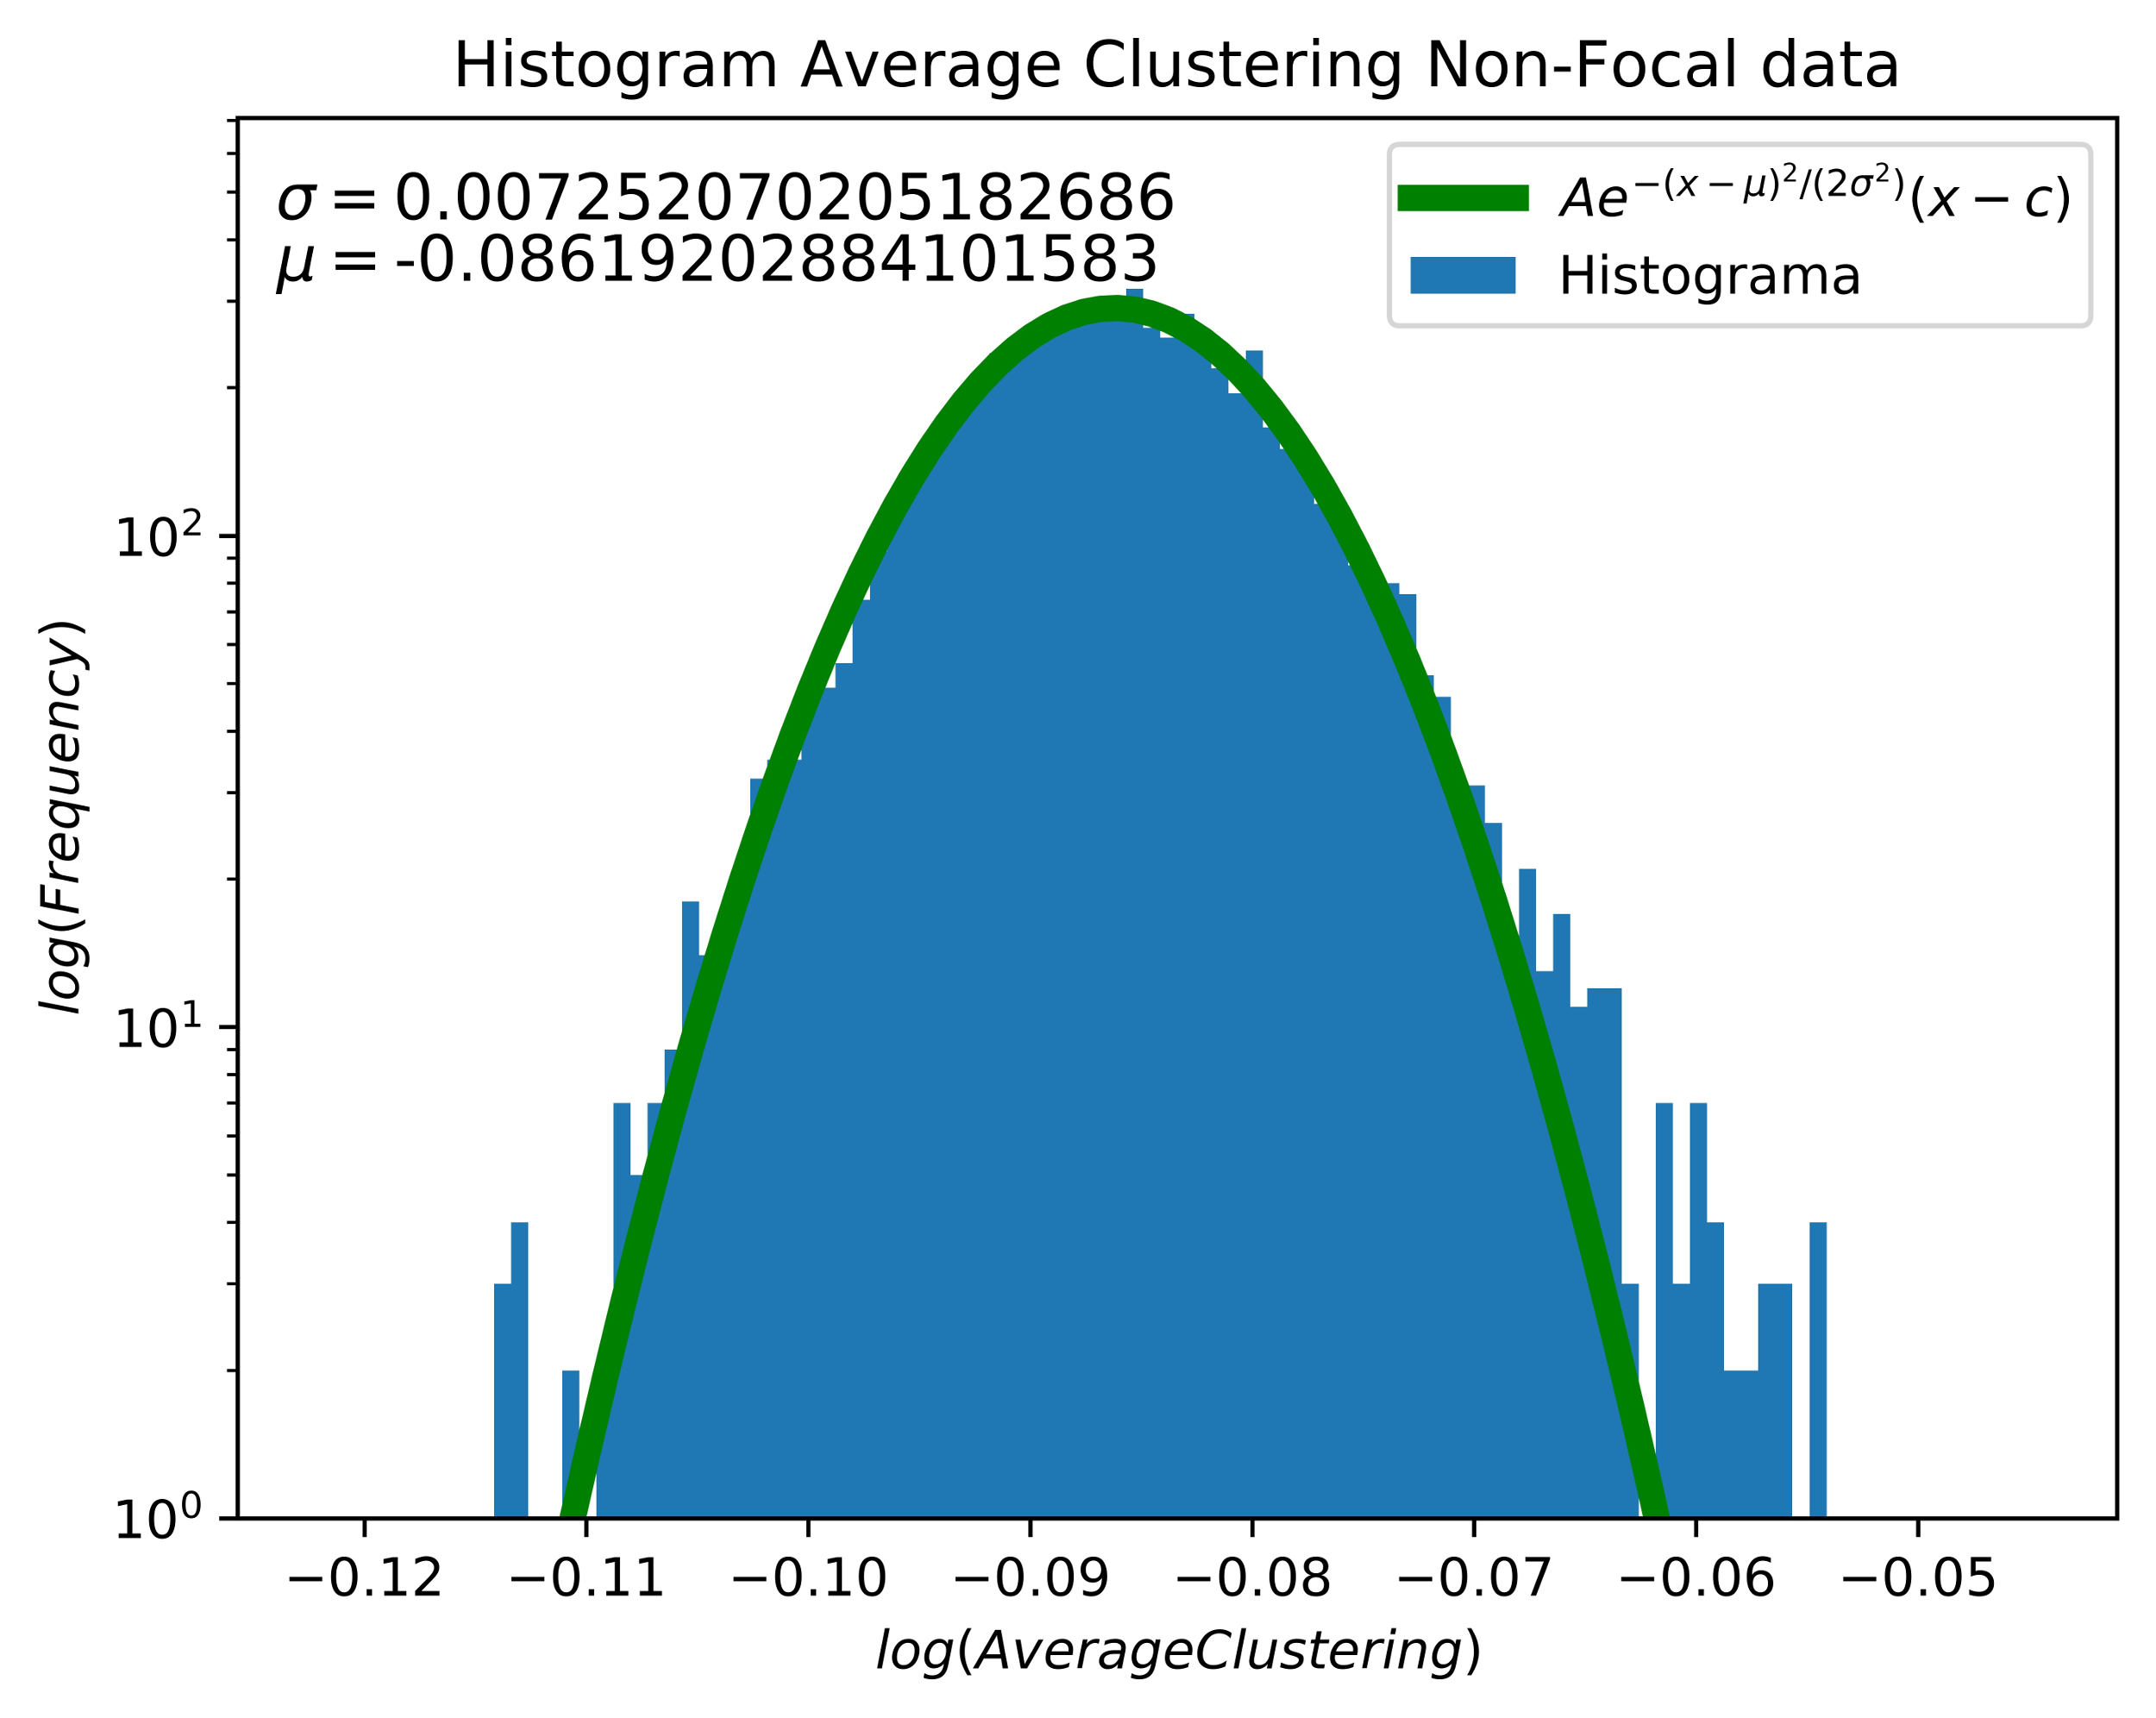
Since the difference of parameters in average clustering coefficient fits, is not significant enough. The clustering coefficient, should not be considered as a good measurement for classification and desertion between the two data sets.
However, the difference in parameters for the curve fit for the average shortest path length distributions is significant. And given the data set is assembled in such a way, that does not include epileptogenic activity [34]. It is a measurement of different states of neural configurations.
Since activity for epileptic and non epileptic neural configurations are compiled in the database. And the difference in parameters and is significant. It suggests that it could be a measurement for epilepsy, or epileptic neural configurations, for any patient.
5 Conclusions
In this work we propose a new method to identify epileptic focal zones from the [34] database. Which we manage by assembling the Feigenbaum graph. And calculating the average shortest path length, and average clustering coefficient for every dataset.
The average clustering coefficient, turns to be not helpful in the desertion from different states of the data set. The average shortest path length does.
Following the idea and the way the dataset is assembled. This measurement could be calculated for a single patient. By assembling a dataset created from segments of EEG studies, no matter the time line.
Suggesting the calculation of the curve fit for the average shortest path length distribution, of Feigenbaum graphs of the dataset. Could help the physician assess a better diagnosis for the patient.
Acknowledgments
We are grateful for the facilities provided by the Laboratorio Nacional de Supercómputo (LNS) del Sureste de México to obtain these results.
References
- [1] Epilepsy Foundation. https://www.epilepsy.com/. Accessed: 2018-08-27.
- [2] Deborah Buck, Gus A Baker, Ann Jacoby, David F Smith, and David W Chadwick. Patients’ Experiences of Injury as a Result of Epilepsy. Epilepsia, 38(4):439–444, 1997.
- [3] Leone Ridsdale. Avoiding premature death in epilepsy. BMJ, 350, 2015.
- [4] A. T. Berg, F. A. Zelko, S. R. Levy, and F. M. Testa. Age at onset of epilepsy, pharmacoresistance, and cognitive outcomes: a prospective cohort study. Neurology, 79(13):1384–1391, Sep 2012.
- [5] W. Allen Hauser, John F. Annegers, and Leonard T. Kurland. Incidence of Epilepsy and Unprovoked Seizures in Rochester, Minnesota: 1935–1984. Epilepsia, 34(3):453–458.
- [6] N M G Bodde, J L Brooks, G A Baker, P A J M Boon, J G M Hendriksen, O G Mulder, and A P Aldenkamp. Psychogenic non-epileptic seizures–definition, etiology, treatment and prognostic issues: a critical review. Seizure, 18(8):543–553, October 2009.
- [7] M. Bandarabadi, J. Rasekhi, C. A. Teixeira, M. R. Karami, and A. Dourado. On the proper selection of preictal period for seizure prediction. Epilepsy Behav, 46:158–166, May 2015.
- [8] C. Zhou, L. Zemanova, G. Zamora, C. C. Hilgetag, and J. Kurths. Hierarchical organization unveiled by functional connectivity in complex brain networks. Phys. Rev. Lett., 97(23):238103, Dec 2006.
- [9] W. Ian McDonald, Alistair Compston, Gilles Edan, Donald Goodkin, Hans-Peter Hartung, Fred D. Lublin, Henry F. McFarland, Donald W. Paty, Chris H. Polman, Stephen C. Reingold, Magnhild Sandberg-Wollheim, William Sibley, Alan Thompson, Stanley Van Den Noort, Brian Y. Weinshenker, and Jerry S. Wolinsky. Recommended diagnostic criteria for multiple sclerosis: Guidelines from the international panel on the diagnosis of multiple sclerosis. Annals of Neurology, 50(1):121–127.
- [10] Srimonti Dutta, Dipak Ghosh, Shukla Samanta, and Santanu Dey. Multifractal parameters as an indication of different physiological and pathological states of the human brain. Physica A: Statistical Mechanics and its Applications, 396:155–163, 2014.
- [11] Klaus Lehnertz, Gerrit Ansmann, Stephan Bialonski, Henning Dickten, Christian Geier, and Stephan Porz. Evolving networks in the human epileptic brain. Physica D: Nonlinear Phenomena, 267:7–15, 2014. Evolving Dynamical Networks.
- [12] L. Kuhlmann, P. Karoly, D. R. Freestone, B. H. Brinkmann, A. Temko, A. Barachant, F. Li, G. Titericz, B. W. Lang, D. Lavery, K. Roman, D. Broadhead, S. Dobson, G. Jones, Q. Tang, I. Ivanenko, O. Panichev, T. Proix, M. Nahlik, D. B. Grunberg, C. Reuben, G. Worrell, B. Litt, D. T. J. Liley, D. B. Grayden, and M. J. Cook. Epilepsyecosystem.org: crowd-sourcing reproducible seizure prediction with long-term human intracranial EEG. Brain, Aug 2018.
- [13] M. R. Nuwer. The development of EEG brain mapping. J Clin Neurophysiol, 7(4):459–471, Oct 1990.
- [14] Dipak Ghosh, Srimonti Dutta, and Sayantan Chakraborty. Multifractal detrended cross-correlation analysis for epileptic patient in seizure and seizure free status. Chaos, Solitons & Fractals, 67:1–10, 2014.
- [15] Ralph G. Andrzejak, Klaus Lehnertz, Florian Mormann, Christoph Rieke, Peter David, and Christian E. Elger. Indications of nonlinear deterministic and finite-dimensional structures in time series of brain electrical activity: Dependence on recording region and brain state. Phys. Rev. E, 64:061907, Nov 2001.
- [16] Oliver Faust, U. Rajendra Acharya, Hojjat Adeli, and Amir Adeli. Wavelet-based EEG processing for computer-aided seizure detection and epilepsy diagnosis. Seizure, 26:56–64, 2015.
- [17] Sheng-Fu Liang, Hsu-Chuan Wang, and Wan-Lin Chang. Combination of EEG Complexity and Spectral Analysis for Epilepsy Diagnosis and Seizure Detection. EURASIP J. Adv. Signal Process, 2010:62:1–62:15, February 2010.
- [18] U. Rajendra Acharya, S. Vinitha Sree, G. Swapna, Roshan Joy Martis, and Jasjit S. Suri. Automated EEG analysis of epilepsy: A review. Knowledge-Based Systems, 45:147–165, 2013.
- [19] Mehran Ahmadlou, Anahita Adeli, Ricardo Bajo, and Hojjat Adeli. Complexity of functional connectivity networks in mild cognitive impairment subjects during a working memory task. Clinical Neurophysiology, 125(4):694–702, 2014.
- [20] U. R. Acharya, V. K. Sudarshan, H. Adeli, J. Santhosh, J. E. Koh, and A. Adeli. Computer-Aided Diagnosis of Depression Using EEG Signals. Eur. Neurol., 73(5-6):329–336, 2015.
- [21] R.O. Duda, P.E. Hart, and D.G. Stork, Pattern Classification, New York: John Wiley & Sons, 2001, pp. xx 654, ISBN: 0-471-05669-3. J. Classification, 24(2):305–307, 2007.
- [22] P Welch. The use of fast Fourier transform for the estimation of power spectra: A method based on time averaging over short, modified periodograms. IEEE Trans. Audio Electroacoust., 15(2):70–73, June 1967.
- [23] A. Scheffler, D. Telesca, Q. Li, C. A. Sugar, C. Distefano, S. Jeste, and D. Senturk. Hybrid principal components analysis for region-referenced longitudinal functional EEG data. Biostatistics, Aug 2018.
- [24] H. Adeli, Z. Zhou, and N. Dadmehr. Analysis of EEG records in an epileptic patient using wavelet transform. J. Neurosci. Methods, 123(1):69–87, Feb 2003.
- [25] S. Ghosh-Dastidar, H. Adeli, and N. Dadmehr. Mixed-Band Wavelet-Chaos-Neural Network Methodology for Epilepsy and Epileptic Seizure Detection. IEEE Transactions on Biomedical Engineering, 54(9):1545–1551, Sept 2007.
- [26] Z. Czechowski, M. Lovallo, and L. Telesca. Multifractal analysis of visibility graph-based Ito-related connectivity time series. Chaos, 26(2):023118, Feb 2016.
- [27] U Rajendra Acharya, Hamido Fujita, Vidya K Sudarshan, Shreya Bhat, and Joel En Wei Koh. Application of entropies for automated diagnosis of epilepsy using EEG signals: A review. 88, 08 2015.
- [28] G. Ouyang, J. Li, X. Liu, and X. Li. Dynamic characteristics of absence EEG recordings with multiscale permutation entropy analysis. Epilepsy Res., 104(3):246–252, May 2013.
- [29] M Vetterli and C Herley. Wavelets and filter banks: theory and design. IEEE Trans. Signal Process., 40(9):2207–2232, 1992.
- [30] Juan P. Amezquita-Sanchez and Hojjat Adeli. A New Music-empirical Wavelet Transform Methodology for Time-frequency Analysis of Noisy Nonlinear and Non-stationary Signals. Digit. Signal Process., 45(C):55–68, October 2015.
- [31] Zhong-Ke Gao, Qing Cai, Yu-Xuan Yang, Na Dong, and Shan-Shan Zhang. Visibility Graph from Adaptive Optimal Kernel Time-Frequency Representation for Classification of Epileptiform EEG. Int. J. Neural Syst., 27(4):1750005, June 2017.
- [32] Guohun Zhu, Yan Li, and Peng Paul Wen. Analysis and classification of sleep stages based on difference visibility graphs from a single-channel EEG signal. IEEE J Biomed Health Inform, 18(6):1813–1821, November 2014.
- [33] Deng Wang, Duoqian Miao, and Chen Xie. Best basis-based wavelet packet entropy feature extraction and hierarchical EEG classification for epileptic detection. Expert Syst. Appl., 2011.
- [34] Ralph G Andrzejak, Kaspar Schindler, and Christian Rummel. Nonrandomness, nonlinear dependence, and nonstationarity of electroencephalographic recordings from epilepsy patients. Phys. Rev. E Stat. Nonlin. Soft Matter Phys., 86(4 Pt 2):046206, October 2012.
- [35] Zhong-Ke Gao, Yu-Xuan Yang, Peng-Cheng Fang, Yong Zou, Cheng-Yi Xia, and Meng Du. Multiscale complex network for analyzing experimental multivariate time series. 109, 02 2015.
- [36] S. Bhaduri and D. Ghosh. Electroencephalographic Data Analysis With Visibility Graph Technique for Quantitative Assessment of Brain Dysfunction. Clin EEG Neurosci, 46(3):218–223, Jul 2015.
- [37] Xiaoke Xu, Jie Zhang, and Michael Small. Superfamily phenomena and motifs of networks induced from time series. Proc. Natl. Acad. Sci. U. S. A., 105(50):19601–19605, December 2008.
- [38] Lucas Lacasa and Raul Toral. Description of stochastic and chaotic series using visibility graphs. Phys. Rev. E Stat. Nonlin. Soft Matter Phys., 82(3 Pt 2):036120, September 2010.
- [39] Bartolo Luque, Lucas Lacasa, Fernando J Ballesteros, and Alberto Robledo. Feigenbaum graphs: a complex network perspective of chaos. PLoS One, 6(9):e22411, September 2011.
- [40] Zhong-Ke Gao and Ning-De Jin. A directed weighted complex network for characterizing chaotic dynamics from time series. Nonlinear Analysis: Real World Applications, 13(2):947–952, 2012.
- [41] Jari Saramäki, Mikko Kivelä, Jukka-Pekka Onnela, Kimmo Kaski, and János Kertész. Generalizations of the clustering coefficient to weighted complex networks. Phys. Rev. E, 75:027105, Feb 2007.
- [42] Marcus Kaiser. Mean clustering coefficients: the role of isolated nodes and leafs on clustering measures for small-world networks. New Journal of Physics, 10(8):083042, 2008.
- [43] Jukka-Pekka Onnela, Jari Saramäki, János Kertész, and Kimmo Kaski. Intensity and coherence of motifs in weighted complex networks. Phys. Rev. E, 71:065103, Jun 2005.
- [44] Danny Z. Chen. Developing Algorithms and Software for Geometric Path Planning Problems. ACM Comput. Surv., 28(4es), December 1996.