Young open cluster IC 4996 and its vicinity: multicolor photometry and Gaia DR2 astrometry††thanks: Tables 1, 2, 4 and 5 are only available in electronic form at the CDS via anonymous ftp to cdsarc.u-strasbg.fr (130.79.128.5) or via http://cdsweb.u-strasbg.fr/cgi-bin/qcat?J/A+A/
The open cluster IC 4996 in Cygnus and its vicinity are investigated by applying a two-dimensional photometric classification of stars measured in the Vilnius seven-color photometric system. Cluster members are identified by applying distances based on the Gaia DR2 parallaxes and the point vector diagram of the Gaia DR2 proper motions. For some B-type stars, spectroscopic MK types are also obtained from the Asiago spectra and collected from the literature. New parameters of the cluster are derived. The interstellar extinction covers a wide range of values, from 1.3 to 2.4 mag; the mean value in the central part of the cluster is 1.8 mag. The cluster distance is 1915 110 pc, and its age is within 8–10 Myr. The cluster exhibits a long sequence from early-B to G stars, where stars cooler than B8 are in the pre-main-sequence stage. The plot of extinction versus distance shows a steep rise of up to 1.6 mag at 700–800 pc, which is probably related to dust clouds at the edge of the Great Cygnus Rift. The next increase in extinction by an additional 0.8 mag at 1.7 kpc is probably related to the associations Cyg OB1 and Cyg OB3. The cluster IC 4996 does not belong to the Cyg OB1 association, which is located closer to the Sun, at 1682 116 pc. It seems likely that the cluster and the surrounding O-B stars have a common origin with the nearby association Cyg OB3 since Gaia data show that these stellar groups are located at a similar distance.
Key Words.:
stars: fundamental parameters, classification – open clusters and associations: individual: IC 4996, Cyg OB1, Cyg OB31 Introduction
The new astrometric data obtained by the Gaia mission (Gaia Collaboration et al. 2016) enable verifying the reality of large systems of massive stars that are known as OB associations. Many of them contain young open clusters, and their relation to the surrounding associations is an important clue for understanding their common evolution. One such system is the Cyg OB1 association, which is considered to contain the young clusters M29 (NGC 6913), IC 4996, Berkeley 86, and Berkeley 87; see the recent review by Reipurth & Schneider (2008). According to Humphreys (1978); Humphreys & McElroy (1984); Blaha & Humphreys (1989); Garmany & Stencel (1992) and Melnik & Dambis (2017), the Cyg OB1 association contains about 70–75 OB stars and M supergiants of magnitudes 7–11, scattered in the 4.5 4.5 area.
However, according to the analysis of Cantat-Gaudin et al. (2018) (hereafter CG18) of the open cluster population based on Gaia DR2 astrometry, the distances to the four clusters located within the Cyg OB1 area do not coincide, even when their error bars are taken into account. While the distances to M29, Berkeley 86, and Berkeley 87 are sufficiently close (1719 pc, 1703 pc, and 1661 pc), the distance to IC 4996 is 1937 pc, and it exceeds the average distance to the three other clusters by 243 pc, which is much larger than the distance uncertainties (50–100 pc). Thus, a new analysis of the members of cluster IC 4996, based on their spectral and photometric classifications and also on their location in the Hertzsprung-Russell (HR) diagram is important.
In the direction of IC 4996, the Milky Way shows a strong and variable interstellar reddening. This cluster is located only a few degrees from the Great Cygnus Rift, the concentration of dust clouds at a distance of 700–800 pc. Photometric studies of the cluster and its vicinity were conducted in the following systems: UBV (Hoag et al. 1961; Delgado et al. 1998), BV (Maciejewski & Niedzielski 2007), BVRI (Vansevičius et al. 1996), RGU (Purgathofer 1961; Becker 1963), Geneva (Nicolet 1981), Vilnius (Sūdžius & Straižys 1976; Pučinskas 1982; Vansevičius & Petrauskas 1989), uvbyH (Alfaro et al. 1985), and JHK (Bhavya et al. 2007; Kharchenko et al. 2013; Buckner & Froebrich 2016). Despite numerous photometric and spectral investigations of the cluster, its distance and age gave contradicting results. For example, its distance in various sources covers the range from 1.67 kpc to 2.40 kpc, and the ages of the cluster are given from 6 Myr to 9 Myr. These differences may be related to differing sets of accepted cluster members, uncertainties in spectral and photometric classifications of stars, variable interstellar reddening, unresolved duplicity of cluster stars and their contamination by field stars. Although Delgado et al. (1998, 1999), Zwintz & Weiss (2006), and Bhavya et al. (2007) identified a few stars that were suspected to be pre-main-sequence objects of spectral classes A and F, the presence of the whole sequence of A-F-G stars remains unconfirmed.
To classify individual stars in temperatures and gravities (or into spectral and luminosity classes), either spectroscopy or photometry in the Vilnius seven-color system with mean wavelengths at 345 (), 374 (), 405 (), 466 (), 516 (), 544 (), and 656 () nm can be applied (Straižys 1992). This system gives a two-dimensional classification of stars of all spectral types (from O to M) in the presence of variable interstellar reddening. In some temperature ranges, the system can also give indications of metallicity, binarity, or peculiarity.
In this article, we attempt to determine the parameters of IC 4996 with new spectroscopic MK types of the brightest stars and two-dimensional photometric spectral types of fainter stars based on their CCD photometry in the Vilnius system and individual dereddening. To identify cluster members in the 13 13 area, we apply their data from the Gaia Data Release 2 (hereafter Gaia DR2): proper motions from Gaia Collaboration et al. (2018) and distances from Bailer-Jones et al. (2018). To determine the cluster membership, we used the Gaussian mixture model (GMM) program111https://github.com/jobovy/extreme-deconvolution by Bovy et al. (2009). We also investigate interstellar extinction in the foreground and background of the cluster. The age of the cluster is estimated using the effective temperatures and bolometric luminosities determined from photometry and spectral types, and a set of the Padova isochrones. We also estimate the relation between the cluster IC 4996 and the associations Cyg OB1 and Cyg OB3.
2 Photometric data and spectral types
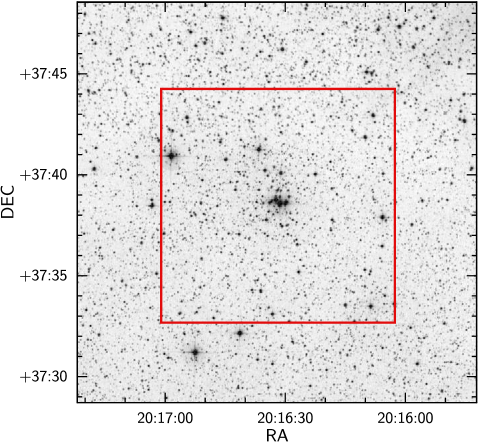
The investigated 13 13 area (Figure 1) is centered on the cluster IC 4996 at RA (J2000) = 20:16:30, DEC (J2000) = +37:38. CCD exposures with the filters of the Vilnius system were obtained in 2011–2013 with the 1.8 m Vatican Advanced Technology Telescope (VATT) on Mt. Graham, Arizona, using the STA0500A CCD camera with a 4k 4k chip containing pixel sizes of 15 15 m. In each filter, about 20 exposures of different duration were obtained. The CCD frames were processed with the IRAF program package in the aperture mode. First, all measurements in each filter were transformed into one instrumental system, taking into account the different air mass of every exposure and averaging the data. Next, the instrumental magnitudes and color indices , , , , , and were formed and transformed into , , , , , , and of the standard system.
Equations for the transformation of magnitudes and six color indices from the instrumental to the standard system were obtained using photoelectric observations of 20 stars from Vansevičius & Petrauskas (1989) and 12 stars observed by one of the authors (A.K., unpublished) at the Maidanak Observatory in 1978, all located in the CCD field. The magnitudes and color indices of seven stars in common to both lists were averaged, and a set of 24 standards was composed (after excluding the variable V1922 Cyg). Because the response curves of the instrumental and the standard systems are quite similar, the linear color equations were sufficient. Only the zero-points and small color terms were considered. No deviations depending on the luminosity and interstellar reddening were detected. Transformation errors are about 0.02 mag.
Table 1 contains the results of photoelectric photometry of 76 stars located within 25 from the cluster center. The following data are given: star number, equatorial coordinates J2000, magnitude , color indices –, –, –, –, –, and –, photometric spectral types in the MK system and the indication of duplicity within 6. The numbers of stars in Table 1 are marked with the initials AK to avoid misidentifications with Table 2. Photometric spectral types are given in lower-case letters to distinguish them from the spectroscopic classes.
| No. | RA (J2000) | DEC (J2000) | – | – | – | – | – | – | Photom. | Bin. | |
|---|---|---|---|---|---|---|---|---|---|---|---|
| h m s | mag | mag | mag | mag | mag | mag | mag | sp. type | |||
| AK1 | 20:15:07.46 | +37:38:26.7 | 10.025 | 1.846 | 1.298 | 0.522 | 0.199 | 0.067 | 0.131 | a0.5 IV | |
| AK2 | 20:15:09.02 | +37:33:05.2 | 11.508 | 2.242 | 1.714 | 1.140 | 0.467 | 0.174 | 0.470 | f6 IV | |
| AK3 | 20:15:17.57 | +37:31:43.9 | 12.167 | 2.333 | 1.823 | 1.259 | 0.547 | 0.238 | 0.490 | f6 V | |
| AK4 | 20:15:21.34 | +37:35:53.1 | 9.583 | 1.856 | 1.260 | 0.500 | 0.195 | 0.062 | 0.135 | b8.5 V | |
| AK5 | 20:15:23.33 | +37:33:30.7 | 9.947 | 2.232 | 1.509 | 0.646 | 0.260 | 0.089 | 0.217 | a1.5 III |
| No. | RA (J2000) | DEC (J2000) | – | – | – | – | – | – | Photom. | Bin. | |
|---|---|---|---|---|---|---|---|---|---|---|---|
| h m s | mag | mag | mag | mag | mag | mag | mag | sp. type | |||
| 601 | 20:16:31.21 | +37:40:02.3 | 10.498 | 1.573 | 1.210 | 0.902 | 0.488 | 0.190 | 0.423 | b1 III-IV | |
| 602 | 20:16:31.30 | +37:37:29.7 | 14.100 | 2.894 | 2.147 | 1.257 | 0.656 | 0.250 | 0.518 | b8 V | ** |
| 603 | 20:16:31.33 | +37:33:08.5 | 16.974 | 3.471 | 2.846 | 1.988 | 0.951 | 0.332 | 0.875 | f8 III | |
| 604 | 20:16:31.38 | +37:44:37.7 | 17.591 | 3.689 | 2.944 | 1.931 | 0.962 | 0.360 | f0 V | ** | |
| 605 | 20:16:31.42 | +37:38:51.1 | 12.694 | 2.237 | 1.718 | 1.078 | 0.561 | 0.213 | 0.483 | b5 IV-V |
The catalog with the results of CCD photometry for 1337 stars down to 18.8 mag and the results of photometric classification for about 70% of them are given in Table 2, which is available online at the CDS. The uncertainties of magnitudes and all color indices, which take into account the measurement errors and the errors of transformation to the standard system, are 0.03 mag down to = 18 mag. If the uncertainty is larger than 0.05 mag, color index is not given. The visual binaries with asymmetric images or components within 2.5 are marked with two asterisks in the last column. No photometric classification is given for them.
For the two-dimensional classification of stars, two codes, COMPAR and NORMA, were applied. The COMPAR code, described in our previous publications (e.g., Straižys et al. (2013)), matches 14 different interstellar reddening-free -parameters of a program star to those of about 8000 standard stars of various spectral and luminosity classes, metallicities, and peculiarities. The NORMA code has recently been developed by one of the authors (K.Z.). It uses a set of 808 standards formed from the intrinsic color indices of the Vilnius system for different spectral and luminosity classes. More details are given in Straižys et al. (2018).
The classification accuracy has recently been described by Straižys et al. (2018). Briefly, the accuracy of spectral class is on the order of 1–2 decimal subclasses. The accuracy of the luminosities for B8-A-F-G5 stars of luminosity classes V-IV-III is about one luminosity class. For K-type stars, the accuracy is about 0.5 of a spectral subclass and 0.5 of a luminosity class. To classify K- and M-type stars, the ultraviolet – and – color indices are not essential because the photometric temperature and luminosity criteria are sufficiently strong in the passbands from to . Because the classification accuracy for the stars of mag is somewhat lower, no luminosity classes are given for them in most cases (except for K-type stars).
To verify the results of photometric classification, 20 stars of spectral classes B and A, brighter than = 12.1 mag, were observed spectroscopically with the 1.22 m telescope at the Asiago Observatory. These stars are located up to 18 from the cluster center. The spectra cover a wavelength range of 350–680 nm and have a dispersion of 2.31 Å in pixel. The stars were classified by fitting them to the library of MK standards taken with the same instrumental configuration, as well as with the MKCLASS computer program by Gray & Corbally (2014). Table 3 gives their MK types determined from the Asiago spectra, photometric spectral types, and the types collected from the literature and given in the SIMBAD database. The agreement between spectroscopic and photometric spectral classes is within 1–2 decimal subclasses and one luminosity class. Stars 174, 573, 661, and 1140 are Washington Double Star Catalog (WDS) visual binaries (Worley & Douglass 1997), so their classifications by these two methods are less reliable.
| No. | Sp | Sp | Sp | |
|---|---|---|---|---|
| mag | Asiago | photom. | other | |
| AK1 | 10.025 | B9 V | a0 V | B9 V |
| AK5 | 9.947 | A2 IV | a2 IV-V | B9.5 V |
| 46 | 10.887 | A5 IV | a5 V | – |
| 163 | 10.185 | B1 IV | b1 | OBe, B2 II: |
| 174* | 11.310 | B3 III | b3 IV-V: | OB |
| 553 | 12.015 | B1 IVe | b3: | B3 |
| AK36* | 9.268 | B1 III | b1 IV | B0.5 V: |
| 573* | 9.765 | B1 III | b1 III | B1 III, B1 IV |
| AK37 | 10.005 | B1 IV | b2 IV | B0.5 V |
| 601 | 10.498 | B1 IV | b1 IV | B3 |
| HD 193007* | 7.974 | B0 II | – | B0.5 II, B0 III |
| BD+37 3862 | 8.982 | B1 IIIe | – | B0 V, B0 IVp |
| 661* | 11.800 | B3 III | b3 IV: | – |
| 668 | 11.341 | B3 III | b2 IV | – |
| 735 | 9.488 | B1 Ib | b1 III | OB |
| AK46 | 7.776 | A9 III | a9 IV | A9 III |
| AK47 | 8.756 | A3 IV | a3 IV | A3 |
| 910 | 10.863 | B8 III | b8 IV | B5 |
| 1140* | 11.388 | B7 II | b8 | B5 |
| 1266 | 12.086 | A0 III | a1 IV | – |
3 Interstellar extinctions and distances
In the COMPAR code, color excesses of stars are calculated by the equation
| (1) |
where are the intrinsic colors taken from Straižys (1992). In the NORMA code, color excesses of stars for all six color indices, given in Tables 1 and 2, are calculated:
| (2) |
where and are the observed and intrinsic color indices, respectively. Then , , , and are transformed into and all the six values are averaged. If the ultraviolet color indices – and – are not available, then only four values of color excess are averaged. The values are transformed into the extinctions by the equation
| (3) |
where the coefficient 3.86 was determined from the ratios , , and for B- and A-type stars, as described in Straižys et al. (2014). In the IC 4996 area, this is very close to the coefficient obtained for the direction to the cluster M29. Both are slightly lower than the normal value, 4.16, which corresponds to 3.15 in the B,V system. This normal value of the coefficient would give values of that are higher by a factor of 1.08. The typical uncertainty of is 0.10 mag because of the observational errors of – and the errors of the intrinsic colors. The extinction error mostly depends on the errors of spectral classes, while the error of the luminosity class is much less important.
Distances to the stars were taken from the catalog of Bailer-Jones et al. (2018), where they have been calculated from the Gaia DR2 parallaxes inverted to distances, taking the nonlinearity of the transformation and the asymmetry of the resulting probability distribution into account.
4 Cluster membership, distance, and age
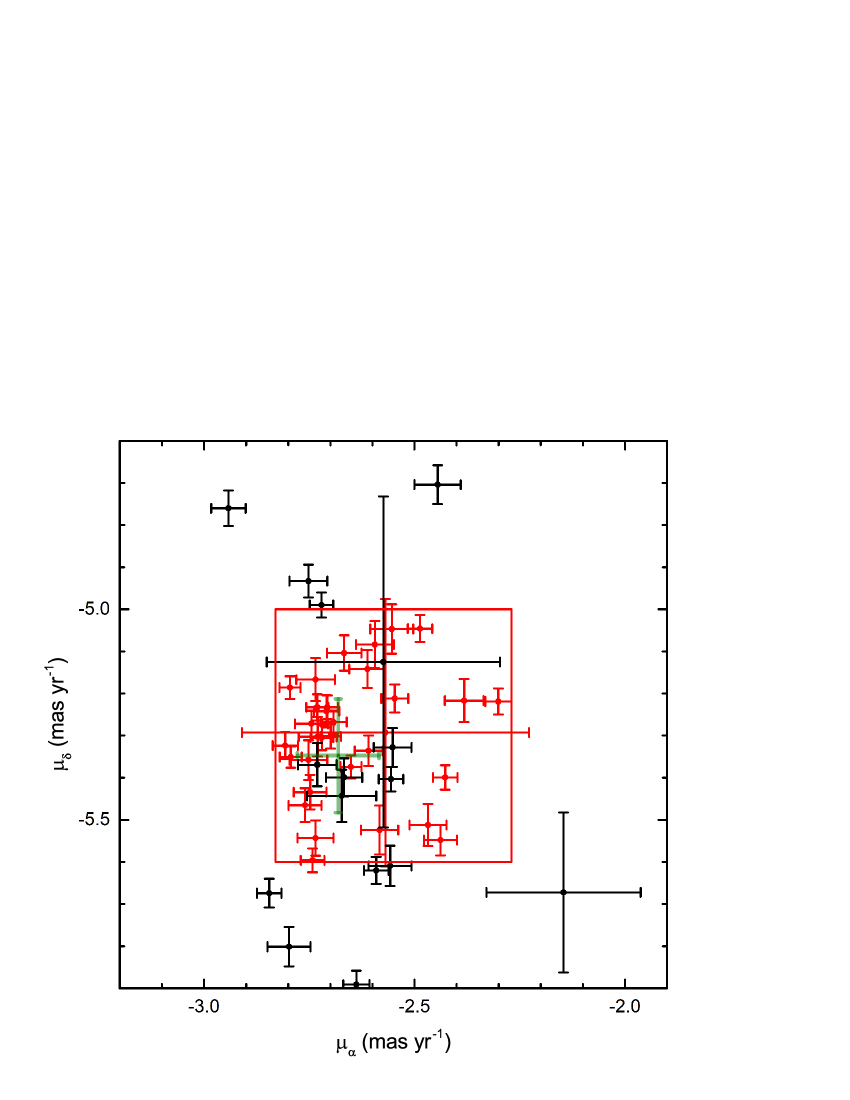
To select possible members of IC 4996, we applied Gaia DR2 proper motion components from Gaia Collaboration et al. (2018) and distances from Bailer-Jones et al. (2018). From Tables 1 and 2, we first selected all B-type stars down to = 16 mag that are located in the 13 13 area centered on the cluster. These stars were plotted in the vector point diagram (VPD) versus ; here contains a factor of cos . Four bright stars, HD 228657, HD 193007, HD 193076, and BD+37 3862, measured earlier in the Vilnius system by Vansevičius & Petrauskas (1989), were also added. These 64 stars in the VPD cover quite a large area from +2 to –5 mas yr-1 in and from –2 to –8 mas yr-1 in . About 50% of these stars are concentrated in the rectangle limited by the coordinates from –2.3 to –2.8 mas yr-1 in and from –5.0 to –5.6 mas yr-1 in , which is shown in red in Figure 2. The histogram of distances to the stars that are located in the red rectangle shows that 32 of them are concentrated in the 1.70–2.15 kpc distance range, with the maximum number of stars at a distance of 1.9 kpc. We accept that these 32 B-type stars are the cluster members; their distance range covers about 2 of the distance errors. In Figure 2 these stars are shown as red dots with their error crosses. The black dots are field B-stars of the foreground and background. More field stars are located outside the red rectangle and outside the diagram.
The red rectangle in Figure 2, defined by B-type stars, was used to select cluster members with lower temperature. By applying the Gaia distances and proper motions, we identified within the 13 13 area 40 stars from A0 to K2 as possible cluster members (Table 4). To verify the reliability of our selection, we used the GMM program from Bovy et al. (2009). We performed clustering in the 13 13 area using three parameters (parallax and proper motions) for each star. The GMM can select a local instead of a global minimum, therefore at least 100 runs were made using random initial values of the GMM parameters. As the cluster membership probability , we used the hyperparameter introduced by Bovy et al. (2009) (their Eq. (16)). This probability is given in the last column of Table 4. The GMM procedure allowed us to specify the center of cluster members in the VPD: = –2.643 0.145 mas yr-1 and = –5.311 0.171 mas yr-1. This center is quite close to the center of the red rectangle in Figure 2. All cluster members in the rectangle have membership probabilities 0.7. In the list of 1337 stars from Table 2, the GMM program also identified 53 additional stars with a membership probability 0.7, but these stars are either fainter than = 16 mag or do not have reliable spectral classifications. The final list of selected 72 cluster members is given in Table 4. This list contains 8 stars that were listed as possible pre-main-sequence objects by Delgado et al. (1999).
Using the Gaia DR2 proper motions and parallaxes, CG18 estimated membership probabilities and distances for 1229 clusters, including IC 4996. In this cluster, they identified 79 stars within a 7 7 area down to = 18 mag with membership probabilities 0.5. The distance to the cluster based on the Gaia parallaxes was found to be 1937 pc. The following average proper motion value of the cluster was found: = –2.681 0.097 mas yr-1 and = –5.348 0.135 mas yr-1. In Figure 2 it is shown as a green dot and the error cross. This result was based on all member stars, regardless of their spectral classes or temperatures. Comparing our list with the list of 79 possible members of CG18, we found 50 stars in common with membership probabilities 0.5. Other members of CG18 are too faint to be included in Table 4 or are binaries and do not have reliable spectral types. In our list of 72 possible members, 5 stars in CG18 have lower membership probabilities, and 17 stars lie outside the 7 7 area of CG18.
| No. | RA(J2000) | DEC(J2000) | Sp. type | log | log | (pc) | ||||||||||
|---|---|---|---|---|---|---|---|---|---|---|---|---|---|---|---|---|
| 34 | 20:16:02.16 | +37:41:30.1 | 15.929 | a7 V | 2.34 | 0.27 | 13.59 | +0.02 | 3.903 | 1.004 | -2.713 | 0.057 | -5.625 | 0.066 | 1811 | 0.90 |
| 136 | 20:16:07.40 | +37:42:34.6 | 14.442 | a0 V | 1.84 | 0.17 | 12.60 | –0.25 | 3.982 | 1.508 | -2.472 | 0.032 | -5.226 | 0.033 | 1919 | 0.97 |
| 162 | 20:16:08.55 | +37:35:08.2 | 13.662 | b8 V | 2.20 | 0.11 | 11.46 | –0.80 | 4.107 | 2.184 | -2.796 | 0.025 | -5.186 | 0.027 | 1843 | 0.96 |
| 203 | 20:16:10.93 | +37:34:53.1 | 14.948 | a0 V | 2.27 | 0.18 | 12.68 | –0.20 | 3.978 | 1.456 | -2.540 | 0.036 | -5.469 | 0.037 | 2042 | 0.96 |
| 289 | 20:16:15.44 | +37:40:15.4 | 15.135 | a3 V | 1.78 | 0.22 | 13.36 | –0.03 | 3.949 | 1.116 | -2.750 | 0.044 | -5.411 | 0.046 | 2058 | 0.96 |
| No. | RA(J2000) | DEC(J2000) | Sp. type | (pc) | |||||
|---|---|---|---|---|---|---|---|---|---|
| HD 192079 | 20:11:44.99 | +37:32:59.9 | 8.77 | B2 III | -2.751 | 0.055 | -5.706 | 0.055 | 1672.2 |
| HD 228456 | 20:14:02.31 | +36:48:07.0 | 9.86 | B2 IV | -2.728 | 0.078 | -5.680 | 0.087 | 1693.9 |
| HD 228461 | 20:14:06.42 | +38:14:38.3 | 9.47 | B2 II | -2.563 | 0.040 | -5.126 | 0.042 | 1691.2 |
| HD 228533 | 20:14:48.75 | +38:27:14.6 | 9.08 | B0 III | -2.718 | 0.053 | -4.992 | 0.048 | 1792.4 |
| HD 228543 | 20:14:56.62 | +38:08:18.3 | 8.76 | B2 II | -3.520 | 0.053 | -5.572 | 0.059 | 1646.3 |
Two-dimensional spectral types for the selected cluster members in Table 4 are taken either from Table 2 (photometric classification) or from Table 3 and the literature (spectroscopic classification). The agreement between spectral classes from different sources is satisfactory, the differences are mostly within one decimal subclass. However, differences in luminosity classes are more significant, and this required an individual study of each star. We suspect that in some cases the classification differences might be caused by the presence of close optical neighbor stars, in other cases, the stars may be physical binaries. It may be useful to recall that the majority of O- and B-type stars in clusters are found to be binaries; see the review by Duchene (2013). Some B-stars can be misclassified in luminosity because of their fast axial rotation and resulting deformation. For the stars of spectral class G, the classification is uncertain because they are in the pre-main-sequence stage (probably post-T Tauri stars) and can possess a somewhat peculiar spectral energy distribution.
The mean parallax of the cluster, 0.522 0.031 mas, was obtained by applying the maximum likelihood procedure (Eq. (1) of CG18) to 30 cluster members of spectral classes B0–B9 selected from Table 4. The zero-point correction of 0.029 (Lindegren et al. 2018) to the Gaia DR2 parallaxes was added. The bright star HD 193007 with the largest parallax uncertainty was excluded. The corresponding distance of the cluster is pc. By applying the same equation for 71 cluster members (HD 193007 excluded), we obtain almost the same parallax value, 0.523 0.031 mas. The corresponding distance modulus of the cluster is – = 11.41 mag.
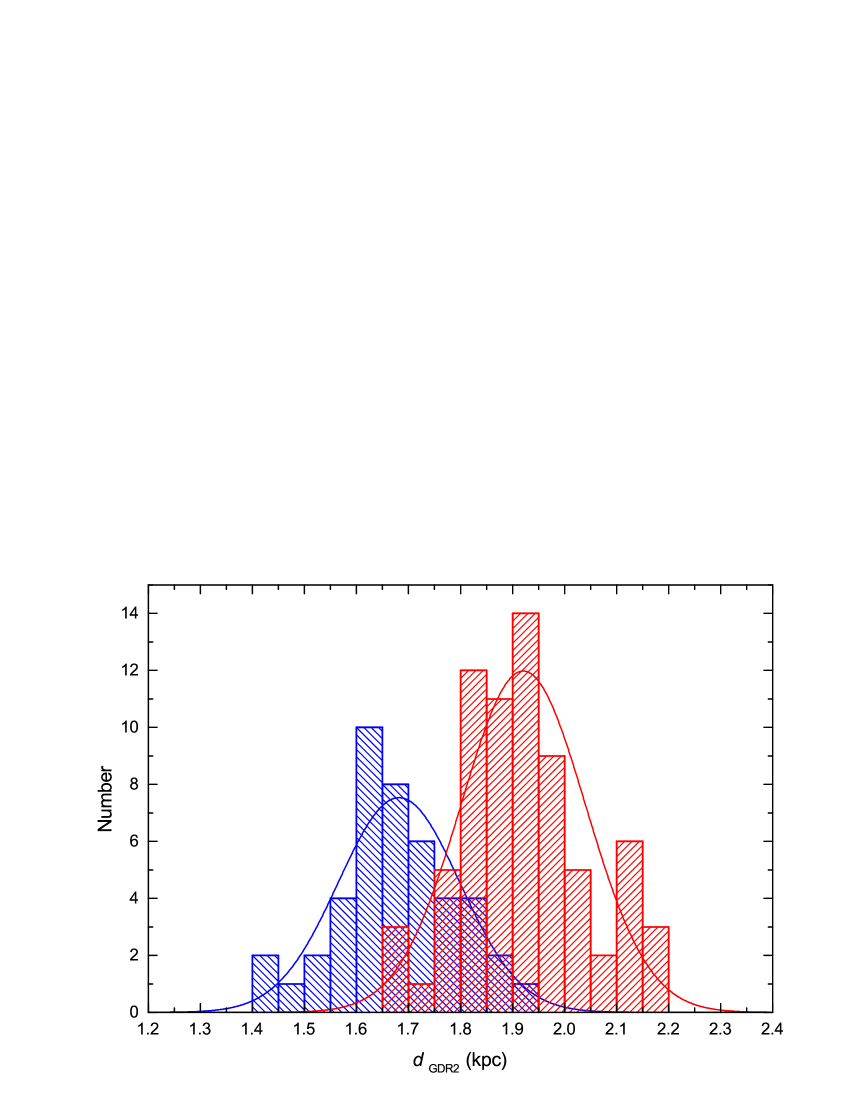
The histogram for the initially selected 72 cluster members with the distances from Bailer-Jones et al. (2018) is shown as red columns in Figure 3. The Gaussian curve gives a distance of 1917 pc with an uncertainty = 123 pc, which means that the result is very similar to that obtained from the mean parallax of B-type stars.
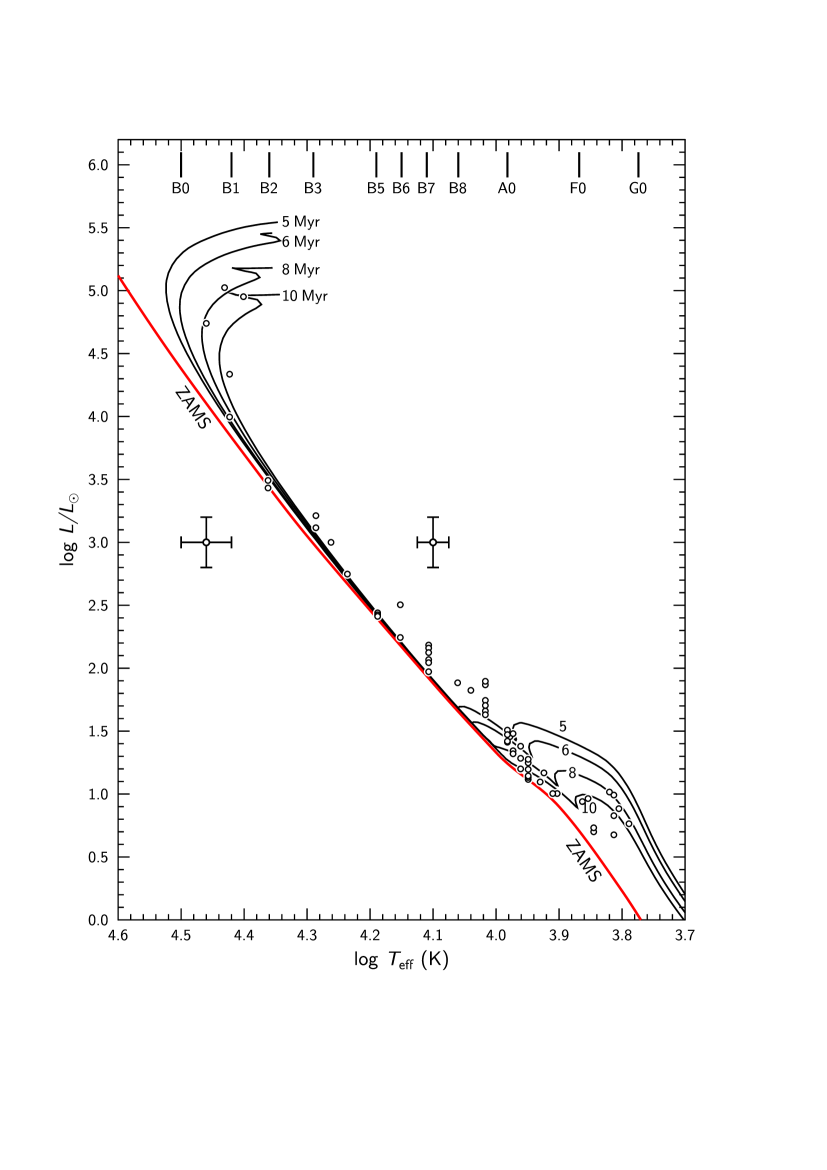
Figure 4 shows the physical diagram log vs. log for the cluster members of spectral classes B-A-F from Table 4. The isochrones for ages of 5, 6, 8, and 10 Myr are taken from the Padova database of stellar evolutionary tracks and isochrones for solar metallicity (Girardi et al. 2002; Bressan et al. 2012). The ZAMS line was drawn through the unevolved portions of the isochrones corresponding to 1, 50, and 100 Myr. Luminosities of stars in solar units were calculated with the equation
where is the intrinsic magnitude of the star, is the absolute bolometric magnitude of the Sun, is the absolute bolometric magnitude of the star, is its bolometric correction, and is the true distance modulus of the cluster (11.41 mag). The effective temperatures and bolometric corrections of stars were taken according to their spectral types from Appendix 3 of Straižys (1992). This scale is similar to the scales given by Flower (1996), Bessel et al. (1998), and Torres (2010). For G-type pre-main-sequence members, no values of the physical parameters are given because their spectral classes are of low accuracy.
In Figure 4, the four most massive members of IC 4996 (HD 193007, B0 II; HD 193076, B0.5 II, BD+37 3862, B0.5 IV, and BD+37 3859, B1 III = No. 573 in Table 2) fit the 8–10 Myr isochrones well. A few B3–B9 stars lie slightly above the ZAMS; their luminosity classes are between V and IV, and some of them are suspected binaries. However, in most cases, their deviations from isochrones are within the 2 error crosses, as shown in Figure 4. The isochrones show that the deviation of cluster stars from the ZAMS starts at spectral class B9.
5 Relation of IC 4996 to the Cyg OB1 and Cyg OB3 associations
In most earlier investigations and reviews, the cluster IC 4996 has been considered as a member of the Cyg OB1 association. Now we have the possibility to verify the proposed relationship of the cluster and the association using astrometric data from the Gaia DR2 catalogs. With this aim, we applied the distance histogram to individual stars of Cyg OB1 taken from Bailer-Jones et al. (2018). The plot of the distance histogram for 68 stars of the Cyg OB1 association from Humphreys & McElroy (1984) with the reliable parallaxes shows that they are scattered between 0.9 and 3.3 kpc, which means that many stars of the suggested members are probably foreground and background stars. Only 44 stars are concentrated in the distance range between 1.4 and 1.9 kpc, with a sharp maximum at 1.6–1.7 kpc. In the VPD of proper motions, most stars of the Cyg OB1 association are concentrated in the area containing members of the clusters M29, Berkeley 86, Berkeley 87, and IC 4996. Nine stars of the histogram peak between 1.4 and 1.9 kpc in the VPD deviate from the area that contains stars of the clusters listed above. Proper motions and radial velocities of stars in associations usually show much larger dispersion than in open clusters. We therefore did not reject these nine stars from the list of the accepted association members, which is provided in Table 5, and their histogram is plotted with the blue columns in Figure 3. The maximum of the Gaussian curve gives for them = 1682 pc with = 116 pc. At this distance, the diameter of Cyg OB1 is 100 pc. Thus, the cluster IC 4996 is too distant to be considered a member of the Cyg OB1 complex. Its radial distance from the center of Cyg OB1 is larger by a factor of 4.6 than the radius of the association.
Nine stars of the Humphreys & McElroy (1984) list of the supposed Cyg OB1 members are concentrated in the distance range 1.95–2.14 kpc, that is, they are more distant than most of the other stars. In the sky plane these stars are located southwest from IC 4996, close to the Cyg OB3 association border. According to our analysis, most of the Cyg OB3 members in the Gaia distance histogram show a peak at 1.8–2.0 kpc, which almost coincides with the distance of IC 4996. Thus, these nine stars from the Cyg OB1 list, together with the cluster IC 4996, may be members of Cyg OB3, not of Cyg OB1. This agrees with the results of a recent analysis of the kinematic structure of Cyg OB1 by Costado et al. (2017) based on radial velocity data. The authors found that the cluster IC 4996, together with the surrounding stars of the Cyg OB1 association, form a separate space system at larger distance than the stars located in the northwest part of Cyg OB1 in the vicinity of the cluster M29 and close to the association Cyg OB9.
6 Interstellar extinction in the cluster area
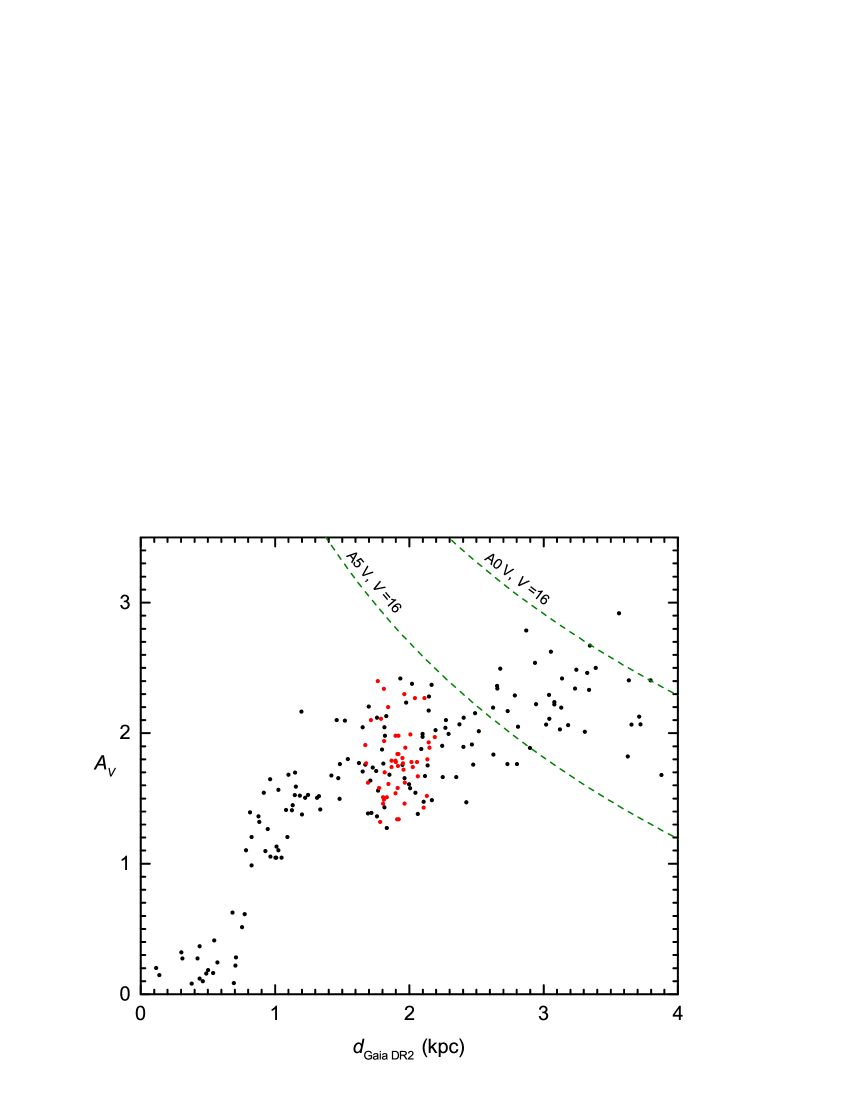
The plot of the extinction versus Gaia distance up to = 4.0 kpc is shown in Figure 5. We plotted only the stars brighter than = 16 mag because for the fainter stars the extinction and distance errors are much larger. As described in Section 3, distances to the stars were taken from Bailer-Jones et al. (2018), where they were determined from the Gaia DR2 parallaxes. For most of the stars, the uncertainties in the negative direction are 50–100 pc at = 2 kpc and 75–150 pc at = 3 kpc. In the positive direction, the uncertainties are larger by a factor of 1.15.
At a distance of 700–800 pc, the extinction steeply increases to a value of 1.6 mag. Most probably, this jump in extinction is related to the cloud system of the Great Cygnus Rift. A similar jump has been found in our earlier papers (Straižys et al. 2014, 2015) in the direction of the nearby cluster M29. The next increase in extinction is observed at 1.7 kpc. This dust layer is probably related to the nearby associations Cyg OB1 and Cyg OB3. Figure 5 shows the IC 4996 members of spectral classes B and A as red dots. Cooler members of the cluster are not plotted since they are still in the pre-main-sequence stage of evolution, their spectral energy distributions can be somewhat peculiar, and the extinction values based on the intrinsic colors can be uncertain.
It is evident that the cluster members cover a broad range of extinction values, from 1.3 to 2.4 mag. Most probably, this extinction variability appears in the foreground of the cluster because there are no signs that the cluster contains a significant amount of interstellar dust, which probably was evaporated and moved away after the formation of high-mass cluster members. The extinction values are highest (between 2.0 and 2.4 mag) in the western and southern parts of the investigated area, and the lowest extinction ( 1.3 mag) is seen in the eastern direction from the cluster center.
In the cluster background, the maximum extinction values are cut by the limiting magnitudes of the stars. In Figure 5, the limiting magnitude = 16.0 curves for spectral types A0 V and A5 V are shown. To verify the extinction run at larger distances, the stars to fainter limiting magnitudes should be plotted. Our plot of versus distance for the stars down to = 18 mag up to = 7 kpc (not shown here) shows extinction between 1.5 and 3.0 mag, only a few stars are seen up to 4 mag. However, they are of little use for estimating the mean extinction at different distances because the accuracy of photometric and Gaia distances at 5–7 kpc is relatively low.
7 Conclusions
We have presented photometry in the Vilnius seven-color system for 1337 stars down to = 18.8 mag in the area of the open cluster IC 4996. For 710 stars with the most reliable two-dimensional classification, the interstellar extinctions were calculated. We identified 72 possible cluster members by applying their proper motions from the Gaia DR2 catalog and the distances based on the Gaia parallaxes from Bailer-Jones et al. (2018). For the brightest stars, spectroscopic MK types were also obtained from the Asiago spectra or are available in the literature. We confirm the cluster sequence from early B- to G-type stars, where the stars of spectral classes A, F, and G are still in the pre-main-sequence stage of evolution.
New cluster parameters were derived. The mean parallax of the cluster (0.522 mas) was obtained by applying the maximum likelihood procedure to the Gaia DR2 parallaxes of its 30 B-type members and adding a systematic error of 0.029 mas. The resulting parallax corresponds to a distance of 1915 pc (with 110 pc) and to a true distance modulus of 11.41 mag. Our distance is similar to the distance obtained by Cantat-Gaudin et al. (2018) for a smaller area and for a partly different set of the cluster members. IC 4996 is probably not a member of the Cyg OB1 association, which according to the Gaia DR2 parallaxes, is located at 1682 pc. More likely, IC 4996 has a common origin with the association Cyg OB3, which we find to be located at 1.8–2.0 kpc, that is, very close to the cluster. All this means that in the post-Gaia era, boundaries of the associations should be revised taking into account the radial distances of O–B stars of higher accuracy. The age of the cluster IC 4996, 8–10 Myr, is estimated from its physical HR diagram log versus log and the Padova isochrones for the solar metallicity.
The interstellar extinction parameter in the direction of cluster members covers a wide range of values, from 1.3 to 2.4 mag. The plot of versus in the area of IC 4996 shows a steep increase in extinction of up to 1.6 mag at 700–800 pc, which is probably related to dust clouds at the edge of the Great Cygnus Rift. The increase in extinction of up to 2.4 mag at 1.7 kpc may be related to the Cyg OB1 and Cyg OB3 associations.
This study is an example of how a two-dimensional classification of stars based on multicolor photometry, combined with the Gaia astrometric data, can be applied for obtaining physical parameters of open clusters. For the further improvement of the accuracy of cluster parameters, a better recognition of unresolved binaries and peculiar stars is desirable. For B-type stars, it is important to take the effects of axial rotation into account. The measurements and analysis of radial velocities and profiles of spectral lines for early-type stars would be helpful in detecting binarity and rotation.
Acknowledgments. This work has made use of data from the European Space Agency (ESA) mission Gaia (https://www.cosmos.esa.int/gaia), processed by the Gaia Data Processing and Analysis Consortium (DPAC, https://www.cosmos.esa.int/web/gaia/dpac/consortium). Funding for the DPAC has been provided by national institutions, in particular the institutions participating in the Gaia Multilateral Agreement. The use of the Simbad (CDS), WEBDA (Masaryk University) and SkyView (NASA) databases is also acknowledged. Preliminary results of this investigation were presented at the AAS Meeting No. 231 (Boyle et al. 2018). We are grateful to Carme Jordi and Tristan Cantat-Gaudin for submitting their results before publication and for important comments. The project is partly supported by the Research Council of Lithuania, grant No. S-MIP-17-74.
References
- Alfaro et al. (1985) Alfaro, E. J., Delgado, A. J., Garcia-Pelayo, J. M., et al. 1985, A&AS, 59, 441
- Bailer-Jones et al. (2018) Bailer-Jones, C., Rybizki, J., Fouesneau, M., et al. 2018, AJ, 156, 58
- Becker (1963) Becker, W. 1963, Z. f. Astrophys., 57, 117
- Bessel et al. (1998) Bessel, M. S., Castelli, F., & Plez, B. 1998, A&A, 333, 231
- Bhavya et al. (2007) Bhavya, B., Mathew, B., & Subramaniam, A. 2007, Bull. Astr. Soc. India, 35, 383
- Blaha & Humphreys (1989) Blaha, C. & Humphreys, R. M. 1989, AJ, 98, 1598
- Bovy et al. (2009) Bovy, J., Hogg, D. W., & Roweis, S. T. 2009, ApJ, 700, 1794
- Boyle et al. (2018) Boyle, R. P., Straižys, V., Munari, U., et al. 2018, AAS Meeting, 231, id. 344.05
- Bressan et al. (2012) Bressan, A., Marigo, P., Girardi, L., et al. 2012, MNRAS, 427, 127
- Buckner & Froebrich (2016) Buckner, A. & Froebrich, D. 2016, arXiv: 1611.03753
- Cantat-Gaudin et al. (2018) Cantat-Gaudin, T., Jordi, C., Vallenari, A., et al. 2018, A&A, 618, A93
- Costado et al. (2017) Costado, M. T., Alfaro, E. J., González, M., & Sampedro, L. 2017, MNRAS, 465, 3879
- Delgado et al. (1998) Delgado, A. J., Alfaro, E. J., Moitinho, A., & Franco, J. 1998, AJ, 116, 1801
- Delgado et al. (1999) Delgado, A. J., Miranda, L. F., & Alfaro, E. J. 1999, AJ, 118, 1759
- Duchene (2013) Duchene. 2013, ARA&A, 51, 269
- Flower (1996) Flower, P. J. 1996, ApJ, 469, 355
- Gaia Collaboration et al. (2018) Gaia Collaboration, Brown, A. G. A., Vallenari, A., et al. 2018, A&A, 616, A1
- Gaia Collaboration et al. (2016) Gaia Collaboration, Prusti, T., de Bruijne, J. H. J., et al. 2016, A&A, 595, A1
- Garmany & Stencel (1992) Garmany, C. D. & Stencel, R. E. 1992, A&AS, 94, 211
- Girardi et al. (2002) Girardi, L., Bertelli, G., Bressan, A., et al. 2002, A&A, 391, 195
- Gray & Corbally (2014) Gray, R. O. & Corbally, C. J. 2014, AJ, 147, 80
- Hoag et al. (1961) Hoag, A. A., Johnson, H. L., Iriarte, B., et al. 1961, Publ. Naval Obs., 17, 349
- Humphreys (1978) Humphreys, R. M. 1978, ApJS, 38, 309
- Humphreys & McElroy (1984) Humphreys, R. M. & McElroy, D. B. 1984, ApJ, 284, 565
- Kharchenko et al. (2013) Kharchenko, N. V., Piskunov, A. E., Schilbach, E., et al. 2013, A&A, 558, A53
- Lindegren et al. (2018) Lindegren, L., Hernandez, J., Bombrun, A., et al. 2018, A&A, 616, A2
- Maciejewski & Niedzielski (2007) Maciejewski, G. & Niedzielski, A. 2007, A&A, 467, 1065
- Melnik & Dambis (2017) Melnik, A. M. & Dambis, A. K. 2017, MNRAS, 472, 3887
- Nicolet (1981) Nicolet, B. 1981, A&A, 104, 185
- Purgathofer (1961) Purgathofer, A. 1961, Z. f. Astrophys., 52, 22
- Pučinskas (1982) Pučinskas, A. 1982, Bull. Vilnius Obs., 59, 3
- Reipurth & Schneider (2008) Reipurth, B. & Schneider, N. 2008, Handbook of Star Forming Regions, Vol. I (Astronomical Society of the Pacific, ed. B. Reipurth), 36
-
Straižys (1992)
Straižys, V. 1992, Multicolor Stellar Photometry (Tucson, Arizona: Pachart
Publishing House), available in pdf format from
http://www.itpa.lt/MulticolorStellarPhotometry/ - Straižys et al. (2013) Straižys, V., Boyle, R. P., Janusz, R., et al. 2013, A&A, 554, A3
- Straižys et al. (2018) Straižys, V., Boyle, R. P., Zdanavičius, J., et al. 2018, A&A, 611, A9
- Straižys et al. (2014) Straižys, V., Milašius, K., Boyle, R. P., et al. 2014, AJ, 148, 89
- Straižys et al. (2015) Straižys, V., Vrba, F. J., Boyle, R. P., et al. 2015, AJ, 149, 161
- Sūdžius & Straižys (1976) Sūdžius, J. & Straižys, V. 1976, Bull. Vilnius Obs., 43, 3
- Torres (2010) Torres, G. 2010, AJ, 140, 1158
- Vansevičius et al. (1996) Vansevičius, V., Bridžius, A., Pučinskas, A., & Sasaki, T. 1996, Baltic Astron., 5, 539
- Vansevičius & Petrauskas (1989) Vansevičius, V. & Petrauskas, J. 1989, Bull. Vilnius Obs., 84, 40
- Worley & Douglass (1997) Worley, C. E. & Douglass, G. G. 1997, A&AS, 125, 523
- Zwintz & Weiss (2006) Zwintz, K. & Weiss, W. W. 2006, A&A, 457, 237