Atomistic modeling of heat treatment processes for tuning the mechanical properties of disordered solids
Abstract
We investigate the effect of a single heat treatment cycle on the potential energy states and mechanical properties of metallic glasses using molecular dynamics simulations. We consider the three-dimensional binary mixture, which was initially cooled with a computationally slow rate from the liquid state to the solid phase at a temperature well below the glass transition. It was found that a cycle of heating and cooling can relocate the glass to either rejuvenated or relaxed states, depending on the maximum temperature and the loading period. Thus, the lowest potential energy is attained after a cycle with the maximum temperature slightly below the glass transition temperature and the effective cooling rate slower than the initial annealing rate. In contrast, the degree of rejuvenation increases when the maximum temperature becomes greater than the glass transition temperature and the loading period is sufficiently small. It was further shown that the variation of the potential energy is inversely related to the dependence of the elastic modulus and the yield stress as functions of the maximum loading temperature. In addition, the heat treatment process causes subtle changes in the shape of the radial distribution function of small atoms. These results are important for optimization of thermal and mechanical processing of metallic glasses with predetermined properties.
Keywords: glasses, deformation, thermal treatment, yield stress, molecular dynamics simulations
I Introduction
The development of novel fabrication techniques for amorphous materials, including metallic glasses and high entropy alloys, is important for various industrial and biomedical applications LiAFM18 ; Branicio18 . The processing routes often involve mechanical and thermal treatments of disordered alloys that lead to changes in microstructure as well as mechanical and physical properties Greer16 . It is well realized by now that metallic glasses relax to lower energy states during the aging process and become more brittle, while rejuvenation and improved plasticity can be achieved using a number of experimental techniques, such as shot peening Kerscher17 , cold rolling Pelletier14 , high pressure torsion Ebner18 , ion irradiation Gianola14 , and cryogenic thermal cycling Ketov15 ; Guo18 . In turn, recent atomistic simulations have shown that periodically loaded disordered materials evolve towards lower energy states at sufficiently small strain amplitudes, whereas the yielding transition and shear localization occur at large amplitudes after a number of transient cycles Lacks04 ; Priezjev13 ; Sastry13 ; Reichhardt13 ; Priezjev14 ; Deng15 ; Priezjev16 ; Priezjev16a ; Sastry17 ; Priezjev17 ; Li17 ; Priezjev18 ; Priezjev18a ; Alava18 ; NVP18strload ; PriMakrho09 . In addition, it was found that amorphous materials subjected to multiple thermal cycles might either relax or rejuvenate depending on the thermal amplitude, number of cycles, and processing history Priez18tcyc ; Priez18T5000 ; Priez18T2000 . However, the combined effect of thermal treatment and mechanical agitation on the potential energy, structure, and mechanical properties of amorphous alloys remains difficult to predict.
In the last few years, a number of studies have investigated the aging and rejuvenation processes in amorphous materials subjected to a heat treatment cycle using molecular dynamics simulations and experimental measurements Ogata15 ; Ogata16 ; EgamiFan17 ; Ogata17 ; Barrat18 ; Maass18 ; Yang18 . Most notably, it was demonstrated that rejuvenated states can be attained by heating a sample above the glass transition temperature, followed by isothermal annealing, and then quenching with a rate higher than the initial cooling rate Ogata15 . Moreover, the application of compressive hydrostatic pressure during the quenching process was found to promote thermal rejuvenation and improve plastic performance Ogata16 ; Yang18 . More recently, it was shown that the evolution of macroscopic state in disordered materials is determined by the interplay between activation and relaxation on the potential energy landscape, which helps to explain the thermal hysteresis in cyclic thermal scanning EgamiFan17 . Using a combination of calorimetry measurements and atomistic simulations, a remarkable tenfold increase in stored energy was detected in rapidly heated (above the glass transition) and cooled metallic glasses Maass18 . Despite considerable efforts, however, the details of the heat treatment protocol, such as heating and cooling rates, pressure, annealing temperature, and its effect on the structure and properties of disordered solids remain not thoroughly explored.
In this paper, we investigate how processing conditions influence the potential energy states, structure, and mechanical properties of amorphous materials subjected to a single heat treatment cycle. We consider a well-annealed binary mixture, which is linearly heated to a maximum temperature in the neighborhood of the glass transition temperature and cooled back to the glassy state. The simulations are performed in a wide range of cycling periods and thermal amplitudes. It will be shown that thermal cycling below the glass transition relocates the system into states with lower potential energy, while rejuvenated states can be accessed at sufficiently high heating/cooling rates if the thermal amplitude is above the glass transition temperature.
The rest of the paper is organized as follows. The molecular dynamics simulation model and the thermal treatment protocol are described in the next section. The variation of the potential energy during thermal cycling and the resulted changes in the mechanical properties as well as the structural analysis are presented in section III. The brief summary is given in the last section.
II Details of molecular dynamics simulations
In the present work, we employed the binary mixture (80:20) model introduced by Kob and Andersen (KA), which is similar to the parametrization proposed by Weber and Stillinger to study the amorphous metal alloy KobAnd95 ; Weber85 . In this model, the interaction between atoms of different types, and , is strongly non-additive, thus preventing crystallization upon cooling below the glass transition temperature. Any two atoms separated by a distance interact via the Lennard-Jones (LJ) potential:
| (1) |
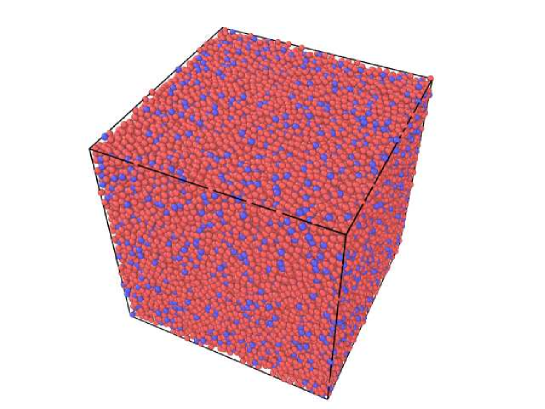
with the interaction parameters: , , , , , , and KobAnd95 . The system consists of atoms, and thus the cutoff radius of the LJ potential is set to to improve the computational efficiency. Throughout the study, the physical quantities are expressed in terms of the LJ units of length, mass, energy, and time: , , , and . The integration time step was fixed to in the LAMMPS software Lammps .
The binary mixture was first thoroughly equilibrated in the liquid state at the temperature and zero pressure. In what follows, denotes the Boltzmann constant. The temperature was regulated via the Nosé-Hoover thermostat Allen87 . The simulations were carried out in the ensemble, and the periodic boundary conditions were imposed along three dimensions Allen87 . After equilibration, the system was cooled with computationally slow rate of at zero pressure to the temperature of . Next, the glass was subjected to one cycle of heating to the maximum temperature and then cooling back to at during the time period . To avoid confusion, we denote the maximum temperature during the thermal cycle by , temperature of the system by , and the oscillation period by . During the production runs, the potential energy, temperature, system dimensions, stresses and atomic configurations were saved for post-processing and visualization. In order to examine the changes in mechanical properties, the binary glass was strained before and after the thermal cycle along the direction with the strain rate at and . The stress-strain curves were used to estimate the elastic modulus and the peak value of the stress overshoot for different values of the parameters and . The data were averaged over ten independent realizations of disorder. The MD simulations of the thermal loading process with large periods required about 2000 processors.
III Results
Upon cooling a glass-former from the liquid state to the solid phase, its structure remains amorphous but the molecular motion dramatically slows down Debenedetti01 . Moreover, with decreasing cooling rate, the glass transition temperature is reduced and the potential energy of the disordered solid becomes lower, as the system has more time to explore different configurations and find a deeper minimum Debenedetti01 . It is also well known that slowly cooled and/or aged glasses exhibit higher yield stress, followed by the formation of sharply localized shear bands Greer16 . By contrast, mechanically or thermally rejuvenated glasses can undergo a more homogeneous plastic deformation and thus they are generally less brittle Greer16 . It was recently shown that the level of rejuvenation can be controlled by applying thermal treatment, where the glass is first heated into the liquid state, annealed during a certain time interval, and then rapidly quenched to the solid phase Ogata15 .
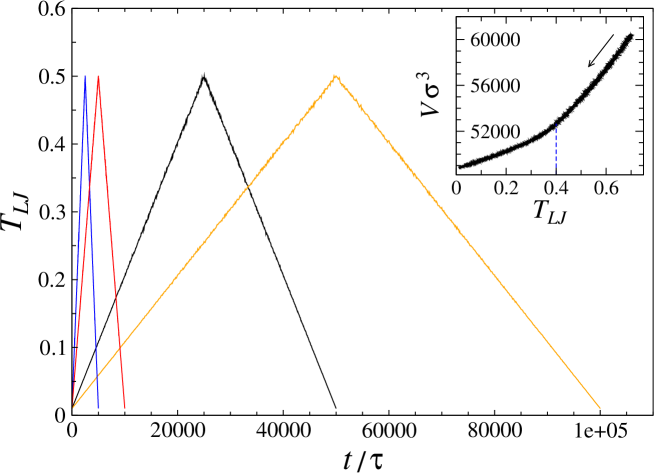
In our study, the disordered solids were initially prepared by cooling with the rate of to the temperature at zero pressure. As an example, the dependence of volume as a function of temperature for one sample is presented in the inset to Fig. 2. The intersection of linearly extrapolated low (glass phase) and high (liquid phase) temperature regions provides an estimate of the glass transition temperature of about . Correspondingly, the average glass density at this temperature is . Note that the glass transition temperature at zero pressure is lower than the mode-coupling critical temperature at the density , which was determined numerically by fitting the diffusion coefficient to the power-law function of temperature at constant volume KobAnd95 .
The examples of temperature profiles measured in MD simulations during one cycle of heating and cooling are presented in Fig. 2 for the periods , , and . Note that the effective heating and cooling rates are the same and equal to approximately . Thus, the rate varies from at to at for the smallest period , while it ranges from at to at for the largest period . In the following analysis, the change in the potential energy due to thermal cycling will be correlated with the relative difference between these rates and the initial cooling rate of .
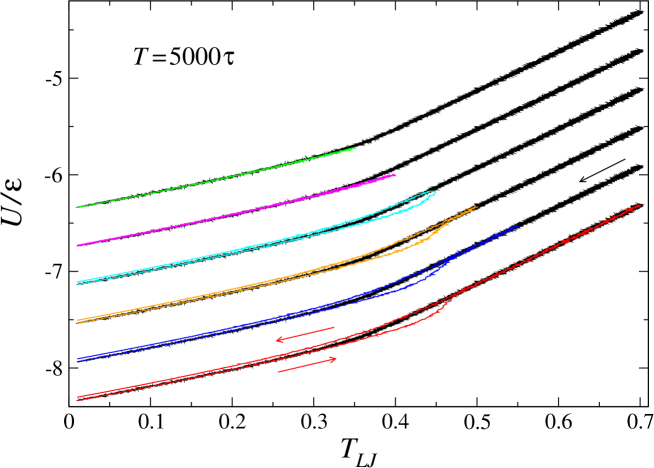
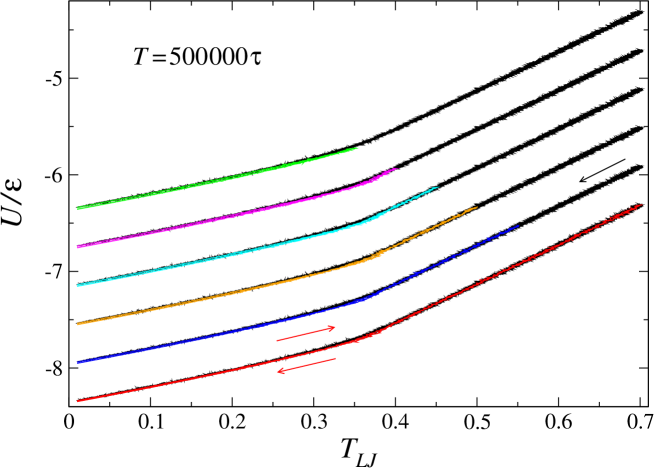
The variation of the potential energy per atom during the heating and cooling cycle is presented in Figs. 3–5 for cycling periods , , and for selected values of the maximum temperature. For reference, the potential energy upon cooling from to with the rate is shown by the black curves. The data denoted by the black curves are the same, and, except for the lowest one, the curves are displaced vertically for clarity. The directions of the temperature variation in each case are indicated by the corresponding arrows. We also comment that extrapolation of from the glass and liquid regions provides an estimate of the glass transition temperature , which is lower than the value of obtained from the data shown in the inset to Fig. 2.
As shown in Fig. 3, the potential energy during thermal loading with the smallest period and essentially coincides with the data obtained during initial cooling with the rate , and thus the potential energy before and after the thermal cycle remains nearly the same. Note that in the case , the heating rate is greater than , and the system enters the region above the glass transition with the potential energy smaller than during the initial cooling (denoted by the black curve). When , the system is first rejuvenated and then cooled down with the rate of (greater than ), resulting in higher energy states (see the cyan curve in Fig. 3). Finally, during the thermal treatment with the maximum temperatures , the potential energy follows the black curve up to and above (see Fig. 3). In these cases, the change in the potential energy due to thermal loading is simply determined by the effective cooling rate ; i.e., the potential energy at the end of the cycle becomes higher with increasing .
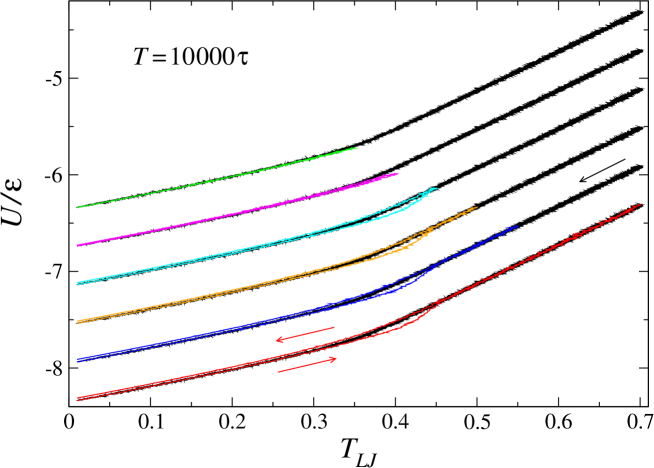
The same trends can be observed in Fig. 4 for thermal cycling with the larger period , except that the area of the hysteresis loops near becomes smaller and the potential energy difference after a full cycle is reduced due to the lower cooling rate . By contrast, a qualitatively different behavior occurs for the largest period , as shown in Fig. 5. In this case, the heating and cooling rates are smaller than the initial cooling rate . During the thermal loading with , the system remains in the glass phase, and the aging is accelerated when the temperature is close to , resulting in a noticeable decrease of the potential energy at the end of the cycle (see Fig. 5). Furthermore, when , the system enters the liquid phase and then cooled with the rates slower than , and thus the potential energy after the thermal cycle is also reduced. This behavior is consistent with the simulation results of thermal processing of Cu-Zr amorphous alloys Ogata15 ; EgamiFan17 .
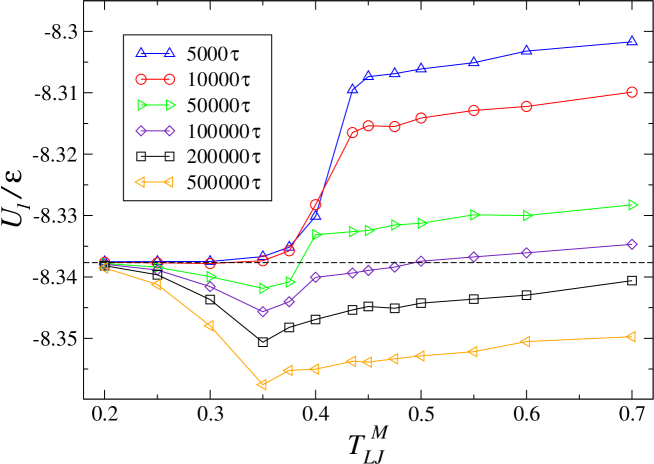
The summary of the data for the potential energy after the thermal cycle, , is presented in Fig. 6 for the indicated loading periods. For comparison, the potential energy level after the initial cooling with the rate of , but before the thermal treatment, is denoted by the horizontal dashed line. Several features are noteworthy. It can be seen in Fig. 6 that the potential energy after the thermal cycle with the maximum temperature remains nearly unchanged for small periods, and , while is reduced for larger periods. With increasing loading period, the energy difference increases, and the lowest value is attained at when . Interestingly, it was recently found that approximately the same value of the potential energy was obtained after 100 thermal cycles with the period and maximum temperature for the glass prepared with the cooling rate Priez18T5000 . These results suggest that the aging process, which is accelerated in the vicinity of , leads to the same energy decrease regardless whether the waiting time interval is continuous or discrete.
It should also be commented that the possibility of attaining higher energy states upon cryogenic thermal cycling (well below ) was recently discussed by Shang et al. Barrat18 . In particular, it was concluded that internal stresses due to heterogeneity in the local thermal expansion can induce local shear transformations, provided that the system size is sufficiently large Barrat18 . The efficiency of thermal rejuvenation generally increases with the number of thermal cycles and becomes relatively large when the system dimensions exceed about 10 nm Barrat18 . In the present study, however, the appearance of rejuvenated states in Fig. 6 for small periods and when is related to the small hysteresis near , as shown in Figs. 3 and 4. In other words, the aging effects are negligible when , and the system approaches the glass transition temperature, becomes slightly rejuvenated, and then quenched with a high rate into the glass phase, resulting in higher potential energy states.
As illustrated in Fig. 6, the thermal loading process with the maximum temperature can lead to either rejuvenated or relaxed states depending on the effective cooling rate . Thus, the energy difference is positive when , and it is mainly determined by the time interval when is above the glass transition temperature, , as well as the ratio between the rates and . Note that the potential energy before and after thermal loading with and is nearly the same, since the cooling rate is essentially equal to the initial cooling rate . As is evident from Fig. 6, reaches a quasi-plateau for all cycling periods when , and its slope is directly related to the increase in the cooling rate .
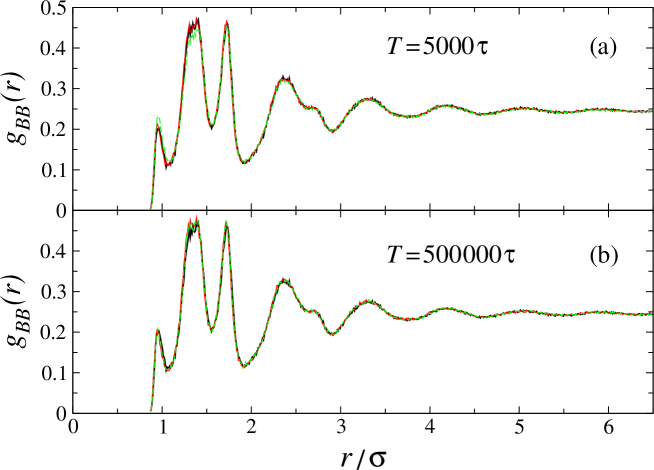
Although the atomic structure before and after the thermal loading remains amorphous, some subtle differences can be detected by examining the radial distribution function. In the previous MD study of the KA binary mixture, it was shown that one of the most sensitive measures of structural changes upon temperature variation is the distribution function of small atoms of type Stillinger00 . In Fig. 7, we plot the averaged distribution function of atoms for the smallest and largest periods. Two values of the maximum temperature were chosen, and , at which the aging and rejuvenation effects are most pronounced. For reference, the data before the thermal loading are also included in Fig. 7. It can be seen in Fig. 7 (a) that the most rejuvenated state at and is characterized by a slightly higher value of the peak height at , while the second peak becomes lower. In contrast, the structure of the aged glass loaded during at has a slightly higher second peak, as shown in Fig. 7 (b). It should be also mentioned that we did not detect a pronounced icosahedral order either before or after thermal loading, and, therefore, it is not reported here. It was found, however, that aging increases and rejuvenation decreases the icosahedral short-range order in Zr-based metallic glasses Ogata15 .
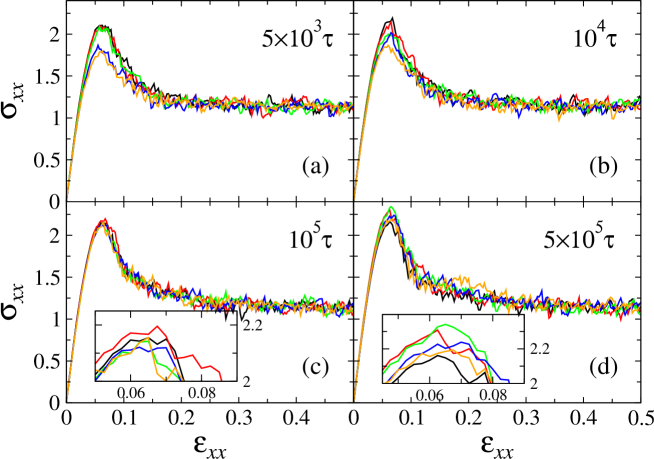
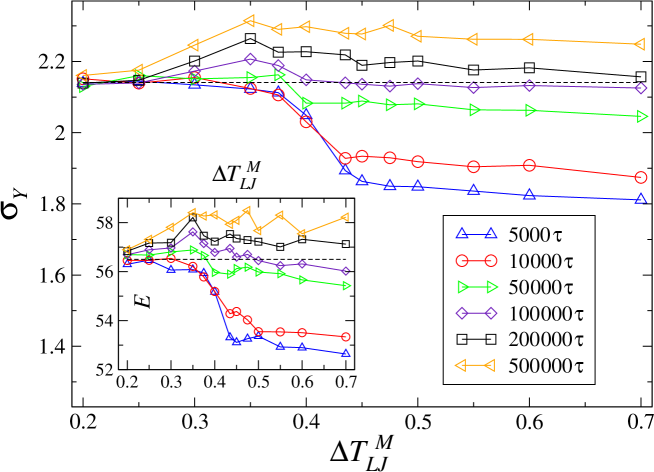
The representative stress-strain curves after the thermal loading process are presented in Fig. 8 for different cycling periods. The samples were uniaxially strained with a constant rate at and . In all cases, the tensile stress exhibits a distinct peak, followed by a steady flow at higher strain. It can be observed in Fig. 8 (a) that the largest decrease in the peak height occurs after loading with the period when the maximum temperature varies from to . This trend is inversely correlated with the behavior of for shown in Fig. 6. On the other hand, as increases, the stress overshoot becomes larger than its value for for the largest period , see Fig. 8 (d). Next, the elastic modulus was computed from the linear fit of the stress-strain curves for and then averaged over 10 samples for each and . The data for the stress overshoot, , and the elastic modulus, , are plotted in Fig. 9. Overall, the variation of mechanical properties of thermally loaded samples, compared to untreated glasses, correlates well with the change in the potential energy reported in Fig. 6. In other words, rejuvenated glasses are characterized by reduced values of and , while the opposite trend is observed for aged samples. The maximum decrease in and of about 10% is detected for the smallest period and .
IV Conclusions
In summary, the effect of thermal loading on mechanical and structural properties of binary glasses was examined using molecular dynamics simulations. The amorphous material was represented by the binary Lennard-Jones mixture, which was initially annealed with a computationally slow cooling rate from the liquid state to a temperature well below the glass transition point. It was shown that a single cycle of heating and cooling leads to either rejuvenated or relaxed states depending on the maximum temperature and loading period. More specifically, the higher energy states were obtained when the maximum temperature is above the glass transition and the loading period is relatively small, so that the effective heating/cooling rates are higher than the initial cooling rate. In contrast, thermal loading during longer periods resulted in lower energy states due to either aging below or slower cooling from the liquid state. The structural changes due to thermal loading are reflected in the height of the first two peaks in the radial distribution function of small atoms. Moreover, the dependence of the elastic modulus and the stress overshoot on the maximum loading temperature is inversely related to the change in the potential energy for a given loading period. Thus, the simulation results indicate that a significant decrease in the yield stress is obtained in binary glasses rapidly heated and cooled above the glass transition temperature at constant pressure conditions.
Acknowledgments
Financial support from the National Science Foundation (CNS-1531923) is gratefully acknowledged. The article was prepared within the framework of the HSE University Basic Research Program and funded by the Russian Academic Excellence Project ‘5-100’. The molecular dynamics simulations were performed using the LAMMPS software developed at Sandia National Laboratories Lammps . The numerical simulations were performed at Wright State University’s Computing Facility and the Ohio Supercomputer Center.
References
- (1) X. P. Li, Additive Manufacturing of Advanced Multi-Component Alloys: Bulk Metallic Glasses and High Entropy Alloys, Adv. Eng. Mater. 20, 1700874 (2018).
- (2) M. Jafary-Zadeh, G. P. Kumar, P. S. Branicio, M. Seifi, J. J. Lewandowski, and F. S. Cui, A Critical Review on Metallic Glasses as Structural Materials for Cardiovascular Stent Applications, J. Funct. Biomater. 9, 19 (2018).
- (3) Y. Sun, A. Concustell, and A. L. Greer, Thermomechanical processing of metallic glasses: extending the range of the glassy state, Nature Reviews Materials 1, 16039 (2016).
- (4) D. Grell, J. Gibmeier, S. Dietrich, F. Silze, L. Bohme, V. Schulze, U. Kuhn, and E. Kerscher, Influence of shot peening on the mechanical properties of bulk amorphous Vitreloy 105, Surface Engineering 33, 721 (2017).
- (5) J. C. Qiao, J. M. Pelletier, C. Esnouf, Y. Liu, and H. Kato, Impact of the structural state on the mechanical properties in a Zr -Co -Al bulk metallic glass, Journal of Alloys and Compounds 607, 139 (2014).
- (6) C. Ebner, B. Escher, C. Gammer, J. Eckert, S. Pauly, and C. Rentenberger, Structural and mechanical characterization of heterogeneities in a CuZr-based bulk metallic glass processed by high pressure torsion, Acta Materialia 160, 147 (2018).
- (7) D. J. Magagnosc, G. Kumar, J. Schroers, P. Felfer, J. M. Cairney, and D. S. Gianola, Effect of ion irradiation on tensile ductility, strength and fictive temperature in metallic glass nanowires, Acta Materialia 74, 165 (2014).
- (8) S. V. Ketov, Y. H. Sun, S. Nachum, Z. Lu, A. Checchi, A. R. Beraldin, H. Y. Bai, W. H. Wang, D. V. Louzguine-Luzgin, M. A. Carpenter, and A. L. Greer, Rejuvenation of metallic glasses by non-affine thermal strain, Nature 524, 200 (2015).
- (9) W. Guo, R. Yamada, J. Saida, S. Lu, and S. Wu, Various rejuvenation behaviors of Zr-based metallic glass by cryogenic cycling treatment with different casting temperatures, Nanoscale Research Letters 13, 398 (2018).
- (10) D. J. Lacks and M. J. Osborne, Energy landscape picture of overaging and rejuvenation in a sheared glass, Phys. Rev. Lett. 93, 255501 (2004).
- (11) N. V. Priezjev, Heterogeneous relaxation dynamics in amorphous materials under cyclic loading, Phys. Rev. E 87, 052302 (2013).
- (12) D. Fiocco, G. Foffi, and S. Sastry, Oscillatory athermal quasistatic deformation of a model glass, Phys. Rev. E 88, 020301(R) (2013).
- (13) I. Regev, T. Lookman, and C. Reichhardt, Onset of irreversibility and chaos in amorphous solids under periodic shear, Phys. Rev. E 88, 062401 (2013).
- (14) N. V. Priezjev, Dynamical heterogeneity in periodically deformed polymer glasses, Phys. Rev. E 89, 012601 (2014).
- (15) R. Cao, Y. Deng, and C. Deng, Hardening and crystallization in monatomic metallic glass during elastic cycling, J. Mater. Res. 30, 1820 (2015).
- (16) N. V. Priezjev, Reversible plastic events during oscillatory deformation of amorphous solids, Phys. Rev. E 93, 013001 (2016).
- (17) N. V. Priezjev, Nonaffine rearrangements of atoms in deformed and quiescent binary glasses, Phys. Rev. E 94, 023004 (2016).
- (18) P. Leishangthem, A. D. S. Parmar, and S. Sastry, The yielding transition in amorphous solids under oscillatory shear deformation, Nat. Commun. 8, 14653 (2017).
- (19) N. V. Priezjev, Collective nonaffine displacements in amorphous materials during large-amplitude oscillatory shear, Phys. Rev. E 95, 023002 (2017).
- (20) M. H. Yang, J. H. Li, and B. X. Liu, Comparatively studying the local atomic structures of metallic glasses upon cyclic-loading by computer simulations, RSC Adv. 7, 18358 (2017).
- (21) N. V. Priezjev, Molecular dynamics simulations of the mechanical annealing process in metallic glasses: Effects of strain amplitude and temperature, J. Non-Cryst. Solids 479, 42 (2018).
- (22) N. V. Priezjev, The yielding transition in periodically sheared binary glasses at finite temperature, Comput. Mater. Sci. 150, 162 (2018).
- (23) P. K. Jana, M. J. Alava, and S. Zapperi, Irreversible transition of amorphous and polycrystalline colloidal solids under cyclic deformation, Phys. Rev. E 98, 062607 (2018).
- (24) N. V. Priezjev, Slow relaxation dynamics in binary glasses during stress-controlled, tension-compression cyclic loading, Comput. Mater. Sci. 153, 235 (2018).
- (25) N. V. Priezjev and M. A. Makeev, Structural transformations during periodic deformation of low-porosity amorphous materials, Modelling Simul. Mater. Sci. Eng. 27, 025004 (2019).
- (26) N. V. Priezjev, The effect of cryogenic thermal cycling on aging, rejuvenation, and mechanical properties of metallic glasses, J. Non-Cryst. Solids 503-504, 131 (2019).
- (27) N. V. Priezjev, The potential energy states and mechanical properties of thermally cycled binary glasses, arXiv:1810.10877 (2018).
- (28) Q.-L. Liu and N. V. Priezjev, The influence of complex thermal treatment on mechanical properties of amorphous materials, Comput. Mater. Sci. (2019). arXiv:1811.02365
- (29) M. Wakeda, J. Saida, J. Li, and S. Ogata, Controlled rejuvenation of amorphous metals with thermal processing, Sci. Rep. 5, 10545 (2015).
- (30) N. Miyazaki, M. Wakeda, Y.-J. Wang, and S. Ogata, Prediction of pressure-promoted thermal rejuvenation in metallic glasses, NPJ Comput. Mater. 2, 16013 (2016).
- (31) Y. Fan, T. Iwashita, and T. Egami, Energy landscape-driven non-equilibrium evolution of inherent structure in disordered material, Nat. Commun. 8, 15417 (2017).
- (32) J. Saida, R. Yamada, M. Wakeda, and S. Ogata, Thermal rejuvenation in metallic glasses, Sci. Technol. Adv. Mater. 18, 152 (2017).
- (33) S. Kuchemann, P. M. Derlet, C. Liu, D. Rosenthal, G. Sparks, W. S. Larson, and R. Maass, Energy Storage in Metallic Glasses via Flash Annealing, Adv. Funct. Mater. 28, 1805385 (2018).
- (34) M. Wang, H. Liu, J. Mo, Y. Zhang, Z. Chen, C. Yin, and W. Yang, Thermal-pressure effects on energy state of metallic glass Cu50Zr50, Comput. Mater. Sci. 155, 493 (2018).
- (35) B. Shang, P. Guan, and J.-L. Barrat, Role of thermal expansion heterogeneity in the cryogenic rejuvenation of metallic glasses, J. Phys.: Mater. 1, 015001 (2018).
- (36) W. Kob and H. C. Andersen, Testing mode-coupling theory for a supercooled binary Lennard-Jones mixture: The van Hove correlation function, Phys. Rev. E 51, 4626 (1995).
- (37) T. A. Weber and F. H. Stillinger, Local order and structural transitions in amorphous metal-metalloid alloys, Phys. Rev. B 31, 1954 (1985).
- (38) S. J. Plimpton, Fast parallel algorithms for short-range molecular dynamics, J. Comp. Phys. 117, 1 (1995).
- (39) M. P. Allen and D. J. Tildesley, Computer Simulation of Liquids (Clarendon, Oxford, 1987).
- (40) P. G. Debenedetti and F. H. Stillinger, Supercooled liquids and the glass transition, Nature 410, 259 (2001).
- (41) M. Utz, P. G. Debenedetti, and F. H. Stillinger, Atomistic simulation of aging and rejuvenation in glasses, Phys. Rev. Lett. 84, 1471 (2000).