Optimizing Multi-Wavelength Blazar Studies through Fermi-LAT and Swift Synergy
Christina D. Moraitis (Samford University, NASA Goddard Space Flight Center), D. J. Thompson (NASA Goddard Space Flight Center)
Abstract
Blazar flares seen by the Fermi Gamma-Ray Space Telescope Large Area Telescope (Fermi LAT) are often followed up by Target of Opportunity (ToO) requests to the Neil Gehrels Swift Observatory (Swift). Using flares identified in the daily light curves of Fermi LAT Monitored Sources, we investigated which follow-up Swift ToO requests resulted in refereed publications. The goal was to create criteria of what Swift should look for in following up a Fermi-LAT gamma-ray flare. Parameters tested were peak gamma-ray flux, flare duration (based on a Bayesian Block analysis), type of AGN (BL Lac or FSRQ), and pattern of activity (single flare or extensive activity). We found that historically active sources and high-photon-flux sources result in more publications, deeming these successful Swift ToOs, while flare duration and type of AGN had little or no impact on whether or not a ToO led to a publication.
1. Introduction
The Fermi Gamma-Ray Space Telescope (Atwood et al., 2009) and the Neil Gehrels Swift Observatory (Swift) (Gehrels et al., 2004) are both key tools for studying flaring gamma-ray sources. Fermi LAT has a broad observation range, from 0.1-300 GeV energies. Not only so, but through LAT’s unprecedented wide field of view, it has observed the entire celestial sphere regularly for over ten years of its mission. Often when a flare is detected with Fermi LAT, that source will be followed up via a Target of Opportunity (ToO) request to Swift to further study the source in X-ray, UV and optical wavelengths. Doing so will tell more about the source, what specific type of blazar it may be, and what physical processes are occurring to cause the observed flares. As more and more gamma-ray sources are observed by Fermi, more and more ToOs are sent to Swift for multi-wavelength follow up. There will be a time when Swift will not be able to follow up all of the ToO requests that it receives. Due to this potential saturation of requests, a study was conducted as a student project over the course of two months to help optimize future ToO requests to Swift with the goal of developing guidelines for when a ToO is most likely to be fruitful.
2. Method
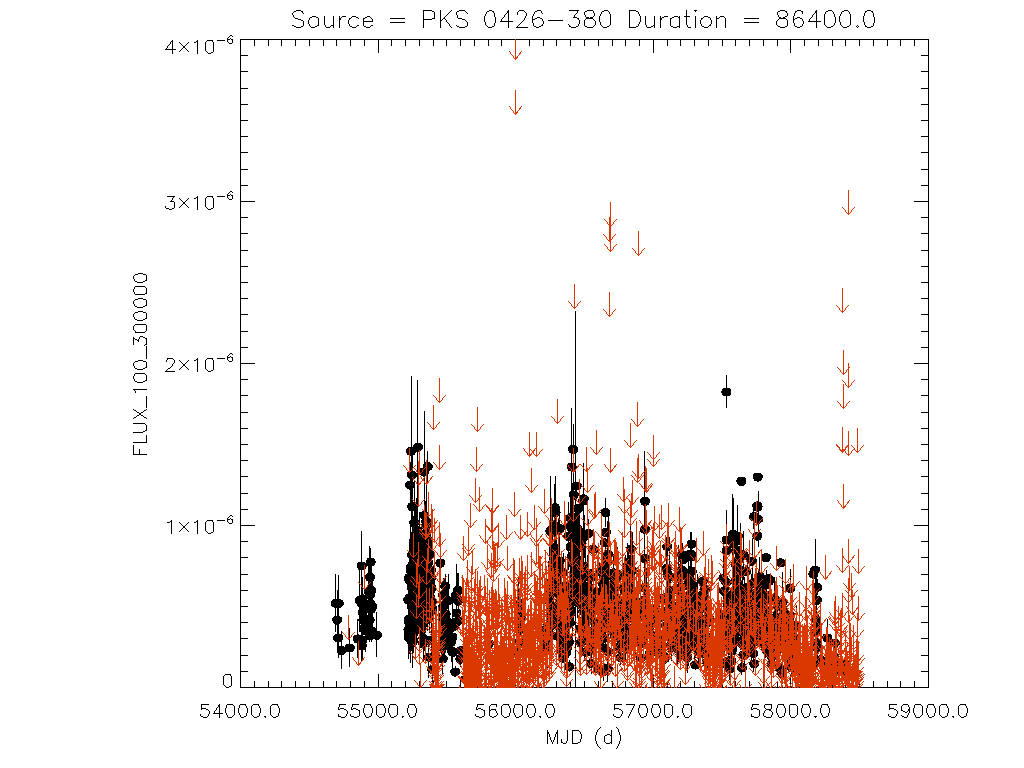
The starting point for this project was the Fermi-LAT Monitored Source List, available from the Fermi Science support Center Web site: https://fermi.gsfc.nasa.gov/ssc/data/access/lat/msl_lc/. This public data set provides daily and weekly light curves generated by an automated analysis, for all gamma-ray sources whose daily flux has ever exceeded above 100 MeV. Although these light curves do not have absolute flux calibration consistent over the life of the mission, they offer a convenient way to identify short-term flaring activity. The vast majority of the sources in this list are gamma-ray blazars. An example is shown in Fig. 1.
The analysis steps are as follows:
-
1.
Sort through the Monitored Source List, picking out sources that flared prior to 2017 and had significant and visually interesting activity, such as one or more well-defined flares. We found that 110 out of 158 were of interest. We excluded later flares, because publications for those flares were unlikely to have been complete by mid-2018.
-
2.
Determine if the Fermi sources had Swift ToO follow-ups by searching through the online Swift ToO archive at www.swift.psu.edu/secure/toop/summary.php. It was found that 91 out of 110 Fermi-LAT sources have a least one Swift observation after Fermi’s 2008 launch.
-
3.
Search for publications using Fermi and Swift data for individual sources in this collection, using the SAO/NASA ADS system: adsabs.harvard.edu. Of the 91 sources with observations by both satellites, 32 had publications using data from both, and 21 of these explicitly mentioned the Swift ToO. A list of these references is given in Appendix A.
-
4.
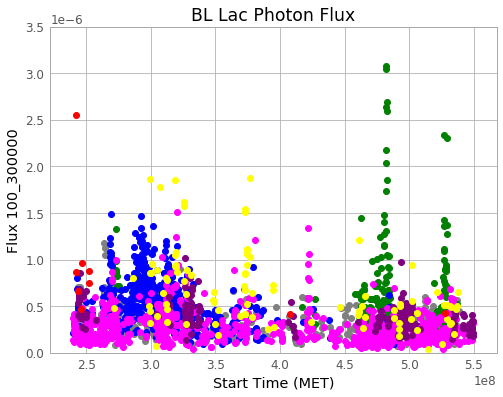
For all 110 sources of interest, download the FITS files of the gamma-ray data, then use python code to overplot light curves for similar types of sources (e.g. BL Lac objects) to look for similarities. An example is shown in Fig. 2.
- 5.
-
6.
Categorize the sources: type of object, peak daily flux, duration of flares, and number of flares.
3. Results
For the characteristics of the “successful” ToOs, we concentrate on the 21 that explicitly mentioned the Swift ToO in the publication. One was a flare of the Crab Nebula. We exclude that as being a special case. Some results:
-
•
Approximately 2/3 of the successful ToOs involved blazars that were historically active, showing multiple flares over an extended time range. The rest had only one or a few flares.
-
•
Over half of these results involved Flat Spectrum Radio Quasars (FSRQs), with the rest divided between BL Lac objects and blazars of uncertain type. This result is not surprising, since gamma-ray FSRQs are typically more variable than BL Lac objects (Ackermann et al., 2015).
-
•
Flare durations were widely scattered, ranging from 1 day to 9 months, with an average duration of 38 days.
Comparing the sources that produced publications with those that did not gives the following:
-
•
Of the 8 Fermi-LAT sources with peak flare 8 above 100 MeV, 7 resulted in publications including Swift ToO results. The one remaining case was a flare of 3C273 that occurred at a time Swift had a sun angle constraint and was not able to execute the ToO.
-
•
For Fermi-LAT sources with peak flare 1–3 above 100 MeV, 14 out of 76 cases had publications including Swift ToO results.
-
•
Sources that resulted in publications had an average of 2.7 flares in the Fermi-LAT data, while those that were not published had an average of 1.7 flares.
The peak flux for these flaring sources is clearly an important parameter. Another way to express the flux dependence is: for Fermi/Swift published sources, the median flux was 2.4 above 100 MeV; for Fermi/Swift unpublished sources, the median flux was 2.0 in the same units; and for sources that did not have a Swift ToO, the median flux was 1.1 in the same units.
4. Conclusions
Based on a study of Swift ToOs for flaring Fermi-LAT gamma-ray sources, we can draw these conclusions:
-
•
Peak gamma-ray flux is the clearest indicator of which Swift ToOs are most likely to result in a publication. Very bright flares are almost always published.
-
•
Historically active blazars, ones with multiple flares over the time of the Fermi mission, are more likely to result in publications than those with only a few flares.
-
•
The type of source and the durations of flares have little effect on whether a source produces a publication.
While these conclusions offer guidance about Swift ToO requests, they are not the only considerations. Higher flux flares are rarer and arguably more interesting than lower flux flares. However, lower flux flares should not be ruled out every time because there are instances where lower flux flares provide groundbreaking insight, such as the indication of neutrino emission from TXS 0506+056 (IceCube Collaboration et al., 2018). Since we have more information on the historic sources, this obviously will lead to more publications. More data on a source means more to analyze, which leads to more conclusions on the source mechanisms. Again the TXS 0506+056 offers a counterexample, since it is not a particularly active gamma-ray source.
One other result from this study stands out. Our searches turned up no obvious publications using data from both satellites for a large fraction of the flaring Fermi-LAT gamma-ray sources that also have Swift data. We may, of course, have missed some references, or they could still be in preparation. Some of the sources also have publications that do not use both data sets. Nevertheless there appears to be a significant body of observational data about flaring blazars that has not yet been exploited. Information about these sources is found in Appendix B.
5. Acknowledements We wholeheartedly acknowledge and thank the hardworking members of the Fermi-LAT Collaboration and the Swift team for providing the data for this study. We thank and recognize postdoctoral NASA fellow Sara Buson for her help in creating Bayesian Block python code used in the study for flare amount, duration, and variation analysis. We also recognize Penn State University and their documentation of Swift ToO requests, Strasbourg University for their SIMBAD astronomical database used to help classify sources, as well as the Smithsonian Astrophysical Observatory and NASA efforts in providing the Astrophysics Data System used in searching for targeted publications.
References
- Ackermann et al. (2015) Ackermann, M., Ajello, M., Atwood, W. B. et al. 2015, ApJ, 810, 14
- Atwood et al. (2009) Atwood, W. B., Abdo, A. A., Ackermann, M., et al. 2009, ApJ, 697, 1071
- Gehrels et al. (2004) Gehrels, N. 2004, Astrophys.J., 611, 1005
- IceCube Collaboration et al. (2018) IceCube Collaboration, Fermi-LAT, MAGIC, AGILE, ASAS-SN, HAWC, H.E.S.S 2018, Science, 361, 6398
- Scargle et al. (2013) Scargle, J. D., Norris, J. P., Jackson, B., Chiang, J. 2013, ApJ, 764, 167
Appendix A
Publications resulting from Fermi-LAT/Swift ToO studies are given below.
Abdo A. A., et al. 2015, ArXiv:1411.4915v2
Abdo, A. A., et al. 2010, ArXiv:1011.1053v1
Abdo, A. A., et al. 2010, ArXiv:0912.4029v2
Abdo, A. A., et al. 2009, ArXiv:0905.4558v1
Abdo, A. A., et al. 2009, ArXiv:0903.1713v1
Abramowski, A., et al. 2016, ArXiv:1409.0253v1
Ackermann, M., et al. 2014, The Astrophysical Journal, Volume 786(157), 17
Aleksic, J., et al. 2018, ArXiv:1401.5646v2
Bottacini, E., Bottecher, M., Pian, E., Collmar, W., 2016, arXiv:1610.01617v1
D?Ammando, F., et al. 2015, ArXiv:1504.05595v1
D?Ammando, F., et al. 2014, ArXiv:1410.7144v1
D?Ammando, F., et al. 2013a, ArXiv:1302.5439v1
D?Ammando, F., et al. 2012, ArXiv:1209.0479v1
D?Ammando, F., Orienti, M., 2015, ArXiv:1510.06416v1
Dutka, M., et al. 2016, ArXiv:1612.08061v1
Ghisellini G., Tavecchio, F., Foschini, L., Bonnoli, G.,Tagliferri, G., 2013, ArXiv:1302.4444v2
Kaur, N., Baliyan, S. K., 2018, ArXiv:1805.04692v1
Larionov, V. M., et al. 2016, ArXiv:1606.07836v1
Pian, E., et al. 2018, ArXiv:1011.3224v1
Piano, G., et al. 2018, ArXiv:1805.05640v2
Pittori, C., et al. 2018, ArXiv:1803.07529v1
Pucella, G., et al. 2010, A&A 522, A109
Rani, B., et al. 2016, ArXiv:1609.04024v1
Tagliaferri, G., et al. 2015, arXiv:1503.04848v2
Tanaka, Y. T., et al. 2016, ArXiv:1604.05427v1
Weidinger, M., Ruger, M., Spanier, F., 2010, Astrophys. Space Sci. Trans., 6, 1?7
Zhang, J., et al. 2017, ArXiv:1709.02161v1
Zhang. S, Collmar. W, Torres. D. F, Wang. J, Lang. M, Zhang. S. N. 2010, A&A, 514, A69
Appendix B
The tables list flaring sources from the Fermi-LAT Monitored Source List that had Swift observations but no obvious publication using the data from both satellites. The flux values come from the automated analysis and are therefore approximate.
| Name of Source | Maximum daily flux | Number of flares |
|---|---|---|
| 4C+01.02 / PKS 0106+01 | 3 | 3 |
| CGRaBS J0211+1051 | 1.1 | 1 |
| S3 0218+35 | 4 | 4 |
| 4C+28.07 | 2.2 | 3 |
| PKS 0301243 | 1.4 | 1 |
| PKS 033601 | 2 | 2 |
| PKS 0402362 | 6 | 4 |
| NRAO 190 | 3 | 3 |
| PKS 0454234 | 1.7 | 4 |
| PKS 045802 | 1.9 | 2 |
| PKS 0502+049 | 3.2 | 2 |
| PKS 0507+17 | 4.1 | 2 |
| VER 0521+211 | 1 | 1 |
| PKS 0528+134 | 1.2 | 1 |
| OG 050 | 1.6 | 1 |
| B2 0619+33 | 1.8 | 1 |
| 4C 14.23 | 2.1 | 1 |
| PKS 072711 | 1 | 1 |
| PKS 0736+01 | 2.1 | 2 |
| PKS 080507 | 1.6 | 2 |
| 0827+243 | 1.2 | 1 |
| PKS B0906+015 | 1.5 | 2 |
| S4 1030+61 | 1.3 | 1 |
| S5 1044+71 | 1.3 | 2 |
| 1150+497 | 2.4 | 1 |
| Ton 599 | 2.1 | 3 |
| ON 246 | 1 | 1 |
| GB6 B1310+4844 | 2.1 | 1 |
| PKS 1313333 | 1.3 | 1 |
| PKS 1329049 | 4.1 | 1 |
| B3 1343+451 | 1.3 | 1 |
| PKS 1424-41 | 3 | 5 |
| B2 1520+31 | 2 | 2 |
| TXS 1530131 | 1.5 | 1 |
| PKS 1622253 | 3 | 2 |
| GB6 J1700+6830 | 1 | 1 |
| 1730130 | 1.5 | 1 |
| OT 081 | 4 | 1 |
| S5 1803+78 | 1.3 | 1 |
| S4 1800+44 | 3 | 1 |
Note: the flux values are approximate and in units of above 100 MeV.
| Name of Source | Maximum daily flux | Number of flares |
|---|---|---|
| PKS 1824582 | 3.9 | 2 |
| CGRaBS J1848+3219 | 2 | 2 |
| B2 1846+32B | 2.2 | 1 |
| PKS 2032+107 | 3.2 | 1 |
| PKS 2136642 | 1.5 | 1 |
| NRAO 676 | 4.5 | 3 |
| BL Lac | 2.3 | 4 |
| PKS 2233148 | 3 | 2 |
| TXS 2241+406 | 1.5 | 1 |
| B2 2308+34 | 1.5 | 2 |
| PKS 2320035 | 1 | 1 |
Note: the flux values are approximate and in units of above 100 MeV.