Implications of the lens redshift distribution of strong lensing systems: cosmological parameters and the global properties of early-type galaxies
Abstract
In this paper, we assemble a well-defined sample of early-type gravitational lenses extracted from a large collection of 158 systems, and use the redshift distribution of galactic-scale lenses to test the standard cosmological model (CDM) and the modified gravity theory (DGP). Two additional sub-samples are also included to account for possible selection effect introduced by the detectability of lens galaxies. Our results show that independent measurement of the matter density parameter () could be expected from such strong lensing statistics. Based on future measurements of strong lensing systems from the forthcoming LSST survey, one can expect to be estimated at the precision of , which provides a better constraint on than Planck 2015 results. Moreover, use the lens redshift test is also used to constrain the characteristic velocity dispersion of the lensing galaxies, which is well consistent with that derived from the optical spectroscopic observations. A parameter is adopted to quantify the relation between the lensing-based velocity dispersion and the corresponding stellar value. Finally, the accumulation of detectable galactic lenses from future LSST survey would lead to more stringent fits of , which encourages us to test the global properties of early-type galaxies at much higher accuracy.
1 Introduction
The current accelerating expansion of the Universe, which is supported by the observations of Type Ia supernovae (SNIa) (Riess et al., 1998; Perlmutter et al., 1999) in combination with independent estimates of cosmic microwave background (CMB) (Spergel et al., 2003) and large scale structure (LSS) (Eisenstein et al., 2005), has become one of the fundamental challenges to standard models in particle physics and modern cosmology. As was pointed out in an increasing body of literature (Ellis & Buchert, 2005; Wiltshire, 2007), this cosmic acceleration can be attributed to an energy component with negative pressure (the so called dark energy), which dominates the universe at late times and causes the observed accelerating expansion. The other possibility is to contemplate modifications to the Friedman- Robertson-Walker models arising from extra dimensions, which has triggered many theoretical speculations in the so-called brane-world scenarios (Dvali et al., 2000). However, the potential of certain type of observational data, even though ever increasing, does not yet allow us to differentiate the two likely explanations for the observed cosmic acceleration. For instance, the SNIa data would not be sufficient to place stringent constraint on cosmological parameters, if taken alone separately from the other approaches (Hinshaw et al., 2009). Indeed, the power of modern cosmology lies in building up consistency rather than in single and precise experiments (Biesiada, Piórkowska, & Malec, 2010), which indicates that every alternative method of restricting cosmological parameters is desired. Following this direction, a number of combined analyses involving baryonic fraction the x-ray gas mass fraction of clusters (Allen et al., 2008), radio observations of the Sunyaev-Zeldovich effect together with X-ray emission (De Filippis et al., 2005), and ultra-compact structure in intermediate-luminosity radio quasars (Cao et al., 2017a, b) have been performed in the literature, which were able to constrain the cosmological parameters consistent with the analysis of Type Ia supernovae. In this paper, we will assemble a large sample of strongly gravitationally lenseing systems (SGL) (Cao et al., 2015; Shu et al., 2017) to examine whether the lens redshift distribution test can be utilized - not only to optimize the parameters in CDM model - but also to carry out comparative studies between competing cosmologies.
In the past decades, an cosmological examination of galactic-scale SGL systems, based on the derived angular diameter distances between the source, the lens, and the observer, has been applied to test a diverse range of dynamical dark energy models. For example, the XCDM model in which dark energy is described by a hydrodynamic energy-momentum tensor with a constant EoS coefficient, and the holographic dark energy model arising from the holographic principle of quantum gravity theory (Li et al., 2016). On the other hand, the first attempt to determine cosmological parameters from the redshift distribution of the lensing galaxies was presented in Ofek, Rix & Maoz (2003), which investigated the viability of using lens redshift test to place additional constraints on dark energy models. The original (to our knowledge) formulations of this approach can be traced back to Kochanek (1992); Helbig & Kayser (1996); Kochanek (1996a). The purpose of this paper is to extend our previous statistical analysis based on the angular separation distribution of the lensed images (Cao, Zhu & Zhao, 2011; Cao & Zhu, 2012), and show how the lens redshift distribution of the most recent and significantly improved observations of early-type gravitational lenses (158 combined systems) can be used to provide accurate estimates of the cosmological constant in the CDM model and the parameters of alternative cosmological models.
More importantly, in the framework of the concordance cosmological model (CDM) and a singular isothermal ellipsoid (SIE) model for galactic potentials, strong lensing statistics have been most often used for a different purpose: to study the number density of lensing galaxies as a function of redshift, i.e., the velocity dispersion function (VDF) of potential lenses, since strong lensing probability is proportional to the comoving number density times (the image separation is proportional to ) (Chae, 2007). Meanwhile, considering the fact that early-type galaxies dominate the lensing cross sections due to their larger central mass concentrations, gravitational lenses therefore provide a unique mass-selected sample to study the global properties of early-type galaxies over a range of redshifts (up to ). A pioneer work was made by Chae et al. (2005), which investigated the VDF of early-type galaxies based on the distribution of lensed image separations observed in the Cosmic Lens All-Sky Survey (CLASS) and the PMN-NVSS Extragalactic Lens Survey (PANELS). However, the statistical lens sample of lensed systems, which are required to be complete for image separations, is too small to provide accurate estimates. In this work, focusing a larger sample of 158 gravitational lenses drawn from the Sloan Lens ACS (SLACS) Survey and other sky surveys (Cao et al., 2015; Shu et al., 2017), we will use the distribution of lens reshifts to provide independent constraints on the velocity dispersion function of early-type galaxies (), especially the characteristic velocity dispersion () in a solely lensing-based VDF.
This paper is organized as follows. In Section 2 we briefly describe the methodology and the lens redshift data from various surveys. In Section 3 we introduce two prevalent cosmologies and show the fitting results on the relevant cosmological parameters. In Section 4 we present the constraints on a model VDF of early-type galaxies and discuss their implications. The final conclusions are summarized in Section 5.
2 Methodology and observations
On the assumption that early-type galaxies are uniformly distributed in comoving space and distributed in luminosity following a Schechter (1976) luminosity function, the differential probability of the ray from the background source encountering a lens per unit redshift is (Turner et al., 1984)
| (1) |
where is the number density of the lenses, is the lensing cross-section for multiple imaging with Einstein radius . The proper distance interval in the FLRW metric is calculated to be
| (2) |
where is the speed of light, is the Hubble parameter (the expansion rate of the Universe) at redshift , which is also dependent on the cosmological parameters p.
First of all, concerning the radial mass distribution of early-type galaxies, we use the spherically symmetric power-law mass distribution as the lens model, which has been extensively used in recent studies of lensing caused by early-type galaxies (Treu et al., 2006; Cao et al., 2015; Li et al., 2016). In the framework of a general mass model for the total (i.e. luminous plus dark-matter) mass density () and luminosity density () (Koopmans et al., 2005)
| (3) |
denotes that the shape of the luminosity density follows that of the total mass density, while describes a sphere of collisional ideal gas in equilibrium between thermal pressure and self gravity. Note that the measurement of Einstein radius () provides us with the mass inside :
| (4) |
where denotes the critical projected mass density and the Einstein radius is defined as the radius within which the mean convergence 111In the framework of spherically-symmetric distribution, the dimensionless surface mass density (convergence) of the lens galaxies can be written as , where is the angular radius projected to lens plane (Suyu et al., 2013).. After solving the spherical Jeans equation based on the assumption that stellar and mass distributions follow the same power law, the dynamical mass inside the aperture projected to lens plane and then scaled to the Einstein radius can be obtained as (Koopmans et al., 2005)
| (5) | |||||
The combination of the mass and will lead to the following expression (Koopmans et al., 2005)
| (6) |
where
| (7) | |||||
Note that when , the power-law profile will reduce to the well-known singular isothermal sphere (SIS) model, with the corresponding Einstein radius as (Cao et al., 2012, 2015). In our fiducial model, the average logaritmic density slope is modeled as the results from 58 SLACS strong-lens early-type galaxies with direct total-mass and stellar-velocity dispersion measurements (Koopmans et al., 2009). is the luminosity averaged line-of-sight velocity dispersion of the lens inside the aperture . More importantly, for a single system the velocity dispersion is measured within an aperture and then transformed to that within a circular aperture of radius (half the effective radius). Following the prescription of Jørgensen et al. (1995a, b), we transform the velocity dispersion measured within :
| (8) |
Finally, , , and respectively denote the angular diameter distances between the observer and the lens, the observer and the source, the lens and the source. Note that the cosmological model directly enters through these angular diameter distances, which, under a Friedman-Walker metric with null space curvature express as
| (9) |
The strong lensing cross section is related to the Einstein radius and the cosmological distances as (Treu et al., 2006).
Secondly, in order to derive the differential lensing probability, we use the empirically determined velocity-dispersion distribution function of early-type galaxies. As was pointed out in the previous analysis of strong lensing statistics (Ofek, Rix & Maoz, 2003; Cao, Zhu & Zhao, 2011), the luminosity of a galaxy has a power-law relation to its line-of-sight velocity dispersion (i.e. the Faber-Jackson relation for early-type galaxies). Therefore, the Schechter (1976) function is generalized to be a modified Schechter function (Sheth et al., 2003), which may helpfully describe the number density of galaxies with velocity dispersion lying between and :
| (10) |
where is the low-velocity power-law index, is the high-velocity exponential cut-off index, is the integrated number density of galaxies, and is the characteristic velocity dispersion. Based on a large sample of galaxies from the SDSS Data Release 5 data set, Choi et al. (2007) have measured the VDF for local early-type galaxies, which became a standard in the studies of gravitational lensing statistics. However, one should note that for a given galaxy sample used by Choi et al. (2007), the galaxy number counts start to become incomplete at low-velocity dispersions, due to the limitation of absolute magnitude. Therefore, for the parameters , , and , we will turn to the early-type VDF obtained through the powerful Monte Carlo method, based on the galaxy luminosity functions from the SDSS and intrinsic correlations between luminosity and velocity dispersion (Chae, 2010) (see Biesiada et al. (2014) for discussion about such choice in view of other data on velocity dispersion distribution functions). In analogy to and in order to comply with the previous papers (Ofek, Rix & Maoz, 2003; Matsumoto & Futamase, 2008), we also allow for evolution of the quantities and , by adopting the power-law evolution for the number density and the characteristic velocity dispersion as
| (11) | |||||
where and are constant quantities corresponds to the no evolution model (see Ofek, Rix & Maoz (2003) for more details). In this paper, we take the parameters of the power-law evolution model as , which were predicted by the semi-analytic model after Kang et al. (2005); Chae (2007).
Following the above mentioned procedure, we can compute the differential probability of the ray from the background source at with Einstein radius encountering a lens per unit redshift
| (12) |
where the normalization . In the power-law lens model, the characteristic Einstein radius is obtained from the combination of Eq. (6)-(8):
| (13) |
where is a dynamical normalization factor for non-spherical galaxies (Keeton, Kochanek, & Falco, 1998). For we assume the three dimensional shapes of lens galaxies in the combination of two equal number of extreme cases
| (14) |
where and respectively denotes the dynamical normalizations for the oblate and the prolate isothermal spheroids (Oguri et al., 2012)
| (15) | |||||
In our fiducial model, the distribution of the ellipticity is modeled as a Gaussian distribution with , which is derived from the axis ratio distributions of early-type galaxies in the SDSS survey (Bernardi et al., 2010). Finally, we obtain the integrated probability for the multiple imaging with Einstein radius due to early-type galaxies, based on which the relative probability of finding the lens at redshift for a given lens system is derived as
| (16) |
For each systems, we calculate the particular differential probability given by Eq. (16) which is normalized unity. For a statistical sample that contains multiply imaged sources, the likelihood of the observation data given the observed lens redshift is calculated as
| (17) |
where denotes the cosmological model parameters (e.g., the matter density in the Universe ) and the velocity dispersion function parameters (e.g. the characteristic velocity dispersion ). Then one can constrain the model parameters by minimizing the function given by
| (18) |
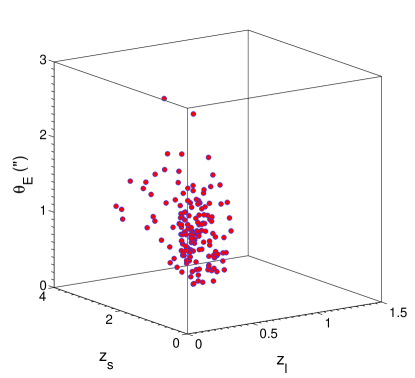
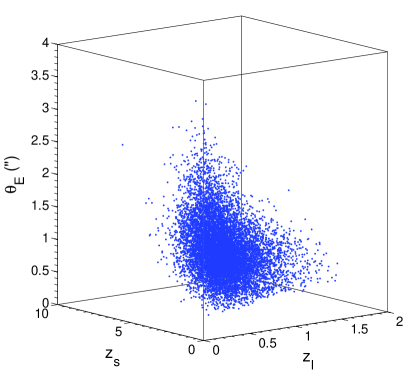
Next we will summarize the data both from Sloan Lens ACS Survey (SLACS) observations and recent large-scale observations of galaxies that will be used as the input for the statistical lensing model described above. In order to build an homogeneous galaxy sample, we limit our analysis to gravitational lenses with early-type morphology. Compared with the lensing statistics based on the angular separation distribution of the lensed images (Cao, Zhu & Zhao, 2011), the advantage of the lens redshift test lies in the fact that a lens with a large separation will not bias the final results, because is used as prior information in the calculation (see Ofek, Rix & Maoz (2003) for more details). In this paper, we use a combined sample of strong lensing systems from SLACS (97 lenses taken from Bolton et al. (2008); Auger et al. (2009); Shu et al. (2017)), the Strong Lensing Legacy Survey (SL2S) (31 lenses taken from Sonnenfeld et al. (2013a, b)), the BOSS emission-line lens survey (BELLS) (25 lenses taken from Brownstein et al. (2012)), and Lenses Structure and Dynamics (LSD) survey (5 lenses from Treu & Koopmans (2002); Koopmans & Treu (2002); Treu & Koopmans (2004)), which is the largest gravitational lens sample published in the recent work. This sample is compiled and summarized in Cao et al. (2015); Shu et al. (2017), in which all relevant information necessary to perform statistical analysis (the redshifts, aperture radius, effective radius, Einstein radius) can be found. Fig. 1 shows the scatter plot of these lensing systems.
One should note that the 158 lenses used in this work come from different surveys with vastly different selection functions, which might affect the resulting redshift distributions of the lenses. For instance, lenses from SL2S will likely miss lenses with small image separations of the lensed sources due to the seeing limit of CFHTLS (Sonnenfeld et al., 2013a, b), whereas the SLACS and BELLS sample will miss the lenses with large image separation due to the finite Sloan fiber size (Brownstein et al., 2012; Treu & Koopmans, 2004). Therefore, in order to verify the completeness of our final lens sample, we will use two additional sub-samples to account for the possible selection functions: 36 lenses from the SL2S and LSD sample (Sample A), and 122 lenses from SLACS and BELLS sample (Sample B).
3 Cosmological model and results
From the observational viewpoint, currently standard cosmological model, also known as the CDM model is the simplest one with constant dark energy density present in the form of cosmological constant. However, it is important to look into whether the modified gravity theories are indeed compatible with different kinds of currently available cosmological data. In this section, we consider the cosmological constraints on two popular cosmological models, the CDM model and the Dvali-Gabadadze-Porrati model arising from the brane world theory, which have been proposed to explain the observed cosmic acceleration. For simplicity, a flat Universe is assumed throughout the following analysis since the spatial curvature is constrained to be very close to zero with (Planck Collaboration, 2015). Note that the Hubble constant is not included as a parameter, because the dependence on is factored out in Eq. (12). In order to assess the accuracy of our results, we consider two cases of evolution models of lensing galaxies: and 222 We have also performed a sensitivity analysis through Monte Carlo simulations, in which and were respectively characterized by Gaussian distributions with 10% uncertainty. The results showed the uncertainties of VDF evolution parameters have negligible effects on the final cosmological constraints..
| Cosmological model | Data | Cosmological fit |
|---|---|---|
| CDM () | Current SGL (Full sample) | |
| () | Current SGL (Sample A) | |
| () | Current SGL (Sample B) | |
| () | Current SGL (Full sample) | |
| () | Current SGL (Sample A) | |
| () | Current SGL (Sample B) | |
| DGP () | Current SGL (Full sample) | |
| () | Current SGL (Sample A) | |
| () | Current SGL (Sample B) | |
| () | Current SGL (Full sample) | |
| () | Current SGL (Sample A) | |
| () | Current SGL (Sample B) |
3.1 The standard cosmological model (CDM)
The cosmological model containing a cosmological constant and cold dark matter (CDM) component is usually called the standard cosmological model. The unique feature of the cosmological constant is that its equation-of-state parameter . Therefore, assuming a flat Universe with negligible radiation density (), ordinary pressureless dust matter and the cosmological constant contribute to the total energy. The Friedmann equation is
| (19) |
where parameterizes the density of matter (both baryonic and non-baryonic components) in the Universe. Therefore, if spatial flatness of the FRW metric is assumed, this model has only one independent parameter ().
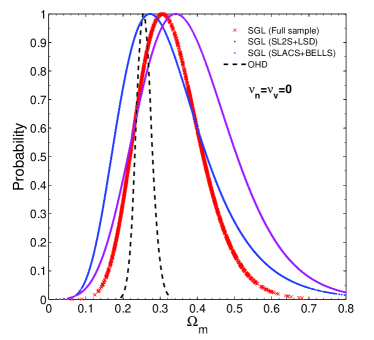
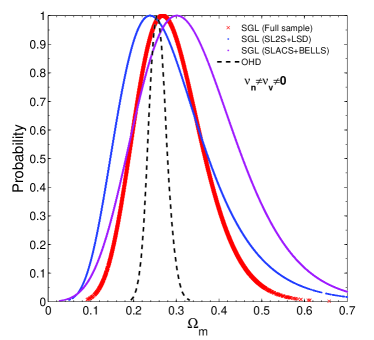
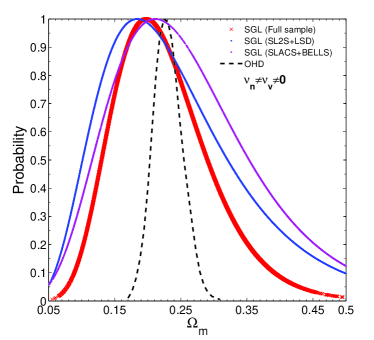
By fitting the CDM model to the current 158 strong lensing systems, we get in the case of no evolution model (), which is well consistent with the results given by the recent data release of Planck observations (Planck Collaboration, 2015). One can clearly see that the currently compiled strong lensing data improves the constraints on model parameters significantly. Considering Sample A and Sample B, the likelihood is maximized at and with no redshift evolution. More importantly, we find that different galaxy evolution models will slightly affect the constraints on the model parameter: the evolution of the quantities and will shift the the matter density parameter to a lower value. For the three strong lensing samples defined in Section 2, the best-fitted values and the 1 limits are (Full sample), (Sample A), and (Sample B) using the power-law evolution model after Kang et al. (2005). These results are shown in Fig. 2 and Table 1. We remark here that our results strongly suggest that larger and more accurate sample of the strong lensing data can become an important complementary probe to test the the properties of dark energy. This conclusion is strengthened by the comparison of our cosmological fits from the redshift distribution of a larger sample and those from the absolute lensing probability for a smaller sample of optical and radio lenses () (Chiba & Yoshii, 1999).
Another important issue is the comparison of our cosmological results with earlier studies done using other alternative probes. We turn to the observational Hubble parameter data (OHD) to verify this point. The Hubble parameter at 31 different redshifts was obtained from the differential ages of passively evolving galaxies, while 10 more Hubble parameter data were determined recently from the radial BAO size method (see Qi et al. (2018) for more details). With the latest OHD data comprising 41 data points, we obtain the best-fit values of the cosmological parameters in the flat CDM model: and at 68.3% confidence level. For a good comparison, fits on the matter density parameter are also plotted in Fig. 2 (with Hubble constant marginalized). One may observe that the results obtained from the lens redshift test are well consistent with the OHD fits, although larger uncertainties may arise due to possible evolution of the quantities and . Such excellent consistency could also be clearly seen through the comparison with WMAP 5-year data combined with BAO and SN Union data sets (Komatsu et al., 2009), in which the best-fit parameters are given as and for the flat CDM model. In contrast, recent CMB anisotropy measurements by Planck data favors a higher value of and thus a larger matter density in the CDM model. Based on the full-mission Planck observations of temperature and polarization anisotropies of the CMB radiation, Planck Collaboration (2015) gave the best-fit parameter: and (Planck Collaboration, 2015). Let us note that the matter density parameter inferred from CMB and OHD data are highly dependent on the value of the Hubble constant, considering the well known strong degeneracy between and . Therefore independent measurement of from strong lensing statistics could be expected and indeed is revealed here.
3.2 Dvali-Gabadadze-Porrati model (DGP)
This DGP model is one of the simplest modified gravity models based on the concept of brane world theory, in which gravity leaks out into the bulk above a certain cosmological scale . This provides a mechanism for the accelerated expansion without introducing a repulsive-gravity fluid (Dvali et al., 2000). In the framework of a spatially flat DGP model, the Friedmann equation is modified as
| (20) |
where is the length at which the leaking occurs. The above equation can be directly rewritten to generate the expansion rate
| (21) |
where an adimensional parameter is associated with the cosmological scale through . It is straightforward to check the validity of the relation in the flat DGP model, which indicates that there is only one free parameter in this model ().
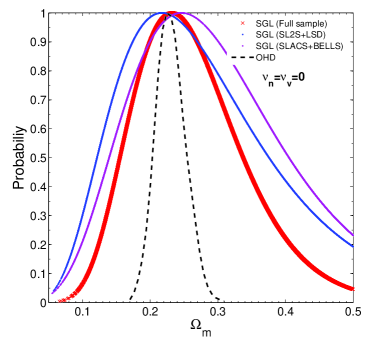
Working on the DGP model, we obtain the fitting results from two cases of evolution models of lensing galaxies, which are displayed in Fig. 3 and Table 1. The marginalized 1 constraints of the parameters are: with no redshift evolution and with redshift evolution. In both cases, the strong lensing statistics imposes a strong bound on , which is similar to what was obtained when the dark energy models are explored with the ratio of (angular-diameter) distances between lens and source and between observer and lens (Cao et al., 2012, 2015). Working on the two sub-samples, the best-fit values of the parameters are: (with no redshift evolution), (with redshift evolution) for Sample A, and (with no redshift evolution), (with redshift evolution) for Sample B. More interestingly, we also note the DGP model, which has already been ruled out observationally considering the precision cosmological observational data (Fang et al., 2008; Durrer & Maartens, 2010; Maartens & Koyama, 2010), seems to be a representative set instead of viable candidates for dark energy. Such tendency is also strongly hinted by the fitting results derived from the lens redshift test and the latest Hubble parameter data (see Fig. 3).
Now it is worthwhile to make some comments on the results obtained above. Firstly, comparing to the previous analysis with a smaller sample (Cao & Zhu, 2012; Cao et al., 2012), our results strongly suggest that larger and more accurate sample of SGL data can become an important complementary probe to other standard ruler data. More importantly, the advantage of our method lies in the benefit of being independent of the Hubble constant. Consequently, and its uncertainty do not influence the final cosmological results. Secondly, in the framework of two cosmologies classified into different categories, the null hypothesis of a dominant matter density () is excluded at large confidence level (). Therefore, our results has provided independent evidence for the accelerated expansion of the Universe, which is the most unambiguous result of the current dataset. Thirdly, considering the general concern that strong gravitational lenses could be a biased sample of galaxies, we note that systematic errors due to sample incompleteness do not exceed on the matter density parameter. Finally, although constraints on the hierarchical models of galaxy evolution is beyond the scope of this work, simple evolution of the velocity dispersion function does not significantly affect the lensing statistics and thus the derivation of cosmological information. This conclusion agrees very well with the previous studies on lensing statistics of early-type galaxies (Chae, 2003; Mitchell et al., 2005; Capelo & Natarajan, 2007).
3.3 Cosmology from future LSST observations
The lensing constraints on the cosmological parameters are already quite competitive compared with those from other methods. However, they still suffer from the small number of lenses in our statistical sample. The redshift distribution test, with larger gravitational lensing samples from future wide-field surveys, could be helpful for advancing such applications. Following the recent analysis (Kuhlen et al., 2004; Marshall et al., 2005), benefit from the improved depth, area and resolution, the next generation wide and deep sky surveys will increase the current galactic-scale lens sample sizes by orders of magnitude in the near future. Recent analytical work has forecast the number of galactic-scale lenses to be discovered in the forthcoming photometric surveys (Collett, 2015). With a large increase to the known strong lens population, current work could be extended to a new regime: in the framework of lens redshift test, what kind of cosmological results one could obtain from discoverable lens population in the forthcoming Large Synoptic Survey Telescope (LSST) survey.
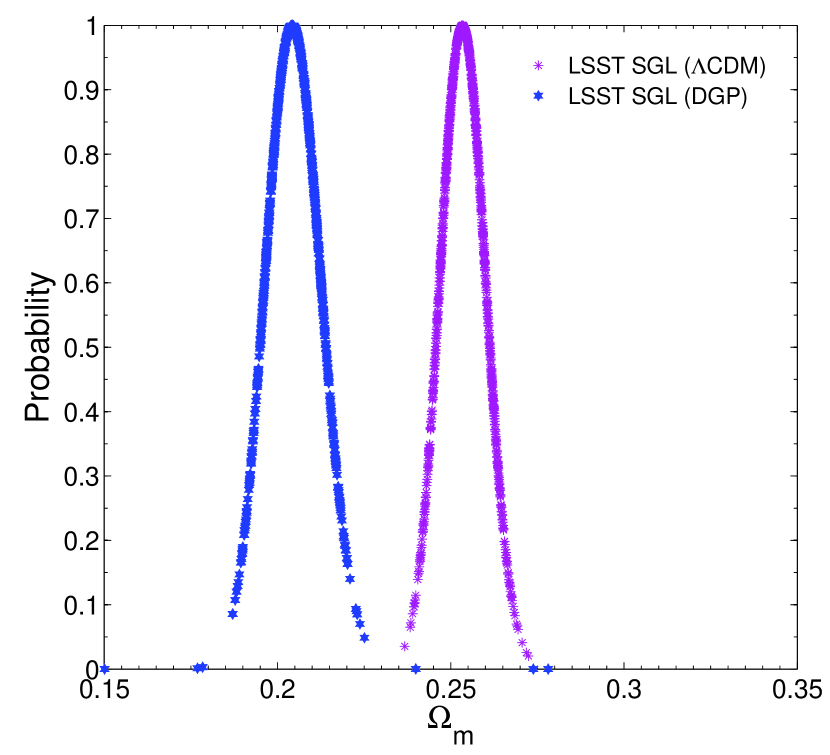
Using the simulation programs publicly available 333github.com/tcollett/LensPop, we obtain 10000 strong lensing systems on the base of realistic population models of elliptical galaxies acting as lenses, whose mass distribution is approximated by the singular isothermal ellipsoids. Following the assumptions underlying the simulation, we take the VDF of elliptical galaxies in the local Universe derived from the SDSS Data Release 5 (Choi et al., 2007). Meanwhile, in our simulation we assume that neither the shape nor the normalization of this function vary with redshift, which is well consistent with the previous studies on lensing statistics (Chae, 2003; Mitchell et al., 2005; Capelo & Natarajan, 2007) and the recent observations of Bezanson et al. (2011). Fig. 4 shows the scatter plot of the simulated lensing systems, from which one can see the LSST lenses resulted in a fair coverage of lenses and sources redshifts.
Then we assess the likelihood of the observed lens redshift from the strong lensing data, with the results summarized in Fig. 5. The effectiveness of of our method could be seen from the discussion of this question: Is it possible to achieve a stringent measurement of the present value of the matter density parameter? As is clearly shown in Fig. 5, in the framework of two different cosmological models, one can expect the matter density parameter to be estimated with the precision of . Therefore, with about 10000 discoverable SGL systems in forthcoming surveys, the lens redshift test places more stringent constraints on the matter density parameter, compared with the combined results from Planck temperature and lensing data () (Planck Collaboration, 2015). Such conclusion could also be obtained from the comparison between our results and those using the future baryon acoustic oscillation (BAO) and supernova observations of the Joint Dark Energy Mission (JDEM) project in the low redshift region (Zhao et al., 2011). Therefore, we have added some support to the argument that with more detectable galactic-scale lenses from the forthcoming surveys, the lens redshift distribution can eventually be used to carry out stringent tests on various cosmological models. However, one should note that sample incompleteness still could constitute an important source of systematic errors in the future, i.e., the current systematics of 0.1 might dominate over the statistical uncertainty of the matter density parameter. Therefore, in order to improve constraints on cosmological parameters, our findings strongly motivate the future use of a larger sample of gravitational lenses in the forthcoming surveys, for which completeness is homogenous as a function of the lensed image separation and the lens redshift (Capelo & Natarajan, 2007).
| Galaxy evolution model | Data | Lening based velocity dispersion (km/s) | Ratio |
|---|---|---|---|
| Current SGL (Full sample) | |||
| Current SGL (Sample A) | |||
| Current SGL (Sample B) | |||
| Current SGL (Full sample) | |||
| Current SGL (Sample A) | |||
| Current SGL (Sample B) |
4 Constraints on lensing based characteristic velocity dispersion
The velocity dispersion functions (VDF) of early-type galaxies, which can be inferred from early-type luminosity functions via an adopted power-law relation between luminosity and velocity dispersion (the Faber-Jackson relation), are crucial observables to provide powerful constraints on predictions of models of galaxy formation and evolution. On the side of the measurement of VDF, the first direct measurement of the VDF of early-type galaxies was made by Sheth et al. (2003), based on Sloan Digital Sky Survey (SDSS) DR1 of 9000 early-type galaxies (Bernardi et al., 2003). Then Choi et al. (2007) obtained a new VDF based on the much larger SDSS DR5, which is quite different from the DR1 VDF in the characteristic velocity dispersion at 1. A possible inconsistency between the two VDF measurements can be largely attributed to the improved galaxy classification scheme, making use of a SDSS color versus color gradient space (Park & Choi, 2005).
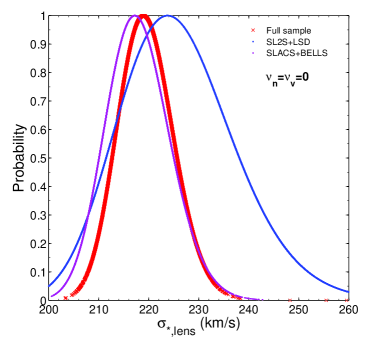
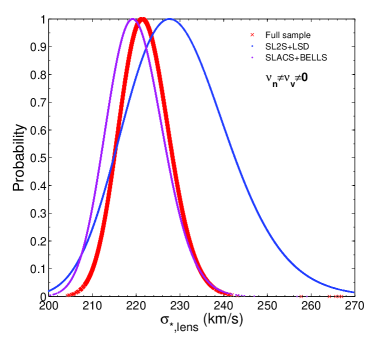
In this work, we consider constraining a model VDF of early-type galaxies using the statistics of strong gravitational lensing. More specifically, the distribution of lens redshift is mainly applied to place limits on the characteristic velocity dispersion. Moreover, considering the strong degeneracy between the shape of the VDF (, ) and the characteristic velocity dispersion () (Chae et al., 2005), the focus of this work is: What would be the constrained value of if and are fixed by a stellar VDF? We obtain a solely lensing-based VDF assuming no and passive evolution of early-type galaxies, which will then be compared with the measured VDF in the local universe. Fig. 6 shows the fits on for the case of fixing and by the type-specific VDF (Chae, 2010): km/s (with no redshift evolution), km/s (with redshift evolution) for the full sample, km/s (with no redshift evolution), km/s (with redshift evolution) for Sample A, and km/s (with no redshift evolution), km/s (with redshift evolution) for Sample B. Our results demonstrate the strong consistency between the lensing-based value of and the corresponding stellar values for the adopted stellar VDF, which, to some extent agrees with the velocity dispersion profiles of a sample of 37 elliptical galaxies using a Jaffe stellar density profile and the SIS model for the total mass distribution (Kochanek, 1994).
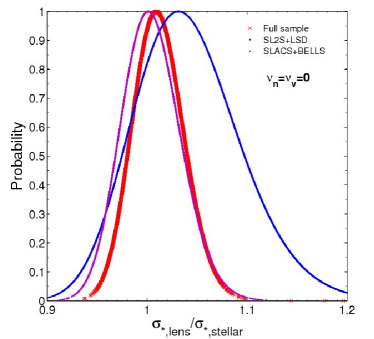
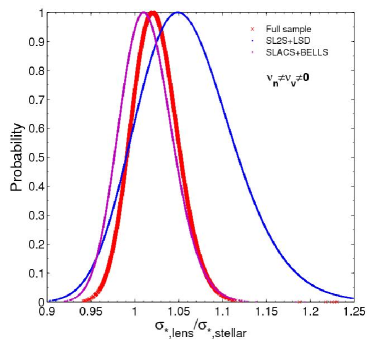
Let us note here that the velocity dispersion of the mass distribution and the observed stellar velocity dispersion need not be the same. We adopt a parameter that relates the velocity dispersion and the spectroscopically measured central stellar dispersion. Based on the three different strong lensing samples, we obtain the following best-fitting values and corresponding 68% confidence level uncertainties: (with no redshift evolution), (with redshift evolution) for the full sample, (with no redshift evolution), (with redshift evolution) for Sample A, and (with no redshift evolution), (with redshift evolution) for Sample B. It is apparent that for each case, the consistency between the velocity dispersion for our power-law lens model and the spectroscopically measured central stellar dispersion is supported within C.L. However, the constrained results on parameter are still particularly interesting. What would be an appropriate interpretation of such possible disagreement between and ? Note that the real early-type galaxies can be divided into the luminous stellar component and the extended dark matter halo component. Based on the X-ray properties of the first X-ray-complete optically selected sample of elliptical galaxies, White & Davis (1996) discussed the kinetic temperature of the gas and the stars. The derived results and other independent results (White & Davis, 1998; Loewenstein & White, 1999) indicate that dark matter halos are dynamically hotter than the luminous stars, which strongly implies a greater velocity dispersion of dark matter than the visible stars. More recently, Treu & Koopmans (2004) used a sample of five individual lens systems to determine the ratio of the SIE velocity dispersion to the stellar velocity dispersion, producing a mean value of from optical spectroscopic observation of the lensing galaxies. Therefore, our results presented in Fig. 7 and Table 2 robustly indicate the possible presence of dark matter, in the form of a mass component with velocity dispersion greater than stellar velocity dispersion.
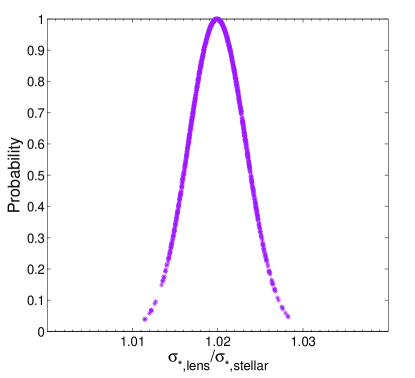
Finally, we illustrate what kind of result could be obtained from the future data in the forthcoming LSST survey. The resulting constraint on the parameter becomes , with the posterior probability density shown in Fig. 8. It can be clearly seen that much more stringent constraints would be achieved, and one can expect to be estimated with precision. Therefore, the lens redshift test, when applied to larger samples of strong lensing systems, can provide an independent and alternative experiment to test the global properties of early-type galaxies at much higher accuracy.
5 Conclusion and discussion
In this work, based on a well-defined sample of lensing, elliptical galaxies drawn from a large catalog of 158 gravitational lenses, we use the statistical properties of the strong lens sample (i.e., the redshift distribution of lenses) to constrain the cosmological parameters and the velocity dispersion functions (VDF) of early-type galaxies. In order to assess the accuracy of the results, two cases of VDF evolution models of lensing galaxies are taken into account. Moreover, we have quantified the ability of future measurements of strong lensing systems from the forthcoming Large Synoptic Survey Telescope (LSST) survey, which encourages us to probe cosmological parameters and early-type galaxy properties at much higher accuracy. Here we summarize our main conclusions in more detail:
-
•
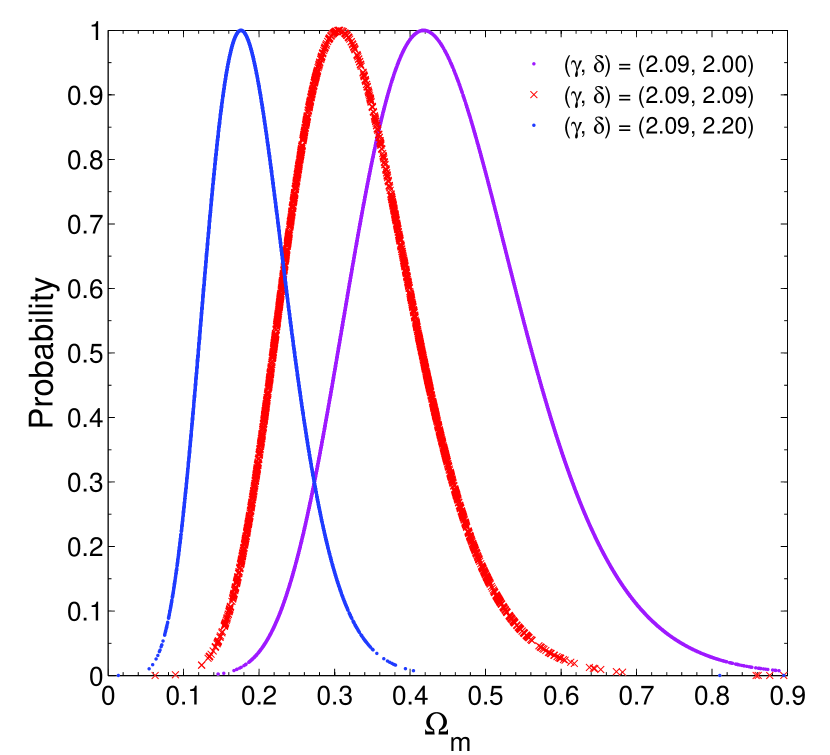
Firstly of all, with the current catalog of 158 gravitational lenses, we evaluate the power of direct measurements of lens redshift distribution on constraining two popular cosmological models. For the concordance CDM model, we have found with no redshift evolution and with redshift evolution. For the DGP brane-world scenario, the current strong lensing systems provide the constraints on the matter density parameter as with no redshift evolution and with redshift evolution. More importantly, the DGP model, which has already been ruled out observationally considering the precision cosmological observational data, seems to be a representative set instead of viable candidates for dark energy. Two additional sub-samples are also included to account for possible selection effect introduced by the detectability of lens galaxies, which confirms that systematic errors due to sample selection are not larger than statistical uncertainties. Whereas, there are several sources of systematics we do not consider in this paper. For instance, although the average total power-law density slope of observed early-type galaxies has been found to be close to isothermal within a few effective radii (Wang et al., 2018), the scatter of other galaxy structure parameters, especially those characterizing the stellar distribution in the lensing galaxies, could be an important source of systematic errors on the final results. An influential paper by Hernquist (1990) suggested that a brand new Hernquist profile can provide a good approximation to the luminosity distribution of spherical galaxies. Such density profile, which resembles an elliptical galaxy or dark matter halo with at small radii and at large radii, has found widespread astrophysical applications in the literature (Barnes & Hernquist, 1992; Lowing et al., 2011; Ngan et al., 2015). Therefore, we perform a sensitivity analysis to investigate how the cosmological constraint on flat CDM is altered by the luminosity density profile. In the framework of a general mass model for the total-mass density and luminosity density (Eq. (2)), the luminosity-density slope is varying as 2.00, 2.09, and 2.20, while total-mass density parameter is fixed at its best-fit value () from the total-mass and stellar-velocity dispersion measurements of a sample of SLACS lenses (Koopmans et al., 2009). In general, one can see from Fig. 9 that the derived value of is sensitive to the adopted luminosity density profiles, i.e., a steeper stellar density profile in the early-type galaxies will shift the matter density parameter to a relatively lower value. This illustrates the importance of using auxiliary data to improve constraints on the luminosity density parameter, with future high-quality integral field unit (IFU) data (Barnabè et al., 2013).
-
•
The advantage of our method lies in the benefit of being independent of the Hubble constant. Therefore independent measurement of from strong lensing statistics could be expected and indeed is revealed here. More interestingly, one may also observe that simple VDF evolution does not significantly affect the lensing statistics and thus the derivation of cosmological information, if all galaxies are of early type. In the framework of two cosmologies classified into different categories, the null hypothesis of a vanishing dark energy density is excluded at large confidence level (). Therefore, our results has provided independent evidence for the accelerated expansion of the Universe, which is the most unambiguous result of the current dataset.
-
•
Moreover, we have quantified the ability of a future measurements of SGL from the forthcoming LSST survey, which may detect tens of thousands of lenses for the most optimistic scenario (Collett, 2015). In the framework of the two cosmological models, one can expect to be estimated with the precision of . Therefore, with about 10000 discoverable SGL systems in forthcoming surveys, the lens redshift test places more stringent constraints on the matter density parameter, compared with the combined results from Planck temperature and lensing data () (Planck Collaboration, 2015). Therefore, we have added some support to the argument that the lens redshift distribution, with more detectable galactic-scale lenses from the forthcoming surveys, can eventually be used to carry out stringent tests on various cosmological models.
-
•
Finally, the currently available lens redshift distribution, which constitutes a promising new cosmic tracer, may also allow us to obtain stringent constraints on the global properties of early-type galaxies. We use mainly the distribution of lens redshift to constrain the characteristic velocity dispersion (with fixed shape of the velocity function), and thus obtain a solely lensing-based VDF for . Our results demonstrate the strong consistency between the lensing-based value of and the corresponding stellar value for the adopted stellar VDF in the local universe. Furthermore, a parameter is adopted to quantify the relation between the two velocity dispersions, which is fit to (with no redshift evolution) and (with redshift evolution) from the full SGL sample. Therefore, our results agrees with the respective values of derived in the previous studies, which robustly indicates the possible presence of dark matter halos in the early-type galaxies, with velocity dispersion greater than stellar velocity dispersion. More importantly, this statistical lensing formalism, when applied to larger samples of strong lensing systems, can provide much more stringent constraints and one can expect to be estimated with precision.
Acknowledgments
This work was supported by National Key R&D Program of China No. 2017YFA0402600; the National Natural Science Foundation of China under Grants Nos. 11705107, 11475108, 11503001, 11373014, 11073005 and 11690023; Beijing Talents Fund of Organization Department of Beijing Municipal Committee of the CPC; and the Opening Project of Key Laboratory of Computational Astrophysics, National Astronomical Observatories, Chinese Academy of Sciences. Y. Pan was supported by the Scientific and Technological Research Program of Chongqing Municipal Education Commission (Grant No KJ1500414); and Chongqing Municipal Science and Technology Commission Fund (cstc2015jcyjA00044, and cstc2018jcyjAX0192).
References
- Riess et al. (1998) Riess, A. G., et al. 1998, AJ, 116, 1009
- Perlmutter et al. (1999) Perlmutter, S., et al. 1999, ApJ, 517, 565
- Spergel et al. (2003) Spergel, D. N., et al. 2003, ApJS, 148, 175
- Eisenstein et al. (2005) Eisenstein, D. J., et al. 2005, ApJ, 633, 560
- Ellis & Buchert (2005) Ellis, G. F. R. & Buchert, T. 2005, PLA, 347, 38
- Wiltshire (2007) Wiltshire, D. 2007, PRL, 99, 251101
- Dvali et al. (2000) Dvali, G., Gabadadze, G., & Porrati, M. 2000, PLB, 485, 208
- Hinshaw et al. (2009) Hinshaw, G., et al. 2009, ApJS, 180, 225
- Biesiada, Piórkowska, & Malec (2010) Biesiada, M., Piórkowska, A., & Malec, B. 2010, MNRAS, 406, 1055
- Allen et al. (2008) Allen, S. W., et al. 2008, MNRAS, 383, 879
- De Filippis et al. (2005) De Filippis, E., Sereno, M., Bautz, W., Longo, G. 2005, ApJ, 625, 108
- Cao et al. (2017a) Cao, S., Biesiada, M., Jackson, J., et al. 2017, JCAP, 02, 012
- Cao et al. (2017b) Cao, S., et al. 2017b, A&A, 606, A15
- Cao et al. (2015) Cao, S., et al. 2015, ApJ, 806, 66
- Shu et al. (2017) Shu, Y., et al. 2017, arXiv:1711.00072
- Li et al. (2016) Li, X. L., et al. 2016, RAA, 16, 84
- Ofek, Rix & Maoz (2003) Ofek, E. O., Rix, H.-W., & Maoz, D. 2003, MNRAS, 343, 639
- Kochanek (1992) Kochanek, C. S. 1992, ApJ, 384, 1
- Helbig & Kayser (1996) Helbig, P., & Kayser, R. 1996, A&A, 308, 359
- Kochanek (1996a) Kochanek, C. S. 1996a, ApJ, 466, 638
- Cao, Zhu & Zhao (2011) Cao, S., Zhu, Z.-H., & Zhao, R. 2011, PRD, 84, 023005
- Cao & Zhu (2012) Cao, S., & Zhu, Z.-H. 2012, A&A, 538, A43
- Chae (2007) Chae, K.-H. 2007, ApJL, 658, L71
- Chae et al. (2005) Chae, K.-H. 2005, ApJ, 630, 764
- Turner et al. (1984) Turner, E. L., Ostriker, J. P., Gott, J. R., III, 1984, ApJ, 284, 1
- Treu et al. (2006) Treu, T., et al. 2006b, ApJ, 650, 1219
- Koopmans et al. (2005) Koopmans, L.V.E. 2005, Proceedings of XXIst IAP Colloquium, “Mass Profiles & Shapes of Cosmological Structures” (Paris, 4-9 July 2005), eds G. A. Mamon, F. Combes, C. Deffayet, B. Fort (Paris: EDP Sciences) [astro-ph/0511121]
- Suyu et al. (2013) Suyu, S. H., et al. 2013, ApJ, 766, 70
- Cao et al. (2012) Cao, S., et al. 2012, JCAP, 03, 016
- Koopmans et al. (2009) Koopmans, L.V.E., et al. 2009, ApJL, 703, L51
- Jørgensen et al. (1995a) Jørgensen, I., Franx, M. & Kjærgard, P. 1995a, MNRAS, 273, 1097
- Jørgensen et al. (1995b) Jørgensen, I., Franx, M. & Kjærgard, P. 1995b, MNRAS, 276, 1341
- Sheth et al. (2003) Sheth, R. K., et al. 2003, ApJ, 594, 225
- Choi et al. (2007) Choi, Y.-Y., Park, C., & Vogeley, M. S. 2007, ApJ, 884, 897
- Chae (2010) Chae, K.-H. 2010, MNRAS, 402, 2031
- Biesiada et al. (2014) Biesiada, M., et al. 2014, JCAP, 10, 080
- Matsumoto & Futamase (2008) Matsumoto, A. & Futamase, T. 2008, MNRAS, 384, 843
- Kang et al. (2005) Kang, X., Jing, Y. P., Mo, H. J., & Börner, G. 2005, ApJ, 631, 21
- Keeton, Kochanek, & Falco (1998) Keeton, C. R., Kochanek, C. S., & Falco, E. E. 1998, ApJ, 509, 561
- Oguri et al. (2012) Oguri, M., et al. 2012, arXiv:1203.1088
- Bernardi et al. (2010) Bernardi, M., Shankar, F., Hyde, J. B., Mei, S., Marulli, F., & Sheth, R. K. 2010, MNRAS, 404, 2087
- Bolton et al. (2008) Bolton, A. S., et al. 2008, ApJ, 682, 964
- Auger et al. (2009) Auger, M. W., et al. 2009, ApJ, 105, 1099
- Sonnenfeld et al. (2013a) Sonnenfeld, A., Gavazzi, R., Suyu, S.H., Treu, T., Marshall, P.J. 2013a, ApJ, 777, 97
- Sonnenfeld et al. (2013b) Sonnenfeld, A., Treu, T., Gavazzi, R., Suyu, S.H., Marshall, P.J., Auger, M.W., Nipoti, C., 2013b, ApJ, 777, 98
- Brownstein et al. (2012) Brownstein, et al. 2012, ApJ, 744, 41
- Treu & Koopmans (2002) Treu, T., & Koopmans, L.V.E. 2002, ApJ, 575, 87
- Koopmans & Treu (2002) Koopmans, L.V.E, & Treu, T. 2002, ApJ, 583, 606
- Treu & Koopmans (2004) Treu, T., & Koopmans, L. V. E. 2004, ApJ, 611, 739
- Planck Collaboration (2015) Ade, P.A.R., et al. [Planck Collaboration] 2016, A&A, 594, A13
- Chiba & Yoshii (1999) Chiba, M., & Yoshii, Y. 1999, ApJ, 510, 42
- Qi et al. (2018) Qi, J.-Z., et al. 2018, RAA, 18, 66
- Komatsu et al. (2009) Komatsu, E., et al. [WMAP Collaboration], 2009, ApJS, 180, 330
- Fang et al. (2008) Fang, W., Wang, S., Hu, W., Haiman, Z., Hui, L., & May, M. 2008, PRD, 78, 103509
- Durrer & Maartens (2010) Durrer, R., & Maartens, R. 2010, ”Dark Energy: Observational & Theoretical Approaches”, ed. P Ruiz-Lapuente (Cambridge UP), pp 48-91 [arXiv:0811.4132]
- Maartens & Koyama (2010) Maartens, R., & Koyama, K. 2010, Living Rev. Relativity, 13, 5
- Chae (2003) Chae, K.-H. 2003, MNRAS, 346, 746
- Mitchell et al. (2005) Mitchell, J. L., Keeton, C. R., Frieman, J. A., & Sheth, R. K. 2005, ApJ, 622, 81
- Capelo & Natarajan (2007) Capelo, P. R., & Natarajan, P. 2007, NJPh, 9, 445
- Kuhlen et al. (2004) Kuhlen, M., Keeton, C. R., & Madau, P. 2004, ApJ, 601, 104
- Marshall et al. (2005) Marshall, P., Blandford, R., & Sako, M. 2005, NAR, 49, 387
- Collett (2015) Collett, T. E. 2015, arXiv:1507.02657
- Bezanson et al. (2011) Bezanson, R., van Dokkum, P. G., Franx, M., et al. 2011, ApJ, 737, L31
- Zhao et al. (2011) Zhao, W., et al. 2011, PRD, 83, 023005
- Bernardi et al. (2003) Bernardi, M., et al. 2003, AJ, 125, 1817
- Park & Choi (2005) Park, C., & Choi, Y.-Y. 2005, ApJ, 635, L29
- Kochanek (1994) Kochanek, C. S., 1994, ApJ, 436, 56
- White & Davis (1996) White, R. E., & Davis, D. S. 1996, American Astronomical Society Meeting, 28, 1323
- White & Davis (1998) White, R. E., III, & Davis, D. S. 1998, in ASP Conf. Ser. 136, Galactic Halos, ed. D. Zaritsky (San Francisco: ASP), 299
- Loewenstein & White (1999) Loewenstein, M., & White, R. E., III, 1999, ApJ, 518, 50
- Wang et al. (2018) Wang, Y. C., et al. 2018, arXiv:1811.06545v1
- Hernquist (1990) Hernquist, L. 1990, ApJ, 356, 359
- Barnes & Hernquist (1992) Barnes, J. E. & Hernquist, L. 1992, ARA&A, 30, 705
- Lowing et al. (2011) Lowing, B., Jenkins, A., Eke, V., & Frenk, C. 2011, MNRAS, 416, 2697
- Ngan et al. (2015) Ngan, W., et al. 2015, ApJ, 803, 75
- Barnabè et al. (2013) Barnabè, M., et al. 2013, MNRAS, 436, 253