Trigonometric Parallaxes of Star Forming Regions Beyond the Tangent Point of the Sagittarius Spiral Arm
Abstract
As part of the BeSSeL Survey, we report trigonometric parallaxes and proper motions of molecular maser sources associated with 13 distant high mass star forming regions in the Sagittarius spiral arm of the Milky Way. In particular, we obtain improved parallax distance estimates for three well studied regions: kpc for M17, kpc for W51, and kpc for GAL 045.5+00.0. Peculiar motions for all but one source are less than 20 km s-1. We fit a log-periodic spiral to the locations and estimate an average pitch angle of . We find that the section of the arm beyond the tangent point in the first quadrant of the Milky Way appears 15 pc below the IAU-defined Galactic plane.
1 Introduction
Trigonometric parallaxes for molecular masers associated with high mass star forming regions (HMSFRs) from the Bar and Spiral Structure Legacy (BeSSeL) Survey and the VLBI Exploration of Radio Astrometry (VERA) project are accurately tracing the spiral structure of the Milky Way. As of 2015, over 100 parallaxes had been published (Reid et al., 2014; Honma et al., 2015). These contained 18 parallaxes for sources in the Sagittarius spiral arm, most of which were located closer to the Sun than the arm’s tangent point at 49∘ and a distance of kpc (Wu et al., 2014). Beyond the tangent point, only four parallax measurements had been made, and those tended to have large uncertainties (1 kpc). With the aim of better constraining the structure of the “far” side of the Sagittarius arm (Sgr Far, i.e., beyond the tangent point), we measured parallaxes of 13 additional maser sources. In Section 2 we describe the observations and data analysis. Parallaxes and proper motions are presented in Section 3. We discuss how sources were assigned to the Sgr Far arm in Section 4. The geometry and kinematics of the arm are discussed in Section 5 and 6, and we summarize our conclusions in Section 7.
2 Observations and Data Analysis
Between 2012 and 2015, we conducted parallax observations of eleven 6.7-GHz methanol and two 22-GHz water masers in the Sag Far arm segment using the National Radio Astronomy Observatory’s111The National Radio Astronomy Observatory is a facility of the National Science Foundation operated under cooperative agreement by Associated Universities, Inc. Very Long Baseline Array (VLBA). Generally, three masers nearby on the sky were observed within the same seven-hour track. The dates of the observations are listed in Table A.1, and coordinates of masers and background quasars are presented in Table A.2.
The observations used the same equipment setup and calibration procedures described by Xu et al. (2016). The data were correlated with the DiFX222DiFX, a software correlator for VLBI, is developed as part of the Australian Major National Research Facilities Programme by the Swinburne University of Technology and operated under licence. software correlator (Deller et al., 2007) at the VLBA correlation facility in Socorro, NM. Continuum emissions were recorded with four adjacent dual-circular polarization intermediate frequency (IF) bands of 16 MHz and correlated with 32 channels per IF. The maser line emissions were set at band center of the second or third IF and were correlated with 2000 and 4000 spectral channels for BR149 and BR198 observations, respectively, yielding velocity channel spacings of 0.36 and 0.18 km s-1 for the 6.7-GHz masers and 0.11 km s-1 for the 22 GHz masers.
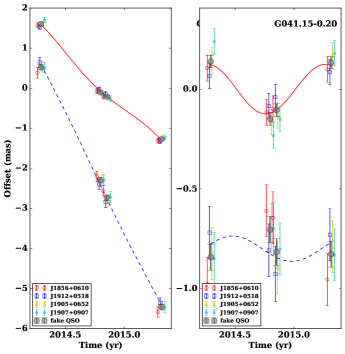
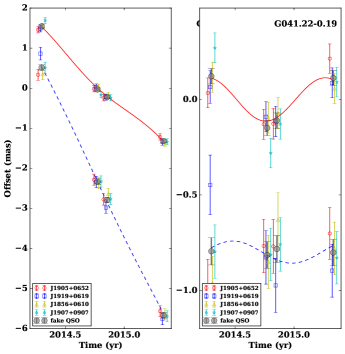
Generally, the channel with the strongest maser emission was selected as the interferometer phase reference used to calibrate both the maser and background quasar data. For G041.1500.20 and G041.2200.19, whose background quasars (J1907+0907, J1919+0619) were strong enough to fringe-fit delays with precision better than 100 ps, we performed an additional calibration to remove residual (assumed dispersive) delays before phase referencing. After calibration, images of continuum emission of the quasars and cubes of maser-line emission were produced with AIPS task IMAGR. The task JMFIT was used to fit two-dimensional Gaussian brightness distributions to compact emission peaks, yielding positions of maser spots and background quasars.
3 Parallax Estimation
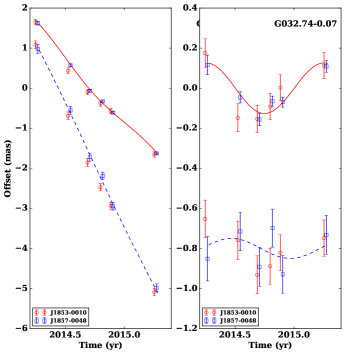
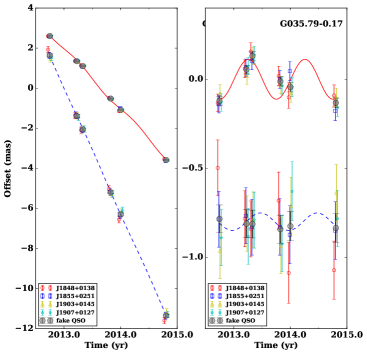
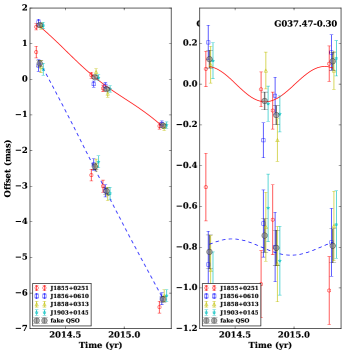
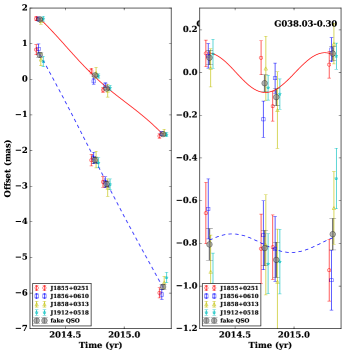
For 22-GHz water masers, fitting parallax and proper motion of the masers (relative to background quasars) is straightforward and has been discussed in detail in Reid et al. (2009a). However, at the lower observing frequency of the 6.7 GHz methanol masers, the effects of unmodeled ionospheric “wedges” above individual antennas can result in systematic position shifts across the sky (relative to different quasars), complicating the parallax estimation. Reid et al. (2017) discuss this problem in detail and present a strategy to minimize the effects on parallax estimates. This involves a two-step method of, first, using the relative position data for multiple quasars to generate an “artificial quasar” at the location of the target maser and, second, fitting parallax and proper motion parameters to the artificial quasar data. While this technique improves parallax accuracy, compared to averaging parallax results for each quasar, with our typical 4-epoch data it yielded poor estimates of the parallax uncertainty.
Since the publication of Reid et al. (2017), we developed a better approach that preserves the accuracy of the artificial quasar method, while improving the uncertainty estimates. In a single step, we modeled the positional data of a maser spot relative to multiple quasars at epoch as the sum of the maser’s parallax and proper motion and a planar “tilt,” owing to ionospheric wedges, of the quasar positions about the maser position:
| (1) |
In Eq. 1, is the -component of the parallax shift; and are constant offsets of maser spot, , and QSO, , from the position used in correlation; is the -component of maser spot position shifted by proper motion; is the -position shift owing to an ionospheric wedge (“slope” in mas deg-1) in the -direction times the -component of the separation between the maser and QSO (in deg); is the -position shift owing to an ionospheric wedge in the -direction times the -component of the separation between the maser and QSO at epoch . The offset of one maser spot was set to zero and held constant, since one cannot solve for all terms with relative position information. There is an analogous equation that holds for the -coordinate.
We used a Markov chain Monte Carlo approach to generate probability distribution functions for all parameters, varying all parameters simultaneously, and then fitted the marginalized distribution functions to obtain the parallaxes and proper motion values given in Table Trigonometric Parallaxes of Star Forming Regions Beyond the Tangent Point of the Sagittarius Spiral Arm. Typical 6.7 GHz maser parallax uncertainties are mas, which correspond to kpc uncertainty at a distance of 8 kpc, which is characteristic of our sources past the tangent point of the Sagittarius arm.
Regarding G052.10+1.04, Oh et al. (2010) reported a parallax of 0.2510.036 mas measured at 22 GHz by the VERA project, whereas our 6.7-GHz data yields a parallax of 0.1620.013 mas. Formally, the parallax difference has tension. However, we note that Oh et al. (2010) fitted the parallax for G052.10+1.04 by combining four maser spots, implicitly assuming the position differences of these maser spots with respect to their reference QSO are uncorrelated. This gives an optimistic parallax uncertainty, since atmospheric delay residuals between the maser and the QSO, which are common to all maser spots, usually dominate systematic uncertainties. BeSSeL Survey results generally allow for correlated parallaxes among maser spots, as we conservatively inflate the formal uncertainty by , where is number of spots used for parallax fitting. Doing this for the VERA parallax would give an uncertainty of mas, making these two parallaxes statistically consistent at the level. Then combining VERA and BeSSeL measurements yields a parallax of 0.1650.013 mas.
For G043.890.78, our 6.7-GHz data yields a parallax of 0.1440.017 mas, and combining this with the 22 GHz parallax of 0.1210.020 mas of Wu et al. (2014) yields a variance-weighted average parallax of 0.1340.013 mas. Rather than averaging the proper motions from the two maser species, we adopt the motion of the 6.7 GHz methanol masers as the best estimate of the exciting star’s motion. We do this because 22 GHz water masers trace outflows with speeds of typically tens of km s-1, whereas methanol masers are generally within 5 km s-1 of the exciting star.
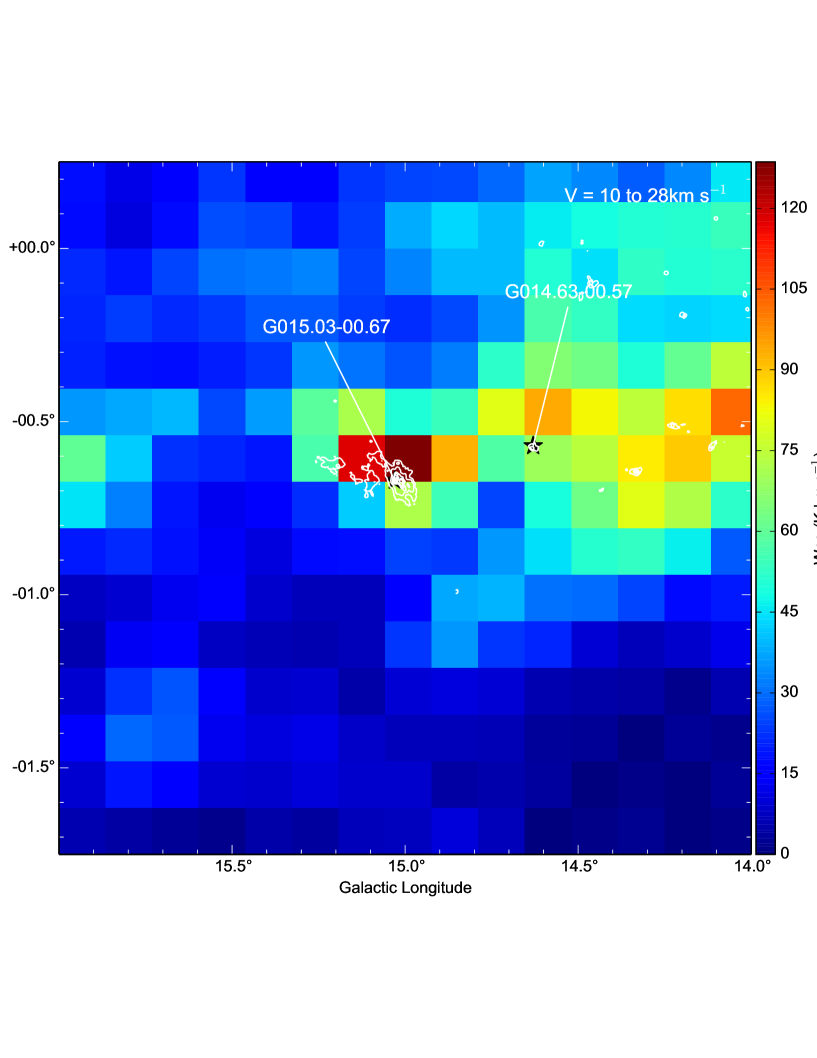
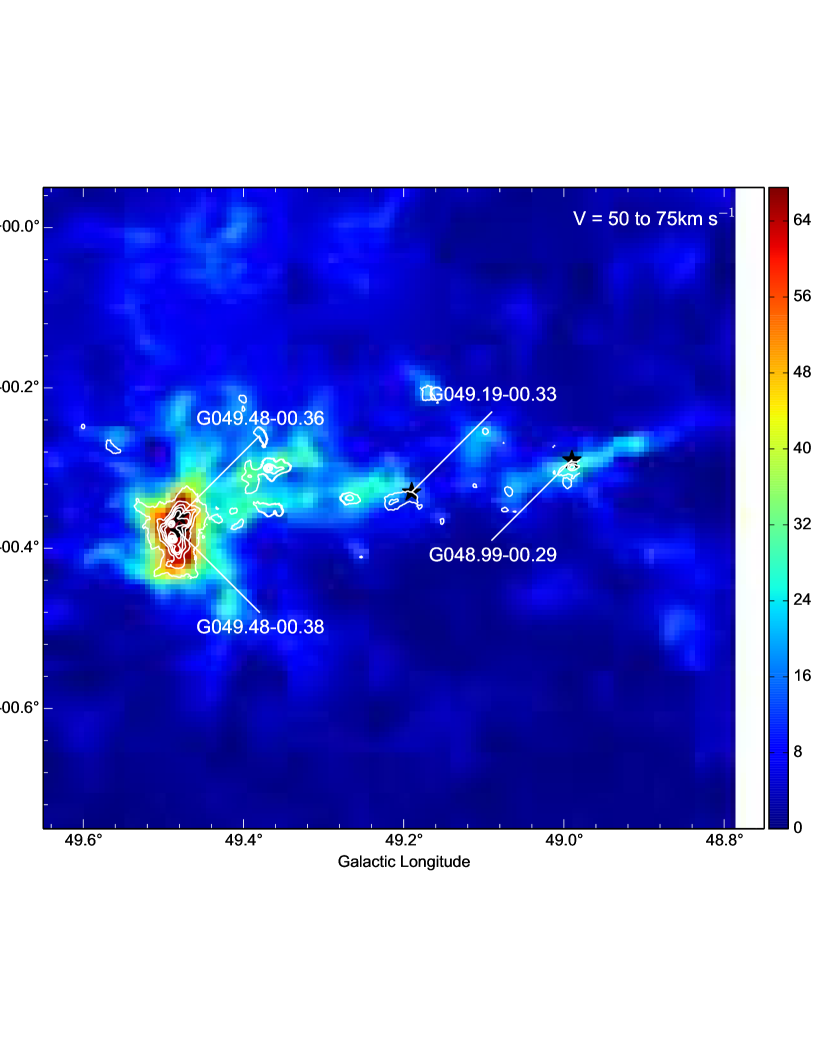
We note that in our sample, masers with similar coordinates, distances and radial velocities are likely in the same giant molecular cloud. For example, G014.6300.57 and G015.0300.67 are associated with the large star forming region M17 (see Figure A.1); G049.4800.36, G049.4800.38, G048.9900.29 and G049.1900.33 appear associated with W51 (see Figure A.2); and G045.45+00.06, G045.07+00.13 and G045.49+00.12 may be associated with the H\@slowromancapii@ region GAL 045.5+00.0 (see Figure A.3). By combining parallax measurements of the associated sources, we can improve the distance estimates to the larger star forming regions, yielding averaged parallaxes of 0.5240.024 mas for M17, 0.1890.037 mas for W51, and 0.1260.013 mas for GAL 045.5+00.0.
4 Assigning Sources to Arm Segments
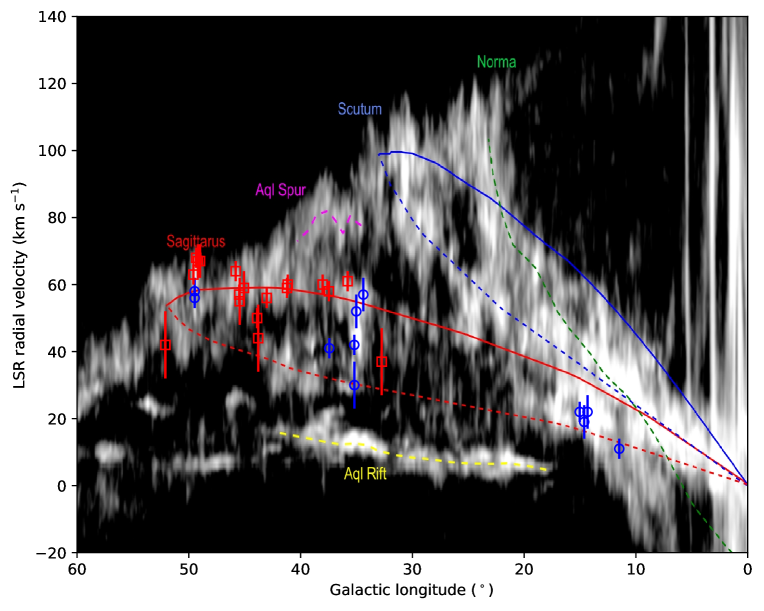
In Figure 2, we show the locations of HMSFRs with measured parallaxes superposed on a CO longitude-LSR velocity (-) plot. The assignment of a maser source to a specific spiral arm or arm segment can usually be done via such a plot, by comparing the Galactic coordinates and LSR velocity of the source with continuous traces of CO (or HI) emission previously associated with an arm. However, (-) information alone does not always allow a definitive assignment. Even for sources with direct parallax distances, the distance uncertainty does not always guarantee a spiral arm segment assignment. Instead, distance can best be assigned on a probabilistic basis, and when doing this it is important that all possible information is utilized.
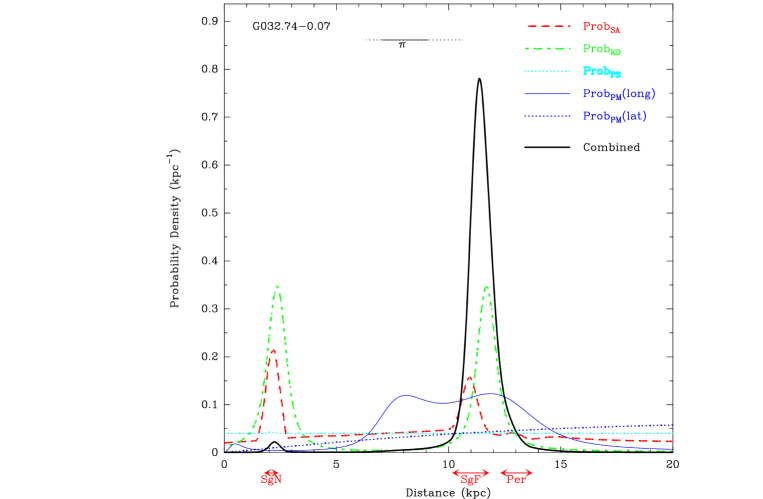
For the BeSSeL Survey, we evaluate arm segment assignment using our Bayesian distance estimator (Reid et al., 2016), which considers all distance-related information, including a new feature which incorporates a proper motion “kinematic-distance” probability density function (PDF; Reid et al., in preparation). For example, consider G032.7400.07, a water maser at km s-1, which in (, ) space lies between the Sgr Near and Sgr Far arm segments333We define ”near” and ”far” for the Sgr arm as relative to the tangent point. While this is equivalent to kinematic near/far convention, it does not imply that we have used absorption information to make this distinction. (as seen in Figure 2). The distance PDF for this source is shown in Figure 3. As expected, the probabilities of matching a spiral arm segment, ProbSA, are similar for the Sgr Near and the Sgr Far segments. However, the Galactic longitude motion, ProbPM(long), favors the Sgr Far segment, as does the measured parallax, denoted by the horizontal line at the top of Figure 3 (with solid and dotted lines indicating its 1-sigma and 2-sigma uncertainty ranges), albeit with about a 2-sigma deviation. Putting all information together, we assigned G032.7400.07 to the Sgr Far arm segment. Based on similar evidence, we also assigned G043.790.12 to Sgr Far.
Other apparent anomalies in the arm segment assignments are seen for the following sources near in Figure 2: G034.39+00.22, G035.02+00.34, and G035.2001.73. This is a very interesting region, with sources projected close to the W44 SNR. It is possible that the precursor O-star’s wind may have accelerated gas that has now formed the stars we observe (Reid & Ho, 1985). If so, this might explain anomalous velocities which can confuse () locations. For sources in this region, we rely mostly on parallaxes to assign to an arm segment.
5 Geometry of the Sagittarius arm
5.1 Galactic Locations of HMSFRs
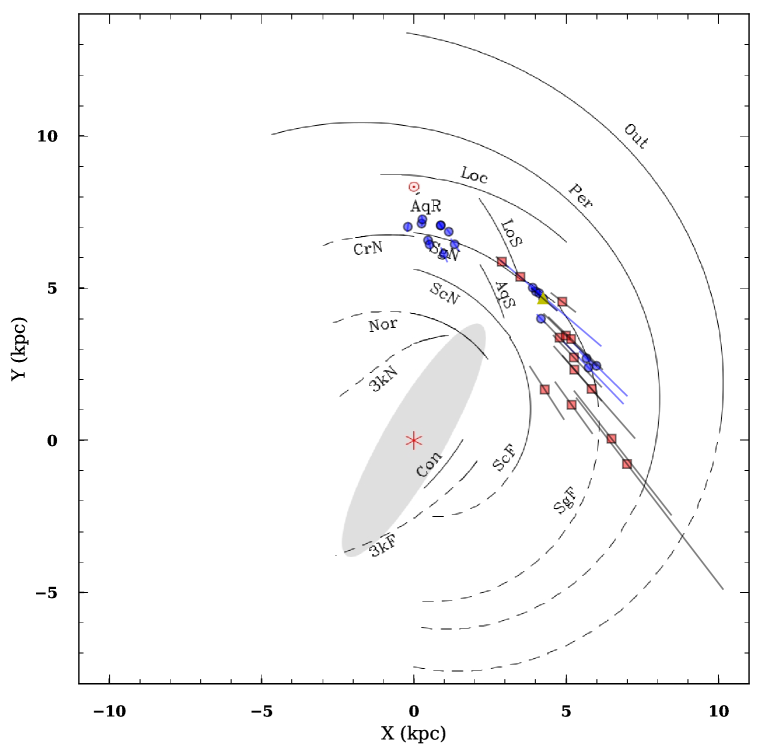
In Figure 4, we show locations of all HMSFRs associated with the Sgr arm with measured parallaxes superposed on a plan view of the Galaxy. There now are 18 HMSFRs located beyond the tangent point of the Sgr arm: 13 sources reported in this paper, 4 reported by Wu et al. (2014), and 1 reported by Nagayama et al. (2015). The locations of all sources are consistent with the Reid et al. (2016) model for the Sagittarius arm.
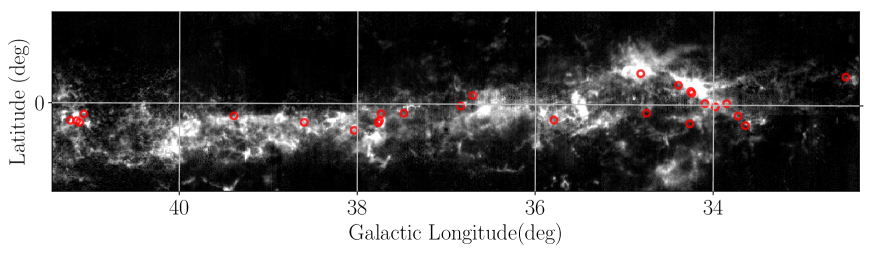
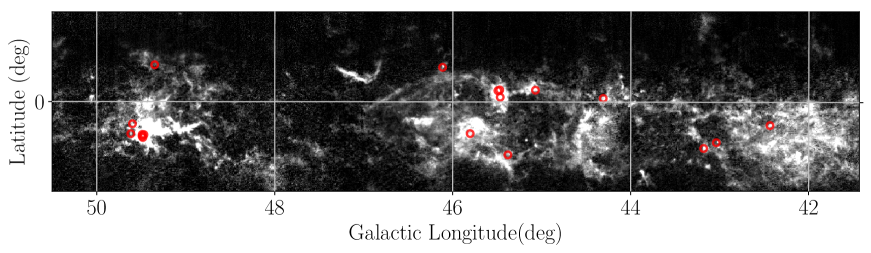
We note that 16 of 18 sources in the far portion of the Sagittarius arm are below the IAU-defined Galactic plane. In order to investigate this asymmetry, we looked at the Galactic distribution of all the 6.7-GHz masers thought to be in this section of the arm based on their location in the - plane. We assigned sources to the far arm section if their longitudes were within the range 32∘ 50∘ and their velocities were within the range 50 VLSR 70 km s-1. Searching the Methanol Multi-Beam Survey maser catalog of Breen et al. (2015), we identified 42 6.7-GHz masers in the far portion of the arm; they are shown as red circles in Figure 5.
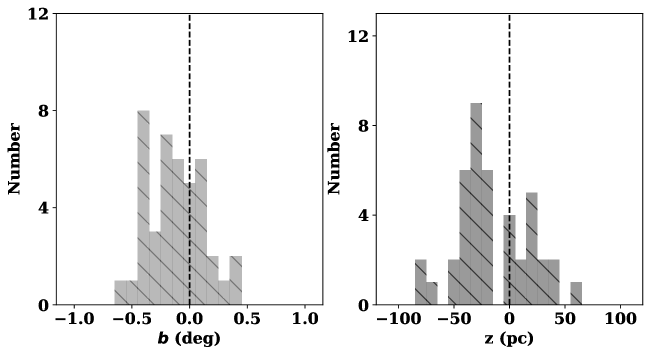
In the two panels of Figure 6 we show the histograms of Galactic latitude, , and the vertical distances, , of these masers from the IAU Galactic plane. For sources without maser parallaxes, we used distances calculated with the Bayesian distance estimator of Reid et al. (2016). Figure 6 suggests a systematic z-offset for the Sgr Far arm section. The number of sources below/above the Galactic mid-plane are 28/14 respectively; the mean vertical distances with respect to the mid-plane, , of these 6.7-GHz methanol masers is pc.
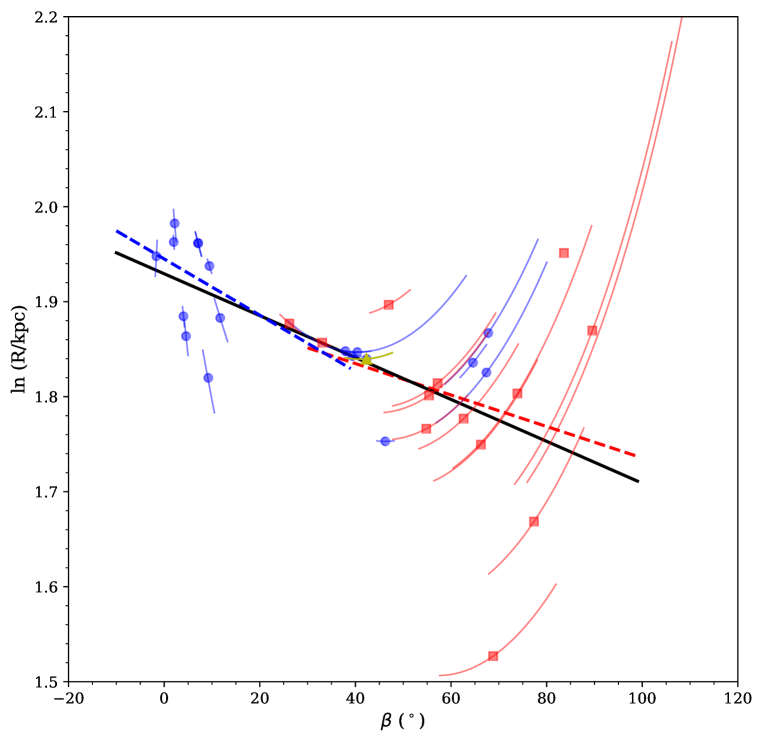
5.2 Pitch Angle of the Sagittarius Arm
A spiral arm pitch angle, , can be defined as the angle between an arm segment and a tangent to a Galactocentric circle. For a log-periodic spiral, , where is the Galactocentric radius in kpc at azimuth in radians; is a reference azimuth and is the radius of the arm at that azimuth. With parallaxes for 30 high mass star forming regions, we estimate a global pitch angle of 72 19, which is consistent with our previous estimate of (71 15) (Wu et al., 2014). The increase in uncertainty between the previous and current estimates suggests that the pitch angle may not be constant over the larger range of azimuth that we now have sampled. Such effects are seen in other spiral galaxies (Honig & Reid, 2015). If we divide the arm into two sections, we estimate pitch angles of 54 33 and 94 39 for the far and near portions of the Sgr arm, respectively, as shown in Figure 7. For comparison, pitch angles of spiral arms in the Milky Way, determined by maser parallaxes range from to , with the Sagittarius arm having the smallest pitch angle (Reid et al., 2014).
6 Kinematics of the Sagittarius arm
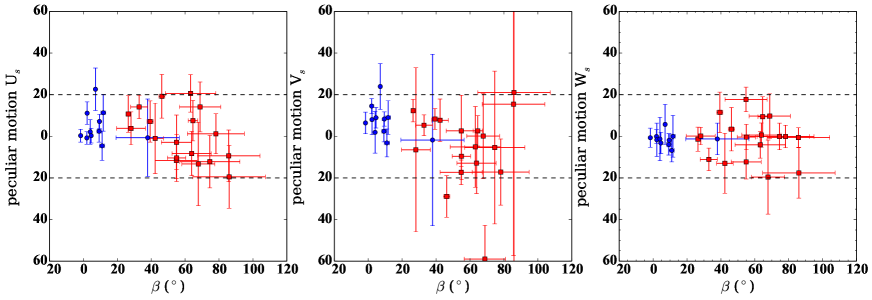
We now investigate the 3-dimensional motions of HMSFRs in the Sgr arm. We follow the methodology given in the Appendix of Reid et al. (2009b) to calculate peculiar motion: (Us, Vs, Ws), where Us is toward the Galactic center, Vs is in the direction of Galactic rotation, and Ws is toward the North Galactic Pole. We adopt the “Universal” form for the rotation curve of Persic et al. (1996), with a circular rotation speed at the Sun of =241 km s-1, R0=8.31 kpc, and Solar Motion components of (U⊙, V⊙, W⊙) = (10.5, 14.4, 8.9) km s-1 (see the “Univ” model in Table 5 of Reid et al. (2014)).
In Table 2, we list peculiar motion components for the 30 (18 Sgr Far and 12 Sgr Near) HMSFRs in the Sgr arm with measured parallaxes and proper motions. Plots of the peculiar motion components versus Galactocentric azimuth are shown in Figure 8. All values are consistent with km s-1, except for the component of G032.7400.07, which is km s-1. The variance-weighted average peculiar motion components for the far, near and all Sgr arm sources are (, , ) km s-1, (, , ) km s-1 and (, , ) km s-1, repectively.
7 Conclusions
We have measured trigonometric parallaxes and proper motions for 13 HMSFRs, which are located on the far side (past the tangent point) of the Sagittarius arm. Together with 5 published maser parallaxes, we studied the location, shape and kinematics of the far portion of the Sgr arm. We find that the 6.7-GHz masers in this arm section are on average pc below the IAU-defined Galactic mid-plane. The average pitch angle of the Sgr arm, now measured over kpc is , but there is evidence that the pitch angle may not be constant along the arm. Peculiar motions for all but one source are less than 20 km s-1, but the there is a small average motion toward the Galactic center and in the direction of Galactic rotation.
References
- Blaauw et al. (1960) Blaauw, A., Gum, C. S., Pawsey, J. L., & Westerhout, G. 1960, MNRAS, 121, 123
- Bobylev & Bajkova (2016) Bobylev, V. V., & Bajkova, A. T. 2016, Astronomy Letters, 42, 182
- Breen et al. (2015) Breen, S. L., Fuller, G. A., Caswell, J. L., et al. 2015, MNRAS, 450, 4109
- Chibueze et al. (2014) Chibueze, J. O., Sakanoue, H., Nagayama, T., et al. 2014, PASJ, 66, 104
- Chibueze et al. (2016) Chibueze, J. O., Kamezaki, T., Omodaka, T., et al. 2016, MNRAS, 460, 1839
- Dame et al. (2001) Dame, T. M., Hartmann, D., & Thaddeus, P. 2001, ApJ, 547, 792
- Deller et al. (2007) Deller, A. T., Tingay, S. J., Bailes, M., & West, C. 2007, PASP, 119, 318
- Honig & Reid (2015) Honig, Z. N., & Reid, M. J. 2015, ApJ, 800, 53
- Malhotra (1994) Malhotra, S. 1994, ApJ, 437, 194
- Honma et al. (2015) Honma, M., Nagayama, T., & Sakai, N. 2015, Publications of the Astronomical Society of Japan, 67
- Hu et al. (2018) Hu, B., Wu, Y. W., Reid, M. J., Menten, K. M., & Zheng, X. W. 2018, in prepare
- Jackson et al. (2006) Jackson, J. M., Rathborne, J. M., Shah, R. Y., et al. 2006, ApJS, 163, 145
- Kurayama et al. (2011) Kurayama, T., Nakagawa, A., Sawada-Satoh, S., et al. 2011, PASJ, 63, 513
- Nagayama et al. (2015) Nagayama, T., Kobayashi, H., Omodaka, T., et al. 2015, PASJ, 67, 65
- Oh et al. (2010) Oh, C. S., Kobayashi, H., Honma, M., et al. 2010, PASJ, 62, 101
- Persic et al. (1996) Persic, M., Salucci, P., & Stel, F. 1996, MNRAS, 281, 27
- Reid & Ho (1985) Reid, M. J., & Ho, P. T. P. 1985, ApJ, 288, 17
- Reid et al. (2016) Reid, M. J., Dame, T. M., Menten, K. M., & Brunthaler, A. 2016, ApJ, 823, 77
- Reid et al. (2009a) Reid, M. J., Menten, K. M., Brunthaler, A., et al. 2009a, ApJ, 693, 397
- Reid et al. (2009b) Reid, M. J., Menten, K. M., Zheng, X. W., et al. 2009b, ApJ, 700, 137
- Reid et al. (2014) Reid, M. J., Menten, K. M., Brunthaler, A., et al. 2014, ApJ, 783, 130
- Reid et al. (2017) Reid, M. J., Brunthaler, A., Menten, K. M., et al. 2017, AJ, 154, 63
- Reid et al. (2018) Reid, M. J., Menten, K. M., Brunthaler, A., et al. 2018, in prepare
- Rygl et al. (2018) Rygl, K. L., et al. 2018, in prepare
- Sato et al. (2010a) Sato, M., Hirota, T., Reid, M. J., et al. 2010a, PASJ, 62, 287
- Sato et al. (2010b) Sato, M., Reid, M. J., Brunthaler, A., & Menten, K. M. 2010b, ApJ, 720, 1055
- Schuller et al. (2009) Schuller, F., Menten, K. M., Contreras, Y., et al. 2009, A&A, 504, 415
- Xu et al. (2009) Xu, Y., Reid, M. J., Menten, K. M., et al. 2009, ApJ, 693, 413
- Wu et al. (2014) Wu, Y. W., Sato, M., Reid, M. J., et al. 2014, A&A, 566, A17
- Xu et al. (2011) Xu, Y., Moscadelli, L., Reid, M. J., et al. 2011, ApJ, 733, 25
- Xu et al. (2016) Xu, Y., Reid, M., Dame, T., et al. 2016, Science Advances, 2, e1600878
- Yao et al. (2017) Yao, J. M., Manchester, R. N., & Wang, N. 2017, MNRAS, 468, 3289
- Zhang et al. (2009) Zhang, B., Zheng, X. W., Reid, M. J., et al. 2009, ApJ, 693, 419
![[Uncaptioned image]](/html/1901.09313/assets/x7.png)
![[Uncaptioned image]](/html/1901.09313/assets/x8.png)
![[Uncaptioned image]](/html/1901.09313/assets/x9.png)
![[Uncaptioned image]](/html/1901.09313/assets/x10.png)
![[Uncaptioned image]](/html/1901.09313/assets/x11.png)
![[Uncaptioned image]](/html/1901.09313/assets/x12.png)
Figure 1 continued
![[Uncaptioned image]](/html/1901.09313/assets/x13.png)
Figure 1 continued
| Source | Maser | Parallax | Distance | VLSR | Ref. | ||
|---|---|---|---|---|---|---|---|
| name | (mas) | (kpc) | (mas yr-1) | (mas yr-1) | (km s-1) | ||
| G351.4400.65 | 12 GHz | 0.752 0.069 | 1.33 | 0.31 0.58 | 2.17 0.90 | 8 3 | 2,11 |
| G011.4901.48 | 12 GHz | 0.800 0.033 | 1.25 | 1.42 0.52 | 0.60 0.65 | 11 3 | 2 |
| G014.3300.64 | 22 GHz | 0.893 0.101 | 1.12 | 0.95 1.50 | 2.40 1.30 | 22 5 | 4 |
| G014.6300.57 | 22 GHz | 0.546 0.022 | 1.83 | 0.22 1.20 | 2.07 1.20 | 19 5 | 2 |
| G015.0300.67 | 12 GHz | 0.499 0.026 | 2.00 | 0.68 0.53 | 1.42 0.54 | 22 3 | 5,12 |
| G034.3900.22 | 22 GHz | 0.643 0.049 | 1.56 | 0.90 1.00 | 2.75 2.00 | 57 5 | 6 |
| G035.0200.34 | 22 GHz | 0.430 0.040 | 2.33 | 0.92 0.90 | 3.61 0.90 | 52 5 | 2 |
| G035.1900.74 | 12 GHz | 0.456 0.045 | 2.19 | 0.18 0.50 | 3.63 0.50 | 30 7 | 7 |
| G035.2001.73 | 12 GHz | 0.412 0.014 | 2.43 | 0.68 0.44 | 3.60 0.44 | 43 5 | 7,13 |
| G037.4201.51 | 12&22 GHz | 0.532 0.021 | 1.88 | 0.45 0.35 | 3.69 0.39 | 41 3 | 2 |
| G049.4800.36 | 12 GHz | 0.195 0.071 | 5.13 | 2.49 0.14 | 5.51 0.16 | 56 3 | 8 |
| G049.4800.38 | 22 GHz | 0.185 0.010 | 5.41 | 2.64 0.20 | 5.11 0.20 | 58 4 | 9 |
| G032.7400.07 | 22 GHz | 0.126 0.016 | 7.94 | -3.15 0.27 | 6.10 0.29 | 37 10 | 1 |
| G035.7900.17 | 6.7 GHz | 0.113 0.013 | 8.85 | -2.96 0.12 | 6.23 0.14 | 61 5 | 1 |
| G037.4700.10 | 6.7 GHz | 0.088 0.030 | 11.36 | -2.63 0.07 | 6.19 0.15 | 58 3 | 1 |
| G038.0300.30 | 6.7 GHz | 0.095 0.022 | 10.53 | -3.01 0.06 | 6.20 0.11 | 60 3 | 1 |
| G041.1500.20 | 6.7 GHz | 0.125 0.018 | 8.00 | -2.79 0.14 | 5.85 0.16 | 60 3 | 1 |
| G041.2200.19 | 6.7 GHz | 0.113 0.022 | 8.85 | -2.82 0.13 | 5.89 0.16 | 59 5 | 1 |
| G043.0300.45 | 6.7 GHz | 0.130 0.019 | 7.69 | -3.03 0.15 | 6.56 0.20 | 56 3 | 1 |
| G043.7900.12 | 22 GHz | 0.166 0.010 | 6.02 | -3.02 0.36 | 6.20 0.36 | 44 10 | 2 |
| G043.8900.78 | 6.7&22 GHz | 0.134 0.013 | 7.41 | -3.11 0.15 | 5.35 0.21 | 50 3 | 1,2 |
| G045.0700.13 | 22 GHz | 0.129 0.007 | 7.75 | -3.21 0.26 | 6.11 0.26 | 59 5 | 2 |
| G045.4500.06 | 22 GHz | 0.119 0.017 | 8.40 | -2.34 0.38 | 6.00 0.54 | 55 7 | 2 |
| G045.4900.12 | 6.7 GHz | 0.144 0.024 | 6.94 | -2.62 0.17 | 5.61 0.16 | 57 3 | 1 |
| G045.8000.35 | 6.7 GHz | 0.137 0.023 | 7.30 | -2.52 0.17 | 6.08 0.27 | 64 5 | 1 |
| G048.9900.29 | 22 GHz | 0.178 0.017 | 5.62 | -2.20 0.48 | 5.84 0.63 | 67 10 | 3 |
| G049.1900.33 | 22 GHz | 0.197 0.008 | 5.08 | -3.08 0.40 | 5.50 0.40 | 67 5 | 2, 3 |
| G049.3400.41 | 6.7 GHz | 0.241 0.031 | 4.15 | -2.36 0.26 | 5.59 0.33 | 68 5 | 1 |
| G049.5900.24 | 6.7 GHz | 0.218 0.009 | 4.59 | -2.25 0.24 | 6.12 0.25 | 63 5 | 1 |
| G052.1001.04 | 22 GHz | 0.165 0.013 | 6.06 | -2.77 1.40 | 5.85 1.40 | 42 40 | 1,10 |
Note. — Column 1 gives the source name. Column 2 gives the maser transition: 6.7 and 12.2 GHz are CH3OH and 22 GHz are H2O masers. Columns 3 and 4 give trigonometric parallaxes and distances. Columns 5, 6 and 7 give the proper motion components in the eastward (= cos) and northward directions ( = ) and the estimated LSR velocity of the central exciting star. References are given in Column 8. The dividing line within the Table separates Sgr Far sources (below line) from Sgr Near sources (above line).
References. — (1) this paper; (2) Wu et al. 2014. (3) Nagayama et al. 2015. (4) Sato et al. 2010a; (5) Xu et al. 2011; (6) Kurayama et al. 2011; (7) Zhang et al. 2009; (8) Xu et al. 2009; (9) Sato et al. 2010b; (10) Oh et al. 2010 (11) Chibueze et al. 2014 (12) Chibueze et al. 2016 (13) Rygl et al. 2018
| Source | Arm | Us | Vs | Ws |
|---|---|---|---|---|
| Name | Section | (km s-1) | (km s-1) | (km s-1) |
| G351.4400.65 | Near | |||
| G011.4901.48 | Near | |||
| G014.3300.64 | Near | |||
| G014.6300.57 | Near | |||
| G015.0300.67 | Near | |||
| G034.3900.22 | Near | |||
| G035.0200.34 | Near | |||
| G035.1900.74 | Near | |||
| G035.2001.73 | Near | |||
| G037.4201.51 | Near | |||
| G049.4800.36 | Near | |||
| G049.4800.38 | Near | |||
| G032.7400.07 | Far | |||
| G035.7900.17 | Far | |||
| G037.4700.10 | Far | |||
| G038.0300.30 | Far | |||
| G041.1500.20 | Far | |||
| G041.2200.19 | Far | |||
| G043.0300.45 | Far | |||
| G043.7900.12 | Far | |||
| G043.8900.78 | Far | |||
| G045.0700.13 | Far | |||
| G045.4500.06 | Far | |||
| G045.4900.12 | Far | |||
| G045.8000.35 | Far | |||
| G048.9900.29 | Far | |||
| G049.1900.33 | Far | |||
| G049.3400.41 | Far | |||
| G049.5900.24 | Far | |||
| G052.101.04 | Far | |||
| Average | Near | 2.0 1.4 | 7.1 1.5 | 1.1 1.5 |
| Average | Far | 4.3 2.4 | 0.6 2.2 | 0.2 1.6 |
| Average | All | 2.6 1.1 | 4.5 1.3 | 0.7 1.1 |
Note. — , give the estimated peculiar (non-circular) velocity components of the central star that excites the masers, assuming R0 = 8.31, = 241 km s-1, and Solar Motion components (U, V, W) = (10.5, 14.4, 8.9) km s-1.
| Source | Project | Maser | Epoch 1 | Epoch 2 | Epoch 3 | Epoch 4 | Epoch 5 | Epoch 6 |
|---|---|---|---|---|---|---|---|---|
| G032.7400.07 | BR198N | H2O | 2014Apr11 | 2014Jul21 | 2014Sep19 | 2014Oct29 | 2014Nov30 | 2015Apr14 |
| G035.7900.17 | BR149N | CH3OH | 2012Sep29 | 2013Mar22 | 2013Apr30 | 2013Oct27 | 2013Dec31 | 2014Oct20 |
| G037.4700.10 | BR198P | CH3OH | 2014Apr13 | 2014Oct01 | 2014Nov06 | 2015Apr30 | ||
| G038.0300.30 | BR198P | CH3OH | 2014Apr13 | 2014Oct01 | 2014Nov06 | 2015Apr30 | ||
| G041.1500.20 | BR198Q | CH3OH | 2014Apr17 | 2014Oct18 | 2014Nov07 | 2015Apr25 | ||
| G041.2200.19 | BR198R | CH3OH | 2014Apr19 | 2014Oct09 | 2014Nov08 | 2015May02 | ||
| G043.0300.45 | BR198R | CH3OH | 2014Apr19 | 2014Oct09 | 2014Nov08 | 2015May02 | ||
| G043.8900.78 | BR149O | CH3OH | 2012Nov08 | 2013Mar24 | 2013Apr28 | 2013Oct29 | ||
| G045.4900.12 | BR198R | CH3OH | 2014Apr19 | 2014Oct09 | 2014Nov08 | 2015May02 | ||
| G045.8000.35 | BR149P | CH3OH | 2012Nov10 | 2013Mar26 | 2013Apr29 | 2013Oct30 | ||
| G049.3400.41 | BR198T | CH3OH | 2014Apr20 | 2014Oct30 | 2014NoV10 | 2015May04 | ||
| G052.1001.04 | BR198S | H2O | 2014Apr18 | 2014Jul25 | 2014Sep22 | 2014Nov09 | 2014DEC18 | 2015MAY03 |
| Source | R.A.(J2000) | Dec.(J2000) | R.A.sep | DEC.sep | Beam Size | Fpeak | Vpeak |
|---|---|---|---|---|---|---|---|
| (h m s) | (∘,′,′′) | (∘) | (∘) | (mas mas at ∘) | (Jy beam-1) | (km s-1) | |
| G032.7400.07 | 18:51:21.8627 | 00:12:06.3359 | … | … | 1.28 0.82 at -23 | 9.18 | 33.0 |
| J18570048 | 18:57:51.35860 | 00:48:21.9496 | 0.45 | 0.02 | 2.42 0.90 at -46 | 0.009 | … |
| J18530010 | 18:53:10.26920 | 00:10:50.7400 | 1.62 | -0.60 | 2.54 0.91 at -46 | 0.008 | … |
| J18480138 | 18:48:21.81035 | 01:38:26.6322 | -0.75 | 1.84 | 1.09 0.79 at -16 | 0.036 | … |
| G035.7900.17 | 18:57:16.89050 | 02:27:58.0070 | … | … | 3.17 1.20 at -2 | 4.07 | 61.00 |
| 1855+0251 | 18:55:35.43640 | 02:51:19.5629 | -0.42 | 0.39 | 3.03 1.25 at 1 | 0.043 | … |
| 1903+0145 | 19:03:53.06320 | 01:45:26.3108 | 1.65 | -0.71 | 3.04 1.24 at 0 | 0.072 | … |
| 1848+0138 | 18:48:21.81030 | 01:38:26.6322 | -2.23 | -0.83 | 3.06 1.25 at 0 | 0.025 | … |
| 1907+0127 | 19:07:11.99610 | 01:27:08.9644 | 2.48 | -1.01 | 3.08 1.28 at 2 | 0.086 | … |
| G037.4700.10 | 19:00:07.14300 | 03:59:52.9750 | 4.52 2.68 at 12 | 2.87 | 62.00 | ||
| J1855+0251 | 18:55:35.43640 | 02:51:19.5630 | -1.13 | -1.14 | 5.66 2.39 at 25 | 0.065 | … |
| J1858+0313 | 18:58:02.35227 | 03:13:16.3116 | -0.52 | -0.78 | 4.71 2.85 at 18 | 0.137 | … |
| J1856+0610 | 18:56:31.83880 | 06:10:16.7650 | -0.89 | 2.17 | 4.57 2.82 at 0 | 0.147 | … |
| J1903+0145 | 19:03:53.06327 | 01:45:26.3113 | 0.94 | -2.24 | 4.29 2.52 at -2 | 0.052 | … |
| G038.0300.30 | 19:01:50.46760 | 04:24:18.8999 | 3.76 2.18 at 4 | 3.10 | 56.00 | ||
| J1855+0251 | 18:55:35.43640 | 02:51:19.5630 | -1.56 | -1.55 | 4.15 2.47 at 16 | 0.060 | … |
| J1856+0610 | 18:56:31.83880 | 06:10:16.7650 | -1.32 | 1.77 | 3.64 2.08 at -2 | 0.138 | … |
| J1912+0518 | 19:12:54.25770 | 05:18:00.4220 | 2.76 | 0.89 | 3.73 2.24 at -3 | 0.047 | … |
| J1858+0313 | 18:58:02.35227 | 03:13:16.3116 | -0.95 | -1.18 | 3.74 1.95 at 5 | 0.092 | … |
| G041.1500.20 | 19:07:14.37300 | 07:13:17.6500 | … | … | 3.11 1.37 at 1 | 3.26 | 56.0 |
| J1905+0652 | 19:05:21.21048 | 06:52:10.7803 | -0.47 | -0.35 | 3.23 1.47 at 0 | 0.092 | … |
| J1907+0907 | 19:07:41.96340 | 09:07:12.3970 | 0.11 | 1.90 | 3.19 1.46 at 0 | 0.186 | … |
| J1856+0610 | 18:56:31.83880 | 06:10:16.7650 | -2.66 | -1.05 | 3.21 1.46 at 0 | 0.030 | … |
| J1912+0518 | 19:12:54.25770 | 05:18:00.4220 | 1.40 | -1.92 | 3.32 1.47 at -3 | 0.035 | … |
| G041.2200.19 | 19:07:21.3720 | 07:17:08.100 | … | … | 3.31 1.15 at -2 | 1.89 | 55.38 |
| J1905+0652 | 19:05:21.2104 | 06:52:10.7803 | -0.50 | -0.42 | 2.73 0.98 at 0 | 0.031 | … |
| J1919+0619 | 19:19:17.3502 | 06:19:42.7700 | 2.96 | -0.96 | 3.22 0.85 at 16 | 0.158 | … |
| J1856+0610 | 18:56:31.8388 | 06:10:16.7650 | -2.68 | -1.11 | 3.08 1.17 at 0 | 0.089 | … |
| J1907+0907 | 19:07:41.9634 | 09:07:12.397 | 0.09 | 1.83 | 3.04 1.16 at 0 | 0.077 | … |
| G043.0300.45 | 19:11:38.99000 | 08:46:30.8000 | … | … | 3.31 1.15 at -2 | 1.55 | 54.82 |
| J1907+0907 | 19:07:41.96340 | 09:07:12.3970 | -0.98 | 0.34 | 2.85 1.17 at -1 | 0.073 | … |
| J1913+0932 | 19:13:24.02539 | 09:32:45.3791 | 0.43 | 0.77 | 2.94 1.12 at -3 | 0.008 | … |
| J1905+0952 | 19:05:39.89890 | 09:52:08.4070 | -1.48 | 1.09 | 2.86 1.18 at 0 | 0.063 | … |
| J1922+0841 | 19:22:18.63370 | 08:41:57.3730 | 2.63 | -0.08 | 3.09 1.23 at -4 | 0.041 | … |
| G043.8900.78 | 19:14:26.39050 | 09:22:36.5660 | … | … | 3.70 1.37 at -9 | 3.85 | 48.00 |
| J1913+0932 | 19:13:24.02539 | 09:32:45.3791 | -0.26 | 0.17 | 3.45 1.36 at -9 | 0.009 | … |
| J1907+0907 | 19:07:41.96336 | 09:07:12.3968 | -1.66 | -0.26 | 3.53 1.33 at -10 | 0.096 | … |
| J1922+0841 | 19:22:18.63360 | 08:41:57.3780 | 1.94 | -0.68 | 3.55 1.44 at -8 | 0.054 | … |
| J1905+0952 | 19:05:39.89889 | 09:52:08.4071 | -2.16 | 0.49 | 3.35 1.37 at -8 | 0.075 | … |
| G045.4900.12 | 19 14 11.35530 | 11:13:06.3700 | … | … | 3.51 1.20 at -6 | 3.10 | 57.36 |
| J1908+1201 | 19:08:40.32064 | 12:01:58.8609 | -1.35 | 0.81 | 3.14 1.34 at -4 | 0.063 | … |
| J1913+1307 | 19:13:14.00638 | 13:07:47.3307 | -0.23 | 1.91 | 3.07 1.21 at -5 | 0.087 | … |
| J1905+0952 | 19:05:39.89890 | 09:52:08.4070 | -2.09 | -1.35 | 3.09 1.22 at -3 | 0.076 | … |
| J1925+1227 | 19:25:40.81710 | 12:27:38.0870 | 2.82 | 1.24 | 3.18 1.28 at -4 | 0.041 | … |
| G045.8000.35 | 19 16 31.07930 | 11:16:11.9880 | … | … | 3.55 1.34 at -3 | 2.23 | 60.00 |
| J1908+1201 | 19:08:40.32064 | 12:01:58.8609 | -1.92 | 0.76 | 3.17 1.30 at -2 | 0.078 | … |
| J1913+0932 | 19:13:24.02539 | 09:32:45.3791 | -0.76 | -1.7 | 3.17 1.30 at -2 | 0.155 | … |
| J1925+1227 | 19:25:40.81708 | 12:27:38.0856 | 2.25 | 1.19 | 3.17 1.30 at -2 | 0.113 | … |
| J1913+1307 | 19:13:14.00638 | 13:07:47.3307 | -0.81 | 1.86 | 3.17 1.30 at -2 | 0.079 | … |
| G049.3400.41 | 19:20:32.4500 | +14:45:45.400 | … | … | 6.39 1.28 at -19 | 1.772 | 67.60 |
| J1922+1504 | 19:22:33.27280 | +15:04:47.5370 | 0.49 | 0.32 | 7.17 1.12 at -20 | 0.021 | … |
| J1922+1530 | 19:22:34.69918 | +15:30:10.0314 | 0.49 | 0.74 | 6.24 1.74 at -17 | 0.080 | … |
| J1917+1405 | 19:17:18.06392 | +14:05:09.7704 | -0.78 | -0.68 | 6.62 1.34 at -18 | 0.048 | … |
| J1924+1540 | 19:24:39.45574 | +15:40:43.9405 | 1.00 | 0.92 | 6.18 1.64 at -19 | 0.257 | … |
| G052.1001.04 | 19:23:37.3295 | 17:29:10.495 | … | … | 0.93 0.54 at -13 | 6.330 | 32.30 |
| J1921+1625 | 19:21:57.38244 | 16:25:01.9231 | -0.40 | -1.07 | 1.01 0 58 at -9 | 0.041 | … |
| J1927+1847 | 19:27:32.31207 | 18:47:07.9048 | 0.93 | 1.30 | 0.97 0.57 at -11 | 0.016 | … |
| J1928+1859 | 19:28:42.71875 | 18:59:24.5627 | 1.21 | 1.50 | 0.94 0.60 at -11 | 0.032 | … |
| J1924+1540 | 19:24:39.45590 | 15:40:43.9420 | 0.25 | -1.81 | 1.01 0.57 at -10 | 0.267 | … |
Note. — The R.A.sep is R.A.cos(Dec).