Nonextensive triplets in stock market indices
Abstract
Stock market indices are one of the most investigated complex systems in econophysics. Here we extend the existing literature on stock markets in connection with nonextensive statistical mechanics. We explore the nonextensivity of price volatilities for 34 major stock market indices between 2010 and 2019. We discover that stock markets follow nonextensive statistics regarding equilibrium, relaxation and sensitivity. We find nonextensive behavior in stock markets for developed countries, but not for developing countries. Distances between nonextensive triplets suggest that some stock markets might share similar nonextensive dynamics, while others are widely different. The current findings strongly indicate that the stock market represents a system whose physics is properly described by nonextensive statistical mechanics. Our results shed light on the complex nature of stock market indices, and establish another formal link with the nonextensive theory.
keywords:
non-extensive statistics , stock market indices , -triplet1 Introduction
The stock market index is a good indicator of the overall market behavior and is frequently used by financial investors. Scale invariant behavior for both the distribution of returns and long term correlations in volatilities are well known properties of financial markets [1, 2]. While diverse methods have been employed to address the nonlinearity and complexity of these data, such as correlations [3, 4, 5], multifractal analysis [6, 7, 8], network science [9, 10, 11], and various entropy measures [12, 13], their complete understanding remains an open problem. The presence of fractal behavior [7], long-range temporal dependencies [2] and heavy-tailed distributions [14], indicate that stock markets deviate from the normal expectation into out-of-equilibrium states where traditional statistical mechanics does not work. A wide class of such systems can be described by nonextensive statistics [15] instead. The nonextensive theory thus forms a strong candidate for shedding new light on the phenomena involving stock market indices.
In the present study we consider a nonextensive theory which generalizes Boltzmann-Gibbs (BG) statistical mechanics for out-of-thermal equilibrium systems. From a mathematical standpoint, nonextensive statistics relies on a generalized definition of entropy [15]:
| (1) |
which is obtained by substituting exponentials with q-exponentials
| (2) |
and natural logarithms with -logarithms
| (3) |
reducing to the BG entropy, the usual exponential and logarithm as . The power law exponent , also known as the entropic number, is intimately related to the microscopic dynamics and characterizes the degree of correlations in the system. A particularly important instance of nonextensive statistics is that of systems that find themselves out-of-thermal equilibrium but still form stationary states, which can be found in a great variety of complex systems. This seemingly simple generalization to physical systems implies that (i) stationary probability distributions acquire long tails, (ii) stationary states turn out less sensitive to initial conditions, and (iii) relaxation towards equilibrium becomes slower (q-exponential, rather than exponential). From a time series perspective, these three distinct properties translate into [16]: (i) distributions with long (power law) tails, (ii) wider multifractal spectrum, and (iii) q-exponential decay of correlations. The set of obtained values for the nonextensive parameter is denoted as a “q-triplet” and characterizes metastable states in nonequilibrium. This triplet has been successfully explored in natural phenomena such as the ozone layer [17], solar plasma [18, 19], El Niño/Southern Oscillation [20], geological faults [21] and river discharge [16]; in artificial systems including scale-free networks [22], logistic [23] and standard [24] maps; and in financial systems namely cryptocurrencies [25].
The main aim of our work is to analyze the behavior of stock markets in the context of nonextensive formalism – to compare their physical observables (such as price returns and volatilities) with those expected for a metastable dynamical system described by nonextensive statistics. In this context, we focus our attention on major stock market indices across the world from 2010 to 2019, in the aftermath of the last global financial crisis. Stock market volatilities are characterized by pronounced intermittency, exhibit unusually long temporal dependencies with correlations that decay slower than exponential, and tails in the probability distributions follow a power law with exponents less than three. We report evidence of nonextensive triplets [26] that are characteristic of systems that follow nonextensive statistics, which implies that -triplets are more common in finance than previously thought [25]. The nonextensive behavior is mostly present in stock market indices from developed countries, but not from developing countries. Distances between the -triplets further suggest that some stock markets might share similar nonextensive dynamics, while others are widely different. The discovery of -triplets in stock markets, together with their previous appearance in cryptocurrencies [25], encourages further research into the prevalence of nonextensive phenomena in finance.
The remainder of this paper is organized as follows: Section 2 describes the stock market data; Section 3 presents the results and discussions; Section 4 draws the conclusions.
2 Data
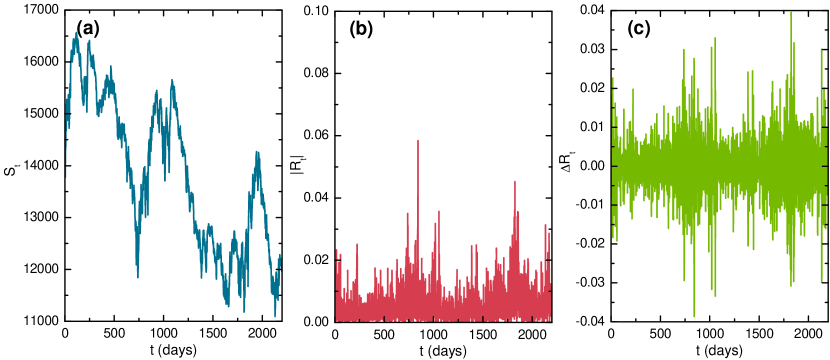
We analyze the time series of major stock market indices that appear in the website https://www.investing.com/indices/major-indices as listed in Table 1. The period under study starts from 2010, after the global financial crisis, and ends in 2019. For each of the stock markets we calculate the daily logarithmic change in closing price :
| (4) |
and construct a time series from the volatilities . We focus this investigation on the volatilities and their increments . Fig. 1 reveals the presence of large price return and volatility variations with dense intermittent behavior which can be indicative of nonextensive statistics.
| Market | Country | Index | Period |
|---|---|---|---|
| AEX | Amsterdam | AEX | 1/4/2010 - 12/28/2018 |
| S&PASX 200 | Australia | AXJO | 1/4/2010 - 12/28/2018 |
| BEL 20 | Germany | BFX | 1/4/2010 - 12/28/2018 |
| Budapest SE | Hungary | BUX | 3/7/2011 - 12/28/2018 |
| Bovespa | Brazil | BVSP | 1/4/2010 - 12/28/2018 |
| Dow Jones Industrial Average | United States | DJI | 1/4/2010 - 12/28/2018 |
| CAC 40 | France | FCHI | 1/4/2010 - 12/28/2018 |
| FTSE MIB | Italy | FTMIB | 1/4/2010 - 12/28/2018 |
| FTSE 100 | England | FTSE | 1/4/2010 - 12/28/2018 |
| DAX | Germany | GDAXI | 1/4/2010 - 12/28/2018 |
| S&PTSX Composite | Canada | GSPTSE | 1/4/2010 - 12/28/2018 |
| Hang Seng | Hong Kong | HIS | 11/4/2010 - 12/28/2018 |
| IBEX 35 | Spain | IBEX | 1/4/2010 - 12/28/2018 |
| MOEX Russian | Russia | IMOEX | 1/11/2010 - 12/28/2018 |
| NASDAQ Composite | United States | IXIC | 1/4/2010 - 12/28/2018 |
| Jakarta Stock Exchange Composite | Indonesia | JKSE | 1/4/2010 - 12/28/2018 |
| KOSPI | South Korea | KS11 | 1/4/2010 - 12/28/2018 |
| Karachi 100 | Pakistan | KSE | 1/4/2010 - 12/28/2018 |
| S&PBMV IPC | Mexico | MMX | 1/4/2010 - 12/28/2018 |
| Nikkei 225 | Japan | N225 | 1/4/2010 - 12/28/2018 |
| Nifty 50 | India | NSEI | 1/4/2010 - 12/28/2018 |
| OMX Stockholm 30 | Sweden | OMXS30 | 1/4/2010 - 12/28/2018 |
| PSEi Composite | Philippines | PSI | 11/2/2011 - 12/28/2018 |
| PSI 20 | Portugal | PSI20 | 5/25/2010 - 12/28/2018 |
| SET Index | Thailand | SETI | 3/18/2011 - 12/28/2018 |
| S&P 500 | United States | SPX | 1/4/2010 - 12/28/2018 |
| Shanghai Composite | China | SSEC | 1/4/2010 - 12/28/2018 |
| SMI | Switzerland | SSMI | 1/4/2010 - 12/28/2018 |
| FTSE Straits Times Singapore | Singapore | STI | 3/7/2011 - 12/28/2018 |
| Euro Stoxx 50 | Euro Zone | STOXX50E | 8/15/2011 - 12/28/2018 |
| TA 35 | Israel | TA35 | 1/3/2010 - 12/28/2018 |
| Tadawul All Share | Saudi Arabia | TASI | 1/2/2010 - 12/28/2018 |
| Taiwan Weighted | Taiwan | TWII | 3/17/2011 - 12/28/2018 |
| BIST 100 | Turkey | XU100 | 1/4/2010 - 12/28/2018 |
3 Results and discussion
Systems that follows nonextensive statistics are characterized by a -triplet that satisfies , and [26], or even the more rigid set of conditions [27]. Here we calculate nonextensive triplets for each stock market, where values of are obtained from the -Gaussian, from the -exponential, and from the multifractality of the time series. We begin with the Canadian market (GSPTSE) as a case study and later expand to other stock markets.
3.1 Stationary
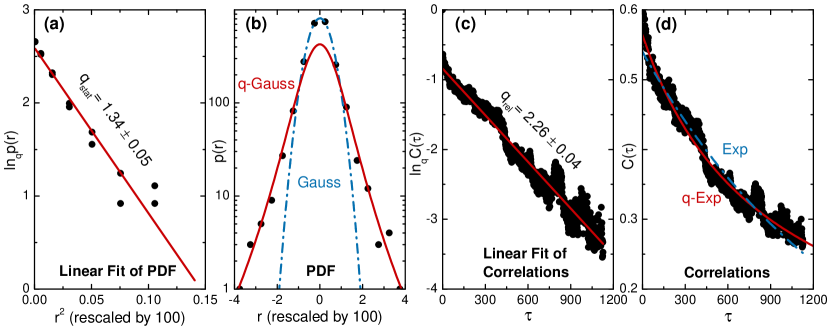
A suitable -value for the stationary state is obtained from the PDF associated to volatility increments . range is subdivided into bins of width centered at so we can obtain the frequency of values within each bin. The normalized histogram yields a stationary-PDF , where is the probability for a value to fall within the th bin and is the number of bins. Our PDF is retrieved from adjusting the histogram of values to a -Gaussian [28]
| (5) |
in order to find the value of that best linearizes the graph vs. . We vary from to and select which value makes the best linear adjustment from the coefficient of determination [19]. We first consider volatility increments of the GSPTSE market index as a case study. The value is found to adjust well the experimental values with the coefficient of determination as shown in Fig. 2(a). It should be emphasized that this value is fully consistent with the bounds obtained from several independent studies involving the nonextensive framework (see, e.g. [14]). Fig. 2(b) plots the associated -Gaussian and the best adjustment that can be made with a (standard) Gaussian. Clearly the values become noticeably non-Gaussian along the tails, and instead can be described by a power law. This is indicative of a Hamiltonian system whose elements do not interact locally but rather globally [26].
3.2 Relaxation
The corresponding value, which describes a relaxation process, can be computed from the autocorrelation function
| (6) |
For a classical BG process such correlation should decay in exponential fashion, but volatilities in stock markets are known to exhibit long-range correlations [14]. Fig. 2(d) clearly shows that the autocorrelation of the series decays much slower than an exponential function. We can estimate the value of by the same linear adjustments on the graph vs. to determine which choice of best linearizes the data. Fig. 2(c) reveals that autocorrelations of GSPTSE market index decay as a power law with an exponent and . This suggests that macroscopic variables of the considered stock market decay slower than exponential to their equilibrium values.
3.3 Sensitivity to initial conditions
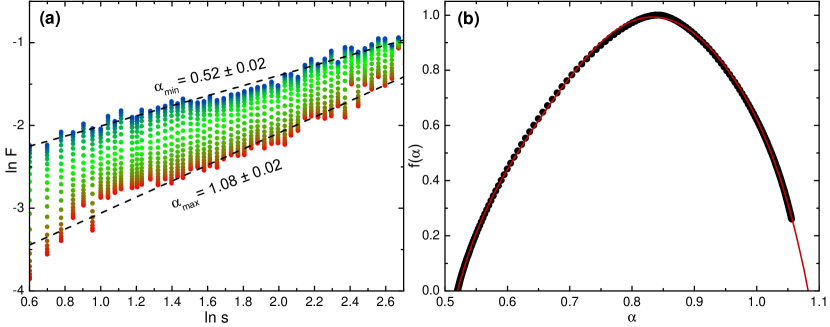
Systems well-described by the nonextensive theory exhibit less than exponential sensitivity to initial conditions. Small initial differences between neighboring states grow in -exponential fashion characterized by a vanishing Lyapunov exponent and a parameter . Deviations of the neighboring trajectories of the attractor set of the dynamics leads to a multifractal structuring of the phase space [19]. The value can be derived from the multifractal spectrum of the attractor associated to nonlinear dynamical system, reflected by . denotes the fractal dimension of the attractor’s subset that possesses the local scaling exponent [29]. The extreme values and of the multifractal spectrum, for which , have the following relation to the parameter [30]:
| (7) |
We calculate using the Multifractal Detrended Fluctuation Analysis (MFDFA) method which is superior to other methods when dealing with non-stationary time series [29]. Fig. 3(a) shows that the fluctuation function increases with the box size as a power law , where the scaling exponent is calculated as the slope of the linear regression of vs. . These exponents are related to the singularity spectrum through a Legendre transformation [29] from which the spectra extrema can be obtained by extrapolating the curve of a polynomial fit to zero. Fig. 3(b) reveals that the GSPTSE spectrum has a wide range of scaling exponents and the position of maximum is consistent with values obtained in literature for volatilities in stock markets [31]. From the spectrum extrapolation we obtain and resulting in the parameter . This low value for indicates that its distribution exhibits weak chaos [15] in the full dynamical space of the system [15, 18].
3.4 -triplets for stock markets
Our analysis so far reveals a -triplet for the Canadian market (GSPTSE) that obeys the general relation [27], and is consistent with the nonextensive scenario. The question remains whether similar relations appear for other stock market -triplets. Out of 34 analyzed stock market indices, we find that 22 stock markets satisfy the aforementioned -triplet relation, as underlined in Tab. 2. Interestingly most of these stock markets come from developed countries, while developing countries such as Brazil (BVSP) and Russia (IMOEX) tend to escape from the nonextensive formalism. This suggests that stock markets from developed countries such as United States (SPX and DJI) may well represent a system in an off-equilibrium stationary state whose physics is properly described by nonextensive statistical mechanics. For developing countries the stock market indices often reverse the relationship between and such that . Ref. [20] observed a similar inversion in the -triplet relation for variability of El Niño oscillations.
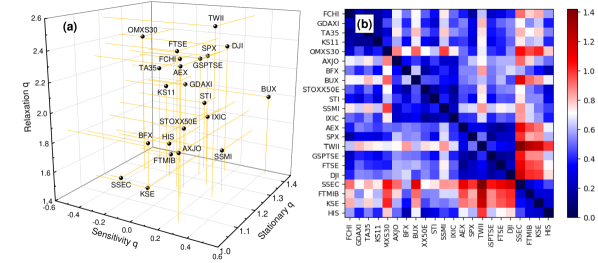
The wide range of -triplets observed earlier suggests the presence of distinct nonextensive dynamical behavior between stock markets – a stationary or metastable state is characterized by a triplet of -values. This motivates for a comparison between the set of -values in order to obtain useful insight on the different dynamical processes between stock market indices. We map -triplets to the three-dimensional Cartesian space in Fig. 4(a), where we place different -values on the same scale. We discover that certain stock markets form clusters such as on the bottom left (AXJO, BFX, HIS and FTMIB) and upper middle (AEX, FCHI, FTSE, GSPTSE, SPX, TA35) of the space. Other stock markets such as BUX, KSE, OMXS30, SSEC, TWII remain isolated and well separated from the clusters.
To better quantify the differences stated above, we define a distance metric between -triplet pairs as follows [25]:
| (8) |
where the -values are indexed by or for the given pair. We can then construct a distance matrix containing pairwise distances between the 22 stock market -triplets that follow nonextensive statistics. By construction the elements correspond to stock market pairs that share the same -triplet, and perhaps the same underlying dynamical process. The rows and columns (or stock market pairs) of the distance matrix are grouped using a spectral block clustering procedure [32]. Fig. 4(b) reveals that a complex arrangement of -triplet distances () exists between the different stock markets. The matrix consists of blocks of small distances which represent clusters of nearby -triplet values. We also discover that certain pairs of stock market -triplets are separated by a large distance . For example, Taiwan (TWII) is very distant from other Asian stock markets (SSEC, KSE, HSI). China (SSEC) is distant from markets in the Americas (DJI, GSPTSE, SPX), but close to many markets in Asia (KSE and HSI). Sweden (OMXS30) is distant from Asian markets (HSI, KSE, SSEC, TWII) and also from the Euro market (STOXX50E). Many other similar conclusions can be drawn from Fig. 4(b). These nontrivial distances could indicate similarities in nonextensive behavior of the underlying processes that characterize stock market indices.
| Market Index | Market Index | ||||||
|---|---|---|---|---|---|---|---|
| AEX | KSE | ||||||
| AXJO | MMX | ||||||
| BFX | N225 | ||||||
| BUX | NSEI | ||||||
| BVSP | OMXS30 | ||||||
| DJI | PSI | ||||||
| FCHI | PSI20 | ||||||
| FTMIB | SETI | ||||||
| FTSE | SPX | ||||||
| GDAXI | SSEC | ||||||
| GSPTSE | SSMI | ||||||
| HIS | STI | ||||||
| IBEX | STOXX50E | ||||||
| IMOEX | TA35 | ||||||
| IXIC | TASI | ||||||
| JKSE | TWII | ||||||
| KS11 | XU100 |
4 Conclusions
In this work we study the nonextensive behavior of daily volatilities for major stock market indices from to . We find that for many developed countries the corresponding -triplets satisfy the relation [27]. For developing countries the relationship between and reverses and so they cannot be explained by the nonextensive framework. Distances between -triplets are such that many stock markets fall near each other after mapping them to a three-dimensional space. This could be indicative of similar nonextensive dynamics. Some markets are separated by a large distance which implies distinct nonextensive behavior. While not every stock market index may be expected to follow nonextensive statistics, our particular case demonstrates that intermittency, slowly decaying correlations and heavy tailed distributions may be well explained through this novel theory. It remains to be seen whether the proximity of -triplets means similar mechanisms are responsible for stock market dynamics. The current findings suggest that further research should be directed at searching for signs of nonextensivity in other financial systems.
References
- [1] P. Gopikrishnan, V. Plerou, L. A. Nunes Amaral, M. Meyer, H. E. Stanley, Scaling of the distribution of fluctuations of financial market indices, Phys. Rev. E 60 (1999) 5305–5316.
- [2] Y. Liu, P. Gopikrishnan, Cizeau, Meyer, Peng, H. E. Stanley, Statistical properties of the volatility of price fluctuations, Phys. Rev. E 60 (1999) 1390–1400.
- [3] V. Plerou, P. Gopikrishnan, B. Rosenow, L. A. Nunes Amaral, H. E. Stanley, Universal and nonuniversal properties of cross correlations in financial time series, Phys. Rev. Lett. 83 (1999) 1471–1474.
- [4] V. Plerou, P. Gopikrishnan, B. Rosenow, L. Amaral, H. Stanley, A random matrix theory approach to financial cross-correlations, Physica A: Statistical Mechanics and its Applications 287 (3) (2000) 374–382.
- [5] B. Podobnik, D. Horvatic, A. M. Petersen, H. E. Stanley, Cross-correlations between volume change and price change, Proceedings of the National Academy of Sciences 106 (52) (2009) 22079–22084.
- [6] L. Zunino, A. Figliola, B. M. Tabak, D. G. Pérez, M. Garavaglia, O. A. Rosso, Multifractal structure in latin-american market indices, Chaos, Solitons & Fractals 41 (5) (2009) 2331–2340.
- [7] P. Caraiani, Evidence of multifractality from emerging european stock markets, PLOS ONE 7 (7) (2012) 1–9.
- [8] D. Stošić, D. Stošić, T. Stošić, H. E. Stanley, Multifractal properties of price change and volume change of stock market indices, Physica A: Statistical Mechanics and its Applications 428 (2015) 46–51.
- [9] J.-P. Onnela, K. Kaski, J. Kertész, Clustering and information in correlation based financial networks, The European Physical Journal B 38 (2) (2004) 353–362.
- [10] B. Li, D. Pi, Analysis of global stock index data during crisis period via complex network approach, PLOS ONE 13 (7) (2018) 1–16.
- [11] G. Marti, F. Nielsen, M. Bińkowski, P. Donnat, A review of two decades of correlations, hierarchies, networks and clustering in financial markets. arXiv:1703.00485.
- [12] S. Pincus, R. E. Kalman, Irregularity, volatility, risk, and financial market time series, Proceedings of the National Academy of Sciences 101 (38) (2004) 13709–13714.
- [13] L. Zunino, M. Zanin, B. M. Tabak, D. G. Pérez, O. A. Rosso, Complexity-entropy causality plane: A useful approach to quantify the stock market inefficiency, Physica A: Statistical Mechanics and its Applications 389 (9) (2010) 1891–1901.
- [14] C. Tsallis, Economics and finance: q-statistical stylized features galore, Entropy 19 (9).
- [15] C. Tsallis, Possible generalization of boltzmann-gibbs statistics, Journal of Statistical Physics 52 (1) (1988) 479–487.
- [16] T. Stosic, B. Stosic, V. P. Singh, q-triplet for brazos river discharge: The edge of chaos?, Physica A: Statistical Mechanics and its Applications.
- [17] G. Ferri, M. R. Savio, A. Plastino, Tsallis’ q-triplet and the ozone layer, Physica A: Statistical Mechanics and its Applications 389 (9) (2010) 1829–1833.
- [18] L. Burlaga, A. F.-V. nas, Triangle for the entropic index q of non-extensive statistical mechanics observed by voyager 1 in the distant heliosphere, Physica A: Statistical Mechanics and its Applications 361 (1) (2006) 173–179.
- [19] G. Pavlos, A. Iliopoulos, G. Zastenker, L. Zelenyi, L. Karakatsanis, M. Riazantseva, M. Xenakis, E. Pavlos, Tsallis non-extensive statistics and solar wind plasma complexity, Physica A: Statistical Mechanics and its Applications 422 (2015) 113–135.
- [20] G. L. Ferri, A. Figliola, O. A. Rosso, Tsallis’ statistics in the variability of el niño/southern oscillation during the holocene epoch, Physica A: Statistical Mechanics and its Applications 391 (5) (2012) 2154–2162.
- [21] D. B. de Freitas, G. S. França, T. M. Scherrer, C. S. Vilar, R. Silva, Nonextensive triplet in a geological faults system, EPL (Europhysics Letters) 102 (3) (2013) 39001.
- [22] C. Tsallis, M. Gell-Mann, Y. Sato, Asymptotically scale-invariant occupancy of phase space makes the entropy sq extensive, Proceedings of the National Academy of Sciences 102 (43) (2005) 15377–15382.
- [23] U. Tirnakli, C. Tsallis, Chaos edges of -logistic maps: Connection between the relaxation and sensitivity entropic indices, Phys. Rev. E 73 (2006) 037201.
- [24] G. Ruiz, U. Tirnakli, E. P. Borges, C. Tsallis, Statistical characterization of the standard map, Journal of Statistical Mechanics: Theory and Experiment 2017 (6) (2017) 063403.
- [25] D. Stosic, D. Stosic, T. B. Ludermir, T. Stosic, Nonextensive triplets in cryptocurrency exchanges, Physica A: Statistical Mechanics and its Applications 505 (2018) 1069–1074.
- [26] C. Tsallis, Dynamical scenario for nonextensive statistical mechanics, Physica A: Statistical Mechanics and its Applications 340 (1) (2004) 1–10.
- [27] C. Tsallis, Introduction to nonextensive statistical mechanics - Approaching a Complex World, Springer, New York, 2009.
- [28] S. Umarov, C. Tsallis, S. Steinberg, Generalization of the central limit theorem consistent with non-extensive statistical mechanics. arXiv:0603593v4.
- [29] J. W. Kantelhardt, S. A. Zschiegner, E. Koscielny-Bunde, S. Havlin, A. Bunde, H. Stanley, Multifractal detrended fluctuation analysis of nonstationary time series, Physica A: Statistical Mechanics and its Applications 316 (1) (2002) 87–114.
- [30] M. L. Lyra, C. Tsallis, Nonextensivity and multifractality in low-dimensional dissipative systems, Phys. Rev. Lett. 80 (1998) 53–56.
- [31] Z.-Q. Jiang, W.-X. Zhou, Multifractal analysis of chinese stock volatilities based on the partition function approach, Physica A: Statistical Mechanics and its Applications 387 (19) (2008) 4881–4888.
- [32] I. S. Dhillon, Co-clustering documents and words using bipartite spectral graph partitioning, in: Proceedings of the Seventh ACM SIGKDD International Conference on Knowledge Discovery and Data Mining, KDD ’01, ACM, New York, NY, USA, 2001, pp. 269–274.