The nature of PISN candidates: clues from nebular spectra
Abstract
A group of super-luminous supernovae (SL-SNe) characterised by broad light curves have been suggested to be Pair Instability SNe (PISNe). Nebular spectra computed using PISN models have failed to reproduce the broad emission lines observed in these SNe, casting doubts on their true nature. Here, models of both PISNe and the explosion following the collapse of the core of a very massive star ( ) are used to compute nebular spectra, which are compared to the spectrum of the prototypical PISN candidate, SN 2007bi. PISN models are confirmed to produce synthetic spectra showing narrow emission lines, resulting from the confinement of 56Ni to the lowest velocities ( km s-1) and in clear disagreement with the spectrum of SN 2007bi. Spectra more closely resembling SN 2007bi are obtained if the PISN models are fully mixed in abundance. Massive core-collapse models produce enough 56Ni to power the light curve of PISN candidates, but their spectra are also not adequate. The nebular spectrum of SN 2007bi can be successfully reproduced if the inner region is artificially filled with oxygen-rich, low-velocity ejecta. This most likely requires a grossly aspherical explosion. A major difference between PISN and massive collapse models is that the former emit much more strongly in the NIR. It is concluded that: a) current PISN candidates, in particular SN 2007bi, are more likely the result of the collapse and explosion of massive stars below the PI limit; b) significant asymmetry is required to reproduce the late-time spectrum of SN 2007bi.
keywords:
supernovae: general – supernovae: individual (SN 2007bi, SN 2015bn) – techniques: spectroscopic – radiative transfer1 Introduction
The class of SLSNe has been defined to include SN events that reach mag (Gal-Yam, 2012). This paper divided SLSNe into three spectro-photometric sub-classes.
SLSNe-II show strong H lines in emission, and are likely to be the result of the interaction between energetic SN ejecta and a massive, extended, H-rich circum-stellar medium (CSM), just like SNe IIn, which are only different by reaching a lower luminosity (for a primer on SN classification, see Filippenko, 1997).
Other SLSNe have Type Ib/c spectra, and were divided by Gal-Yam (2012) into two groups. One, by far the dominant one by number, called SLSN-I, includes SNe that show absorption lines of heavy and intermediate-mass (IME) elements, similar to SNe Ic (Pastorello et al., 2010). Recently, a more accurate determination of the luminosity above which SNe start to show SLSN characteristics has been determined as mags (De Cia et al., 2018; Quimby et al., 2018). Their evolution follows a common pattern (Nicholl et al., 2013), and the most unusual feature is the presence of a set of strong O ii lines in absorption at blue wavelengths before peak. These lines arise from very highly excited levels, which require a non-equilibrium population such as could be achieved if non-thermal ionization/excitation processes are active (Mazzali et al., 2016). Such non-thermal processes may be due to deposition of radioactive decay products as in SNe Ib (Lucy, 1991), but the higher energetic requirements for O ii and the unrealistically large 56Ni mass required to fit the light curves of some SLSNe-I suggest that X-rays from the shock induced in the ejecta by the interaction with a magnetar-driven wind may be responsible for the overexcitation of O ii (Mazzali et al., 2016). Magnetar wind impact models are commonly used to reproduce SLSN-I light curves as an alternative to radioactive driving: interaction with a magnetar-driven wind could explain the high luminosity of SLSNe-I, some of which seem to decline rather sharply some time after peak, making it difficult to explain the high luminosity as due entirely to 56Ni. Models of SLSN-I light curves based on the magnetar impact model have typically assumed a very small mass of 56Ni (Woosley, 2010; Kasen & Bildsten, 2010). Mazzali et al. (2016) found that SLSNe-I may have a large range of ejected masses, but are typically characterised by a value of the ratio of explosion kinetic energy (EK) and ejected mass (M) close to EK/M [ erg/]. They also claimed that He may be present is some SLSNe-I ejecta. This would be supported also by the detection of H emission lines due to CSM impact in at least three cases (Yan et al., 2017). Interestingly, a luminous SN, which shares some spectroscopic properties with SLSNe-I although it did not reach mag and it had higher , was found in association with one of the few known cases of Ultra-Long Gamma-ray Bursts (GRB), and the only case for which spectroscopic observation of a SN bump were possible (Levan et al., 2014; Greiner et al., 2015).
This leaves us with the smallest group of SLSNe, which Gal-Yam (2012) defined as SLSN-R, for radioactive. This group includes only a small number of SNe, notably SN 2007bi, SN 1999as, the first SLSN observed (Knop et al., 1999), PTF12dam (Nicholl et al., 2013), SN 2015bn (Jerkstrand et al., 2016; Nicholl et al., 2015), and PS1-14bj (Lunnan et al., 2016). While also showing SN Ic spectra, these SNe decline slowly in luminosity, following the 56Co decline rate, and are not known to show O ii lines early on (but early observations are scarce and the rise time is highly uncertain). Their high luminosity implies a large 56Ni mass (typically a few ), and their extended light curves lead to estimates of the ejecta mass of several dozen . The best observed member of this class (and one of the very few known altogether) is still SN 2007bi (Gal-Yam et al., 2009). This SN was hypothesised to be the result of the PI explosion of a very massive star (Gal-Yam et al., 2009). This interpretation was based on finding a large ejected mass from both the extended light curve and the emitting mass inferred from the analysis of emission lines in nebular spectra obtained at late time (more than one year after maximum), but it has been challenged because the time of maximum may not be as late as claimed by Gal-Yam et al. (2009), such that the light curve may not be as broad as taht of PISN models, and because other SLSNe-I whose light curves are not broad show similar spectra (Nicholl et al., 2015).
On the theoretical side, Moriya et al. (2010) suggested that SN 2007bi may be explained as the collapse of a very massive star. They were able to match the light curve of SN 2007bi with such a model, but did not address its spectroscopic properties, so the suggestion remained unverified. As various groups have been developing physically based PISN explosion models that were not available at the time of Gal-Yam et al. (2009), attempts have been made to compute nebular spectra from these models. In particular, Jerkstrand et al. (2016) showed that PISN explosion models yield nebular spectra characterised by narrow emission lines, which do not match those of SN 2007bi, casting further doubt on the nature of this and other SLSN-R.
Determining the properties of PISN candidates is important in order to understand the most massive stellar explosions and ultimately their impact on the Universe.
In this paper we compare PISN and massive core-collapse models in their ability to match the observed late-time spectra of SLSN-R. Nebular-phase spectra are ideally suited for the task of exploring the massive progenitors of SLSN-R, as only at that epoch can we probe the entire ejecta. We extend the study to the near-infrared (NIR), which turns out to be a critical spectral region. We use models in their original version, but proceed to show how they need to be modified in order to match the data. In a parallel paper (Moriya et al., 2019) we study the early phase of PISN candidates.
In Section 2 we briefly discuss the data used for the comparison. In Section 3 we describe our modelling code and strategy. In Section 4 we present synthetic spectra computed using the selected explosion models. In Section 5 we show how PISN models can be modified to improve the fit to the data. In Section 6 we do the same for massive core-collapse models, showing that they match the spectra of SLSN-R very well, including the NIR, if some modification is introduced. In Section 7 we discuss our results. Section 8 concludes the paper.
2 The Dataset
Very few nebular spectra of PISN candidates are available. Two spectra of SN 2007bi were published by Gal-Yam et al. (2009), and they remained the only available nebular spectra of a SLSN-R for quite some time. Recently, as observational efforts have increased, a few more PISN candidates have been observed in the nebular phase. One of the best examples is SN 2015bn (Nicholl et al., 2015; Jerkstrand et al., 2016). The SN has good optical spectra but also (noisy) NIR data, which are useful. Here we focus on SN 2007bi, the first PISN candidate.
A VLT-FORS spectrum of SN 2007bi was obtained on 10 April 2008 (PI Mazzali) and was published in Gal-Yam et al. (2009). The epoch of the spectrum is 367 rest-frame days after a poorly defined light curve maximum. The spectrum has recently been re-calibrated by Jerkstrand et al. (2016), who applied an improved subtraction of the host galaxy. We use their calibration here. The newly established flux levels lead to a new determination of the 56Ni mass. We adopt a distance modulus mags (corresponding to a distance of 592 Mpc), and reddening mags.
The spectrum displays a number of emission lines, mostly forbidden, of elements ranging from oxygen to iron. The strongest optical lines can be identified as in Mazzali et al. (2010) as, from blue to red: Ca ii H&K; Mg i] 4570; [Fe ii] 5159, 5262, 5273, 5334, 5376 in a broad blend; O i 5573; [O i] 5577, 6300, 6363; Na i D; Ca ii] 7291, 7324; O i 7773. Mazzali et al. (2010) provide also line identifications in the near-infrared, which apply to our models below.
3 Modelling approach
| Model | M | EK | EK/M | Ni | C | O | Ne | Mg | Si | S | Ca |
|---|---|---|---|---|---|---|---|---|---|---|---|
| M100 | 94 | 4e52 | 0.45 | 3.1 | 5 | 46 | 4 | 4 | 18 | 9 | 1 |
| M110 | 100 | 5e52 | 0.52 | 9.1 | 5 | 38 | 4 | 4 | 21 | 12 | 2 |
| M30E30 | 33 | 3e52 | 0.91 | 4.5 | 1 | 14 | 1 | 1 | 5 | 3 | 1 |
We computed nebular-epoch spectra using our non-local thermodynamic equilibrium (NLTE) code. The code was described in Mazzali et al. (2008). It is based on the method outlined by Axelrod (1980). The code computes the emission, propagation and deposition of gamma rays and positrons from 56Ni and 56Co decay using a Monte Carlo method, as outlined in Cappellaro et al. (1997). The energy deposited is used to excite and ionize the gas via collisions. The heating is then balanced by cooling via emission in (mostly) forbidden lines. The code assumes microscopic composition mixing within a radial density zone and can implement ejecta clumping. This feature was not used in most of the ejecta, but it was necessary to introduce mild clumping (filling factor ) in the 56Ni-rich regions in order to suppress the presence of Fe iii via recombination. This is common to all SN Ib/c nebular models (Mazzali et al., 2010). At the late epochs of the nebular spectra, 56Ni has almost completely decayed, but cobalt does not show strong emission lines. Iron is therefore the best tracer of the initial 56Ni content. In a PISN, which is a thermonuclear explosion, as in SNe Ia, matching both Fe emission lines and lines of elements that are not the product of radioactive decay makes it possible to estimate both the heating (hence the 56Ni mass) and the cooling (which is caused by all emitting species), and thus to evaluate simultaneously both the 56Ni mass and the mass of the ejecta, at least in those regions that are affected by collisional heating (i.e., regions close to the location of 56Ni).
The profiles of the emission lines are indicative of the spacial distribution of the emitting elements. Deviations from spherical symmetry can be appreciated from the deviation of line profiles from the expected one-dimensional profile (e.g., Mazzali et al., 2005).
We used three different explosion models: two PISN models, M100 and M110, from S.E. Woosley (the names indicate the mass of the He core, see Heger & Woosley, 2002, and in this case these models correspond to main-sequence stars of ), as well as a massive () core-collapse SN model, originating from a star model from Umeda & Nomoto (2008). These explosion models were selected because they synthesize of 56Ni, similar to the value estimated for SN 2007bi if it is assumed that its light curve is entirely powered by radioactivity (Moriya et al., 2010). All models are one-dimensional, as is our spectrum synthesis code, and are characterised by a ratio of kinetic energy of expansion and ejected mass of EK/M – 1 [ erg ]. A ratio of was shown to be adequate for SLSN-I (Mazzali et al., 2016), which however show a great variety in M and M(56Ni). PISN models uniquely predict kinetic energy and nucleosynthesis. As for the massive collapse model, we explodesd it with an explosion energy . This produces a 56Ni mass of ), similar to the value required to power SN 2007bi (Moriya et al., 2010). The ejecta structure and composition are based on the results obtained by Moriya et al. (2010). We call this massive core-collapse model M30E30. Table 1 lists the most important properties of the three models.
First we computed synthetic spectra at the estimated epochs of the nebular spectrum of SN 2007bi using the density and abundance distribution of the original models. The results are compared to the available spectra, and their strengths and weaknesses are discussed. We then arbitrarily modified the models, showing that simple modifications, which may be physically motivated, can lead to much improved fits.
4 Synthetic spectra
We computed synthetic nebular spectra for the three explosion models, two PISN and one massive collapse. In order to make a comparison to observed spectra of PISN candidates possible, we show the models at the distance and reddening of SN 2007bi. In our calculations we used a fiducial epoch of 435 days from explosion following Gal-Yam et al. (2009), but see Nicholl et al. (2016) for a possibly different estimate of the rise time of SN 2007bi. Adopting a shorter rise time, as is done, e.g., in the companion paper presenting spectra for the early, photospheric phase of a massive energetic collapse model and matching them to SN 2007bi (Moriya et al., 2019) would lead to higher flux in the synthetic spectra and therefore to a smaller estimate of the 56Ni mass required for SN 2007bi.
4.1 PISN models
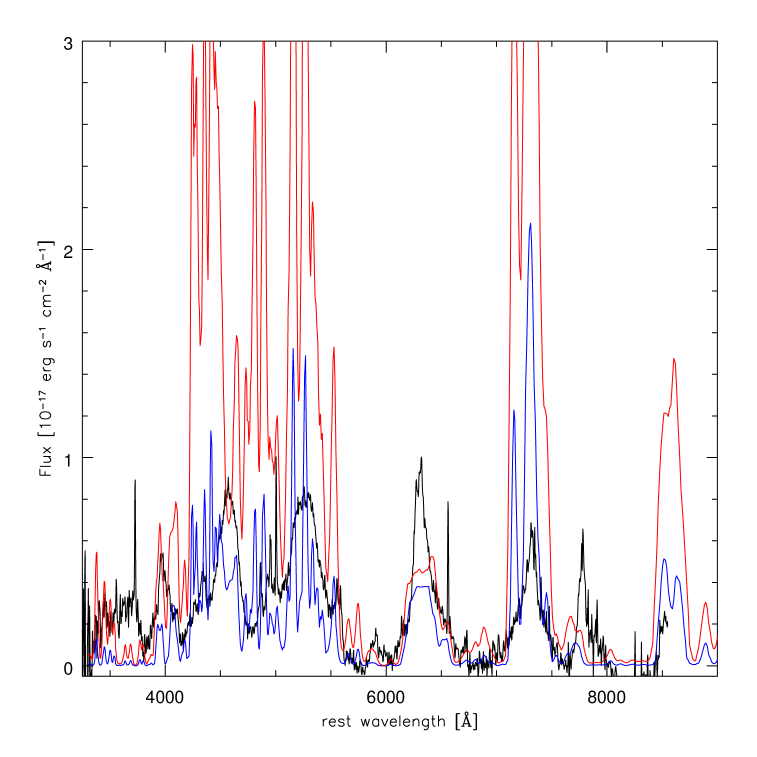
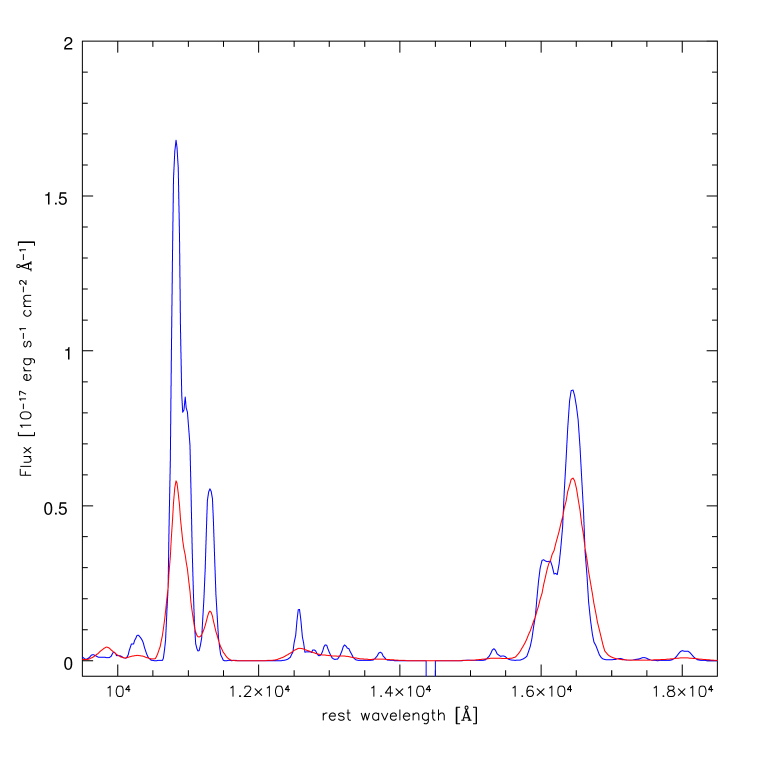
The synthetic nebular spectra of the two PISN models, M100 and M110, are shown in Fig. 1 and compared to the VLT nebular spectrum of SN 2007bi. It is immediately clear from Fig. 1 that the match between synthetic spectra and observations is not satisfactory, primarily because the synthetic spectra have narrow lines in most species, notably Fe. This is because in both models almost all 56Ni is concentrated at the lowest velocities, below 3000 km s-1. This confirms the findings of Jerkstrand et al. (2016). Additionally, model M110 appears to be much too luminous for SN 2007bi. The flux of model M100 appears to be closer to the observed spectrum of SN 2007bi, but see caveat above for the effect of a shorter risetime.
On the positive side, many of the lines that are predicted to be strong in the synthetic spectra of the two PISN models are also observed in SN 2007bi. Most notably, the [O i] 6300, 6363 line is quite strong. The synthetic line is broad, reflecting the distribution of oxygen, but - interestingly - it is truncated at the lowest velocities and shows a flat top. This is the result of the fact that no oxygen is present in the low-velocity, inner part of the PISN ejecta, where 56Ni dominates, and so the low-velocity emission peak is suppressed.
4.2 Massive core-collapse models
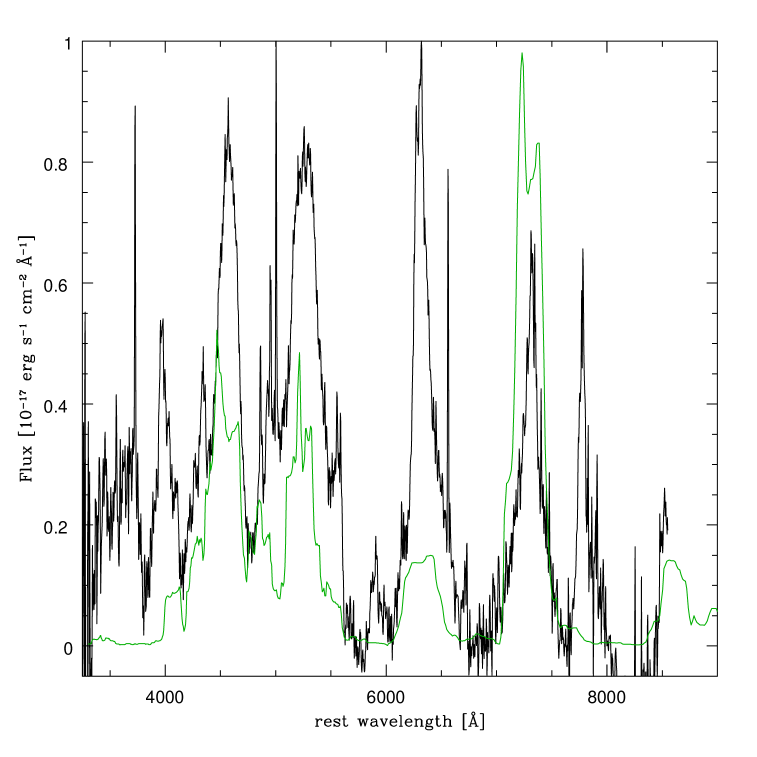
The synthetic nebular spectrum obtained from model M30E30 is shown in Fig. 2. This spectrum shows much broader lines than the ones derived from the PISN models. This is true in particular of the [Fe ii] emission feature near 5200 Å, reflecting the broader distribution of 56Ni. The synthetic spectrum shows strong lines of Mg i] 4570 and Ca ii] 7291, 7324, as well as [Fe ii] lines. The [O i] 6300, 6363 line is present, but quite weak, and again it shows a flat top, reflecting the lack of oxygen at low velocities in the model. Model M30E30 has a similar 56Ni mass as M100 ( ), but a much smaller M, 32.5 , and consequently a much smaller oxygen mass, 14 . Overall, this spectrum seems better suited to match SN 2007bi than the ones based on PISN models, although its flux is too low in most lines, suggesting that the 56Ni mass in this particular model may be too small. The flux is somewhat weaker than that of the PISN model M100 in the optical, but PISN models include significant amounts of IME (Si, S), which cool the gas and radiate effectively in the NIR. This leads also to the weakness of the [Fe ii] lines. The NIR is therefore an essential part of the spectrum if we want to differentiate among different models.
4.3 The near-infrared
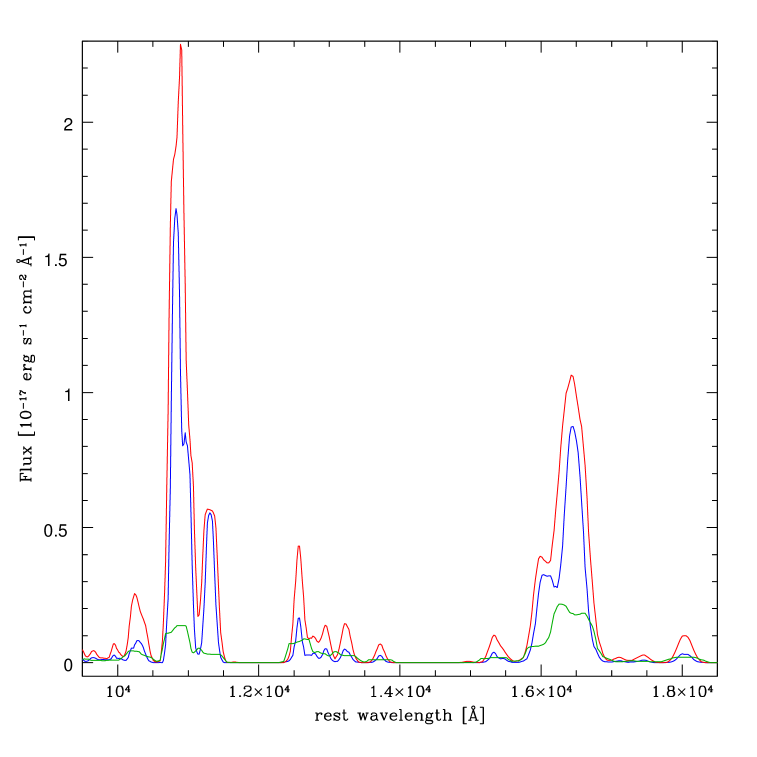
In Fig. 3 we show the predicted NIR behaviour of the three models we have considered. The two PISN models emit strongly in a few IME lines: [S i] , [Si i] , and show narrow [Fe ii] lines, e.g., near .
The massive collapse model M30E30, on the other hand, has only weak flux in the NIR. The IME content of this model is much smaller. Lacking IME cooling, which takes place mostly via NIR emission lines, the MCC model cools much more efficiently via optical emission lines such as [O i] and [Fe ii]. Therefore a smaller oxygen mass, excited by a similar 56Ni mass, is sufficient to produce an [O i] 6300, 6363 line of strength comparable to that of the PISN models, even though these have a much larger oxygen mass.
Unfortunately, no NIR data are available for SN 2007bi, making a direct comparison impossible. Some data are available for SN 2015bn, but the lines of interest fall mostly in the atmospheric gaps because of the redshift of SN 2015bn (Jerkstrand et al., 2016). We will investigate SN 2015bn in separate work.
5 Optimization of PISN models
PISN Model M100 has an adequate 56Ni mass to explain the light curve of SN 2007bi, but the flux in the synthetic nebular spectrum is not properly distributed. The emission lines in SN 2007bi are rather broad (FWHM km s-1), while the synthetic spectra obtained from both PISN models are characterised by narrow emission lines.
In order to obtain broader emission lines without changing the overall density structure of the ejecta, one strategy is to mix the ejecta in abundance, without modifying the density structure. This commonly used approach to mixing is rather artificial, as a different density structure may result from abundance mixing, and it is not supported by PISN calculations, but it is useful as a test to highlight differences between the results of first principles, one-dimensional PISN models and the spectrum of SN 2007bi.
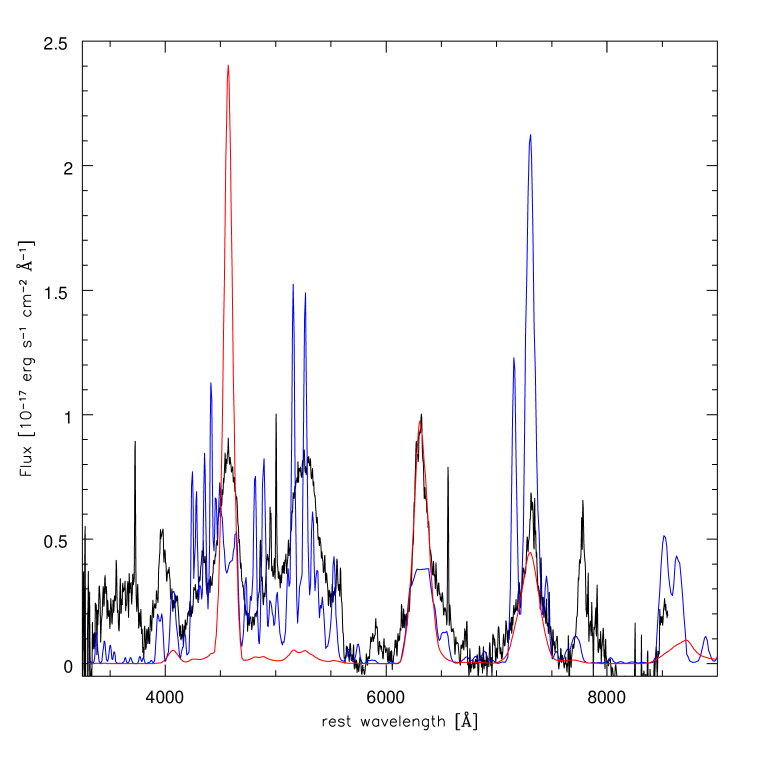
The results of fully mixing model M100 in abundance are shown in Fig. 4. It is interesting to note that when mixing is applied cooling takes place in totally different lines than in the original model, which is very sharply stratified in abundance. When microscopic abundance mixing is introduced, at optical wavelengths light and intermediate mass (IME) elements such as O, Mg, and Ca contribute most of the cooling, as they are now in close contact with 56Ni heating. Cooling happens mostly in three lines: Mg i] 4570 Å, [O i] 6300, 6363 Å, and Ca ii] 7291, 7324 Å, as shown by the spectrum drawn in red in Fig. 4. The Mg i] line matches in wavelength a strong emission in the spectrum of SN 2007bi, suggesting that the observed line is indeed Mg i] 4570 Å, and far exceeds the strength of the observed feature. The [O i] 6300, 6363 Å line matches the observed one amazingly well, considering that no effort was made to fit the observations: this suggests that the density structure of this model can describe SN 2007bi and that the ratio of radioactive heating and cooling via O i is also adequate. Finally, the Ca ii] 7291, 7324 Å line also matches the observed line quite well, the only shortcoming being that its flux is slightly smaller than the observed one.
Compared to the model with the original abundance stratification, the intensity in the Mg i] line is stronger, because Mg is now present at low velocities, close to the bulk of 56Ni; the O i] line is stronger, in particular at the smallest velocities, and it no longer has a flat-top profile, for the same reason, while the Ca ii] line is weaker, because calcium, an IME, was already located next to 56Ni in the original, stratified model, but when full mixing is introduced it competes with lighter elements, such as Mg and O, for cooling.
The species that is mostly affected by the increased cooling in light and intermediate-mass elements is actually iron. The Fe ii] emission lines are now much weaker, as can be seen in Fig. 4. On the other hand, abundance mixing means that 56Ni is also present at all velocities, which leads to broader, blended [Fe ii] emission lines. 111The same effect is responsible for the broadening of Fe emission lines in SNe Ia (Mazzali et al., 1998). In particular, a broad [Fe ii] emission feature is now present near 5200 Å. This matches in wavelength an observed emission in SN 2007bi, but the synthetic feature is much too weak. This is because too much of the cooling occurs via lighter elements than Fe, suggesting that the ratio of 56Ni and ejected mass is too small in the PISN models.
The match to the observed optical spectrum of SN 2007bi is greatly improved by introducing abundance mixing, but the synthetic spectrum is still far from satisfactory in the optical, especially because of the weak iron emission. Further improvements could be obtained by modifying the composition of the ejecta. In particular, increasing the 56Ni mass would lead to more emission in [Fe ii] lines. Correspondingly, however, the O and Ca mass would have to be reduced to avoid excessive cooling. This would reduce the overall mass to below the nominal value of the model, and is therefore not an acceptable solution. The abundance of Mg would also need to be drastically reduced. Another option would be to introduce stable Fe to support the cooling. A model based on the density of M100, with an increased 56Ni mass of and containing some of stable Fe would reproduce the observed spectrum reasonably well, but the synthesis of large amounts of stable Fe is not foreseen in PISNe (Heger & Woosley, 2002).
The NIR spectrum of model M100 is also affected by the mixing, as shown in Fig. 5. As was the case for Ca in the optical, the emission in Si and S, which are both IME, is reduced, as other, lighter species compete for cooling the ejecta. Overall, more cooling occurs now in the optical and less in the NIR. No NIR spectrum is available for SN 2007bi.
The interesting results obtained from mixing the ejecta composition do not add strong support to the PISN interpretation for SN 2007bi. However, they suggest that composition mixing, especially of 56Ni, and of lighter elements such as oxygen and magnesium, is necessary to obtain emission lines similar to those observed in SN 2007bi. At the very least, some 56Ni must be present at relatively high velocities, in order to broaden and blend the Fe lines, and some oxygen must be present at low velocities in order to reproduce the observed [O i] 6300, 6363 Å emission profile. Available one-dimensional PISN models do not seem to possess the necessary characteristics. Multi-dimensional models are unlikely to be drastically different, as the PISN event is essentially a detonation, and large mixing is not expected in this case (Chen et al., 2014).
6 Optimization of the massive core collapse model
As we have shown above, the massive core collapse (MCC) model produces a nebular spectrum with features that resemble SN 2007bi, including the broad [Fe ii] emission lines, a broad but weak [O i] line and strong [Ca ii] lines (see Fig. 2). Additionally, it has a weak NIR flux, which sets it apart from PISN models (see Fig. 3). Here we look at possible modifications of this model that can improve its ability to reproduce the nebular spectrum of SN 2007bi.
The 56Ni distribution in the MCC model M30E30 is not as narrowly confined in velocity as it is in the PISN models, as shown by the width of the emission lines. A clear shortcoming is however the truncation of the [O i] line, which reflects the lack of oxygen at the lowest velocities. This is not just a problem of abundance mixing. Model M30E30 is one-dimensional, and it has a “hole” in density below km s-1. This is by definition, as the mass cut in the one-dimensional model is set at the corresponding mass to eject an adequate 56Ni mass to account for the SN light curve, while the mass below this minimum velocity is assumed to be captured in the compact remnant.
However, this is not physically correct, as material with velocity just larger than the escape velocity from the remnant () should eventually be ejected with a velocity close to zero. In addition, multi-dimensional motions can move ejecta back to the inner layers. Therefore the “hole” is likely to be just the result of the one-dimensional explosion calculation.
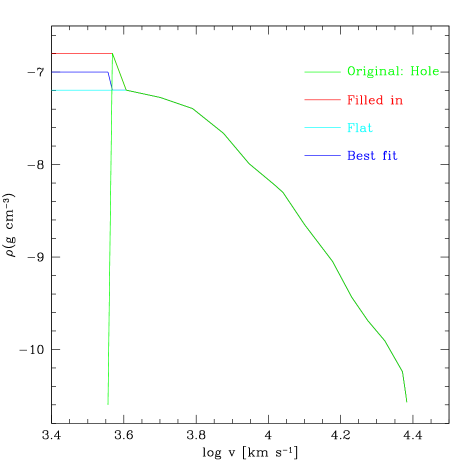
The first modification we implemented was therefore to fill the inner hole with additional ejecta. We looked at several possibilities, as regards both density and abundances. The various density profiles we used are shown in Fig. 6. It can be seen in that figure that the original density profile rises smoothly to lower velocities but has a spike between 3700 and 3600 km s-1, followed by a very sharp drop. No mass is present below a velocity of 3600 km s-1. This is the “hole” mentioned above.
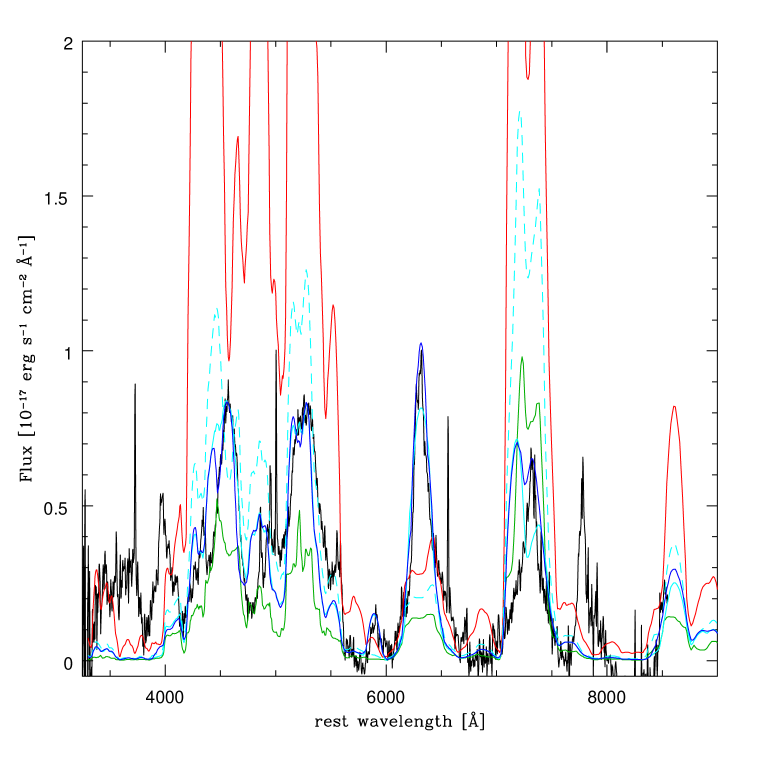
In Fig. 7 the synthetic spectrum plotted in green is that obtained from the original model. It was also shown in Fig. 2. As we discussed above, it shows broad lines, but is too weak in flux and has a truncated [O i] line.
The first modification we implemented was therefore to fill in the hole with constant density ejecta, starting from the onset of the hole in the original model. Initially, we applied to the newly filled innermost layers the same abundances that characterise the original model in the layers just above the hole. This implies that 56Ni is by far the dominant element in the newly created innermost ejecta. Because of the high density in these innermost layers, this model (shown in red in Figures 6 and 7 and termed “filled in”) contains much too much 56Ni (), and the synthetic spectrum obtained from it is much too luminous. The ejected mass also increases to M . Increasing the 56Ni mass leads to a larger luminosity, but does not solve the problem of the weakness of the [O i] line as oxygen is located too far from 56Ni to be heated by radioactive decay products, which do not travel very far in the dense environment of the inner core. Furthermore, because no oxygen has been added in the inner zones, the [O i] line still lacks the low velocity core. It is now double-peaked rather than flat. This is not because the two individual components are separated, but mostly a geometrical effect: the large amount of 56Co decay energy available is carried mostly by gamma rays. At late times gamma rays can partially penetrate into the innermost oxygen layers and thermalise there. The thermalization process leads to excitation of the levels from which the line is emitted. However, ejecta regions lying further out are still shielded from gamma rays, and so collisional excitation does not take place and neither does forbidden line emission. The presence of an emitting oxygen shell results in a profile lacking central (low-velocity) emission, such as what the models produce. Additionally, the fact that decay from the upper level results in two emission lines separated by only 63 AA also contributes to the observed red-to-blue peak ratio. We therefore must abandon the idea that the inner layers contain 56Ni only.
Next, we fill the inner hole but at the same time we eliminate the spike in density between 3600 and 3700 km s-1. We call this density profile “Flat”. We still extend into the newly created innermost layers the same abundances that characterise the original model in the inner layers that have been preserved for this particular density profile (now near 3700 km s-1). With this procedure, 56Ni is still the dominant element in the innermost region. Its density profile is plotted in light blue in Figure 6. The model has M , and a 56Ni mass of 8.0 . The synthetic spectrum computed using this density profile is shown as the dashed light blue line in Figure 7. The synthetic spectrum has too much flux in the [Fe ii], Mg i], and Ca ii] lines, while the [O i] line is too weak and still shows a flat top. The oxygen mass is 15 , but oxygen is mostly well separated from 56Ni.
As it is clear that the problem lies with the oxygen distribution, we then tested mixing some oxygen down into the inner zones. To achieve this, we modified the inner abundances of the “Flat” model from purely 56Ni to two thirds 56Ni and one third oxygen, and also reduced the calcium abundance. This density profile still has an ejected mass M , but the 56Ni mass is now 5.6 , less than in the “Flat” model but more than in the original model M30E30, which could not reproduce the observed flux. The total oxygen mass is now . The resulting spectrum is plotted as the light blue line in Figure 7. This synthetic spectrum has interesting features. First, the [O i] line now has the correct shape, which proves that there must be oxygen down to the lowest line-of-sight velocities. The line is only slightly too weak in flux. Secondly, the [Fe ii] lines produce a smooth blend near 5200 Å, which reproduces quite closely that of SN 2007bi, confirming that a 56Ni mass of is required to match the spectrum of SN 2007bi. This 56Ni mass matches the mass estimated from the light curve (Moriya et al., 2010). A slightly larger M, leading to a stronger [O i] line, should reproduce the observations.
Finally, we produce an ad-hoc model to achieve a best fit. This is done by fixing the density in the inner hole to a value intermediate among those used above, while keeping the increased oxygen abundance. The density profile and the corresponding synthetic spectrum of this “best fit” model are shown as dark blue lines in Figures 6 and 7. Neither the density profile nor the resulting synthetic spctrum are very different from the “Flat” model with low-velocity oxygen described just above. The “best fit” model has M , M(56Ni) , which guarantees a more luminous spectrum, and an oxygen mass of . The presence of oxygen at low velocities forces significant cooling via [O i] 6300, 6363 Å. The synthetic spectrum matches most features quite nicely. In particular, the [Fe ii], Mg i], and [O i] lines are quite well reproduced, although some Fe ii] lines are stronger than the observed ones and the Ca ii H&K emission is not reproduced, assuming that is indeed the feature seen near 4000 Å in SN 2007bi. This may indicate that the density of Ca is higher than in our model.
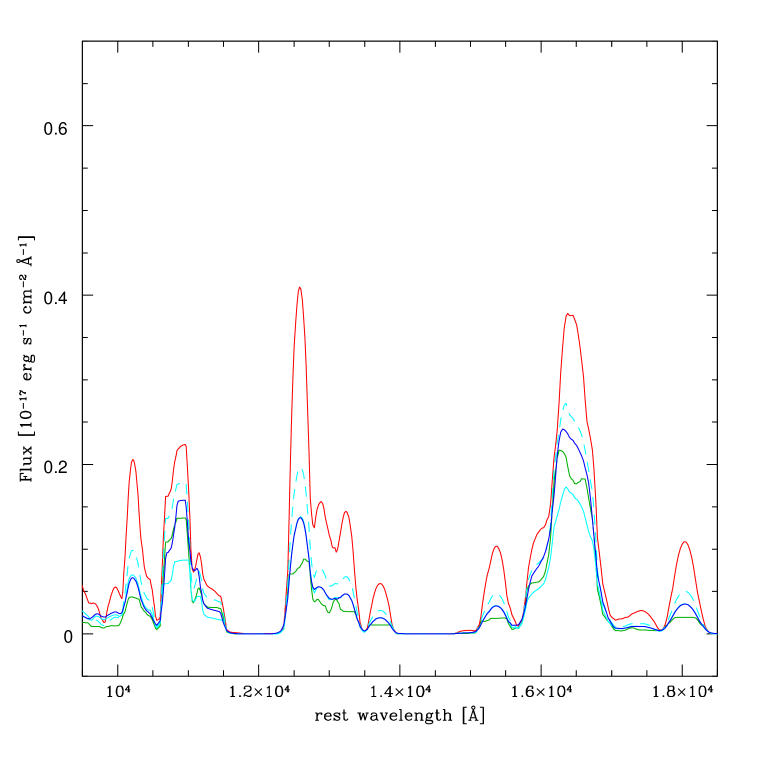
We turn now to the NIR. The four models we discussed are shown with the same colour-coding in Fig. 8. The synthetic spectrum with a filled-in hole (red) has very strong NIR emission, a consequence of the very large 56Ni mass, while the “optimal” model, with only a slightly higher inner density and enhanced oxygen content, is not very different from the synthetic spectrum of the original model M30E30. This is because, as more heating goes into oxygen at low velocity, the IME, which are located further out and dominate emission at NIR wavelengths, are not much affected.
7 Discussion
Our nebular models address the question of the nature of SN 2007bi. We showed above that neither the PISN nor the MCC models produce good fits to SN 2007bi if they are used without modification. All the models we used are one-dimensional calculations. PISN model He100 appears to be better suited to match SN 2007bi than the slightly more massive but much more luminous model He110, mostly because of the amount of 56Ni synthesised. However, both models produce very narrow emission lines, which do not resemble the nebular spectrum of SN 2007bi. The PISN model (we focussed on He100) can be improved by thoroughly mixing the ejecta in abundance. This leads to a synthetic spectrum with broader emission lines, in line with SN 2007bi, but a theoretical justification for this mixing is lacking. Furthermore, the very large content of both oxygen and IME leads to strong emission lines of O i, Mg i, Si i, and S i, all at the expense of the Fe ii lines, which are very weak, in sharp contrast with the spectrum of SN 2007bi. These problems might be alleviated if the PI explosion were grossly asymmetric with e.g., the iron group coming out at high speed at high latitudes and the oxygen ejected more slowly near the equator, as has been inferred for GRB/SNe (Mazzali et al., 2001). However, there is no compelling reason to think that PISN are asymmetrical. Most of the angular momentum would be in the outer layers, and only grossly differential rotation might produce an asymmetric bounce, but magnetic torques are generally thought to suppress such strong differential rotation. More work is needed to clarify thiese issues.
The MCC model has more intrinsic mixing, and so it naturally produces broader lines, but in its original version it too has a number of problems. Its main shortcoming is that the [O i] 6300, 6363 Å, one of the strongest lines in the spectrum of SN 2007bi, shows a flat top in the synthetic spectrum, while it is quite sharp in SN 2007bi. We showed that this is the direct consequence of the presence of a central “hole” in the density distribution. This “hole” may be the result of the one-dimensional calculation upon which the model is based. Filling in the “hole” leads to much improved fits ONLY if the innermost region contains oxygen to a significant fraction (about one third by mass). This is a challenge for one-dimensional models, and a strong indication that IF the MCC model is adopted for SN 2007bi the explosion must have been highly aspherical, such that oxygen was synthesised at low velocities. This would not be unheard of for massive core collapse explosions. There is ample evidence that the explosions that give rise to luminous and energetic SNe Ic (sometimes associated with Gamma-ray Bursts) are significantly aspherical. For the prototypical GRB/SN, SN 1998bw/GRB980425, a narrow [O i] emission accompanied by broad iron emissions also pointed to the presence of oxygen at low velocities, possibly in a disc-like structure viewed close to face-on, such that oxygen has a small line-of-sight velocity (Mazzali et al., 2001). For other SNe, this structure is indeed observed on its plane, leading to a strong [O i] line characterised by the presence of two widely separated peaks (Mazzali et al., 2005). This morphology indicates quite an aspherical explosion. Whether this is necessary also in SN 2007bi is difficult to tell, as there are no other indicators of asphericity. Yet, it has been pointed out that the spectra of this SN resemble those of SN 1998bw at late times (Jerkstrand et al., 2016).
Another major discriminant between the two scenarios is the explosion EK. It has been claimed that explosion EK is a function of M for SNe Ic at least (e.g., Mazzali et al., 2017), and there is no doubt that the mass of the ejecta in SN 2007bi far exceeds that of any other well studied SN Ic, so it is quite possible that the EK is also high. Our calculations do suggest a high EK, but still retaining EK/M. This is different from SNe Ic, where EK/M grows more than linearly with mass. The origin of the EK in these explosions is unclear. In the PISN scenario thermonuclear burning of the massive progenitor produces a large EK, and does so roughly proportionally to the mass (Heger & Woosley, 2002), which is the appealing feature of this scenario. The energization of core-collapse SNe remains an unsolved problem. For GRB/SNe the collapsar model (MacFadyen & Woosley, 1999) could potentially lead to energetic explosions via a neutrino-driven disc wind, but the link is not fully explored. In a normal core-collapse event, neutrinos emitted in the neutronization of the nascent neutron star may energise the ejecta, but it is unlikely that they can enforce the very large energies observed in GRB/SNe, and possibly also the observed trend of increasing EK with increasing M. Although SNe Ib/c are generally consistent with being aspherical (e.g., Maeda et al., 2008; Taubenberger et al., 2009), it is unlikely that this asphericity is caused by a jet, as GRB jets carry much less energy than the SNe themselves (Mazzali et al., 2014), and they do not need to use much energy: erg is sufficient to penetrate a compact star (Lazzati et al., 2013), which is much less than the inferred EK of GRB/SNe. The suggestion was made by Mazzali et al. (2014) that rapid energy injection from a magnetar could energise the explosion and produce nucleosynthesis.222This is not the scenario in which a magnetar powers the long-term SN light curve: the presence of strong [Fe ii] emission lines in the nebular phase, constitutes good evidence that SN Ib/c light curves, including GRB/SNe, are driven by the radioactive decay of 56Ni (Mazzali et al., 2001). These lines are a feature of SN 2007bi as well. The energy of the massive collapse model we used is itself compatible with the limiting magnetar energy ( erg), so a similar mechanism could be claimed. One difference between the GRB/SN situation and that of the collapse of a very massive stellar core which could give rise to events like SN 2007bi may be that in the former case the proto-neutron star (proto-magnetar) rapidly collapses to a black hole after depositing its magneto-rotational energy in the surrounding stellar matter, powering the energetic explosion and the synthesis of 56Ni. The black hole then powers jets via accretion. These jets propagate in the already aspherically exploding stellar material, and if they have enough energy to escape they eventually give rise to a GRB. In the case of the massive collapse a black hole may not be formed, making more core material available for the synthesis of large amounts of 56Ni which then powers the SN light curve. Even if a black hole was formed, the exploding stellar core in the MCC explosion that can be made to match SN 2007bi is much more massive than in typical GRB/SNe ( vs. ), making it harder for a jet to escape.
Finally, the two scenarios, MCC and PISN, are likely to synthesize radically different amounts of 56Ni, a feature that may be used to distinguish them. We discuss the two scenarios in turn.
7.1 56Ni: Core Collapse Limits
According to Woosley et al. (2002, see their Fig. 26), the shock temperature achieved at radius in a presupernova star is given, for a given point explosion of energy , by the condition
| (1) |
This equation basically states the dominance of radiation and pairs in providing the pressure behind the shock and that most of the shocked volume is isobaric. This condition can be inverted to give the radius inside of which a given temperature, or greater, is achieved in the explosion,
| (2) |
where is the shock temperature in billions of degrees K. Outside this radius only cooler temperatures are attained. A temperature of K is necessary to achieve nuclear statistical equilibrium on a hydrodynamic time scale and produce iron-group elements (Woosley et al., 2002). The explosion energy in any core collapse supernova is unlikely to exceed erg, the maximum rotational energy for neutron stars without unusual equations of state (although see Metzger et al., 2015, for possibly a higher limit). Hence the production of iron in isotropic explosions is limited to regions with radius smaller than 10,000 km. This is actually a very generous limit on 56Ni since: a) it is unlikely that the full rotational energy of a cold neutron star can be deposited in the time it takes the core to collapse and a shock wave to reach 10,000 km - less than a second; and b) not all the matter ejected from inside this radius will be 56Ni. Roughly half will be helium from photodisintegration. In calculations of erg explosions in massive helium cores, Woosley (2017) found the synthesis of up to 2.7 of 56Ni. In a 16 helium star, Nakamura et al. (2001) found less than 1 of iron produced for explosion energies up to 1053 erg.
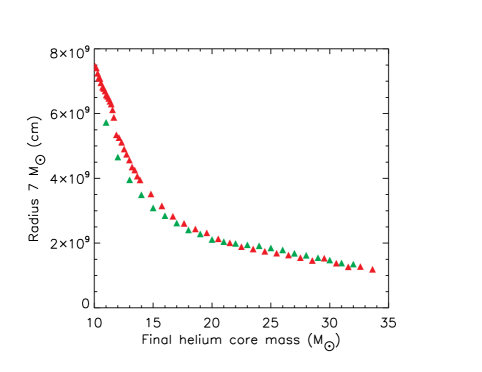
Fig. 9 shows the radius of the mass shell that encloses 7 in a large number of helium stars evolved to the presupernova state, with and without mass loss, using the KEPLER code. Those evolved without mass loss would be appropriate for single stars that do not lose their entire envelope as supergiants. Those with mass loss are more representative of stars in binary systems that lose their envelope shortly after red giant formation, which is assumed here to happen at helium ignition. The models are extracted from a survey in preparation by S. E. Woosley. The value 7 is the sum of an assumed 5 of ejecta plus 2 for the collapsed remnant. Only very massive stars that leave such large remnants are capable of ejecting so much iron.
The figure shows that only for the most massive cores is the critical radius of 10,000 km (Eq. 2) - almost - approached. Given that some of the mass will not be 56Ni and that a supernova with EK erg s-1 sustained for a second is unlikely, 5 of 56Ni ejected seems a strong upper bound for core collapse SNe. Upper bounds of 2 - 3 may be more realistic.
7.2 56Ni: PISN Limits
The only supernova models that have been demonstrated to produce 5 of 56Ni or more are PISNe (Heger & Woosley, 2002). In fact, PISN models can produce up to 57 of it. PISNe occur at zero-age main sequence (ZAMS) masses between and , but below (i.e., He core masses between 65 and 100 ) they do not produce large amounts of 56Ni. The PISN mechanism requires helium cores from 100 to 133 to produce more than 5 of 56Ni, and ZAMS masses roughly twice that. Such very massive stars are quite rare. Producing them may not be so much of a problem as maintaining that large mass until the star dies. One can dial the mass loss down by reducing the metallicity in an uncertain scaling relation, but the existence of such massive SN progenitors lacks observational support. Would Carinae and similar massive stars maintain their original mass if their metallicity were small? Metallicity only affects line and grain opacity, not global instabilities caused by approaching the Eddington limit.
If its light curve and spectra were powered exclusively by the radioactive decay of 56Ni, as the strong Fe lines in the nebular spectra suggest, SN 2007bi synthesised of it. A ZAMS mass of , corresponding to a He core mass of , is required to produce so much 56Ni (Heger & Woosley, 2002) as a PISN. IF SN 2007bi and similar SLSNe are PISNe, where are the other, fainter PISNe, produced at ZAMS masses between 140 and 200 , and the more abundant pulsational PISNe produced by He cores between and 65 (i.e., ZAMS mass between 100 and 140 ) that the distribution of initial masses suggests should exist? Have they possibly not been observed yet because of their intrinsic faintness combined with their relative rarity? Because they neglect mass loss, the main sequence masses assigned to a given final helium core mass by Heger & Woosley (2002) are lower bounds.
Perhaps the strongest evidence right now for a population of massive progenitors are the black holes detected by LIGO (Abbott, 2016), at least one of which probably came from the collapse of a helium core over 35 (Woosley, 2016). It is a long way from 35 to 100 He cores, above which PISNe are expected to eject large amounts of 56Ni. PISNe leave no black hole signature, so they cannot be traced in black hole mergers. The region of predicted low-luminosity PISNe (Heger & Woosley, 2002) is yet unexplored. If SN 2007bi was not a PISN but rather a core-collapse SN, its progenitor (which we estimated here at a ZAMS mass of 100 ) would lie in this thus far unexplored mass range, implying that core collapse SNe can happen at masses where direct black hole formation was thought to be the only outcome.
8 Conclusions
There are pros and cons associated with both scenarios, MCC and PISN, when trying to reproduce the observed properties of SN 2007bi. Can we distinguish between them?
Even if the two mechanisms could produce similar 56Ni mass (but see caveats above), they will have different ejected mass and elemental abundances, in particular as concerns IME. The two most interesting elements in this respect are silicon and sulfur. S i has an emission line in the optical (), which is however blended with other lines, mostly of Fe, and so it is not easy to use it as a proxy for abundance. The NIR is the region where the two models are widely different. PISN models have a very large IME mass in close proximity to 56Ni, which leads to very strong NIR emission lines of [S i] and [Si i]. The MCC model, on the other hand, contains fractionally much less IME, and its NIR flux is therefore much weaker. No NIR data are available for SN 2007bi. SN 2015bn does have data (Jerkstrand et al., 2016) but unfortunately, because of the redshift of the SN, the strongest IME emission lines end up partially overlapping the atmospheric absorption bands. Yet, SN 2015bn does not appear to have very strong emission lines in the NIR, which seems to favour the MCC option also for this SN. Whether SN 2015bn may be regarded as a PISN candidate based on the early-time data only is a different question, which we will address in separate work. Mixing or gross asphericity may obviously affect both models. Given the evidence we obtained from nebular spectroscopy, these issues require further study before conclusions can be reached about the nature of this class of SLSNe.
Three generic mechanisms for SN explosions of massive stars are known: neutrino transport following iron core collapse; rotation, as in magnetar and collapsar models; and pair-instability. If pair instability is ruled out because of lack of mixing, and neutrinos are inadequate to produce an explosion with EK erg, one is left with rotation, in some manifestation, as the surviving explanation for SN 2007bi. This almost certainly implies some degree of asymmetry in the explosion. The strong iron lines at late times indicate the presence of at least some radioactivity in the explosion. The question is could the light curve from 56Ni decay be supplemented to a large extent by magnetar power, reducing the requirement for 56Ni? Could the approximate agreement of iron abundance and the amount of 56Ni needed to explain the light curve be fortuitous? Given the assumption of our nebular analysis (56Ni radioactive powering, Fe coming from 56Ni decay), we feel that our results are solid. Magnetar energy may be used to energise the explosion and aid the synthesis of 56Ni, which then drive the light curve.
Another possibility, which is widely used in the SLSN literature, is to involve circumstellar interaction. In the case of SN 2007bi the circumstellar material should be H- and He-free, as no characteristic emission lines are seen. The time dependence of the interaction should also be tuned to mimic the effect of radioactive decay of 56Co, which also appears rather unlikely.
No complete calculation of magnetar formation and 56Ni production exists, and depositing a large fraction of the magnetar’s energy in such a short time as to raise the temperature of 5 of matter to K seems - to us - unlikely. However, if this was indeed possible many of the outstanding problems with all energetic core-collapse SNe (energies in excess of erg, large 56Ni production, aspherical distribution of ejecta) could potentially be solved.
ACKNOWLEDGEMENTS
We are grateful to Anders Jerkstrand for providing a newly subtracted spectrum of SN 2007bi.
This work was made possible by an NAOJ Visiting Joint Research grant, supported by the Research Coordination Committee, National Astronomical Observatory of Japan (NAOJ), National Institutes of Natural Sciences (NINS).
References
- Abbott (2016) Abbott, B. P., Abbott, R., Abbott, T. D., et al. 2016, Phys. Rev. Lett., 116, 061102
- Axelrod (1980) Axelrod, T. S. 1980, Ph.D. Thesis, Univ. of California, Santa Cruz
- Cappellaro et al. (1997) Cappellaro, E., Mazzali, P. A., Benetti, S., Danziger, I. J.; Turatto, M.; della Valle, M.; Patat, F. 1997, A&A, 328, 203
- Chen et al. (2014) Chen K.-J., Heger A., Woosley S., Almgren A., Whalen D. J., 2014, ApJ, 792, 44
- Chen et al. (2017) Chen, T.-W., et al. 2017, A&A, 602, 9
- De Cia et al. (2018) De Cia, A., 8, ApJ, 860, 100
- Quimby et al. (2018) Quimby, R., et al. 2018, ApJ, 855, 2
- Filippenko (1997) Filippenko, A. V. 1997, ARA&A, 35, 309
- Gal-Yam (2012) Gal-Yam, A., 2012, Sci, 337, 927
- Gal-Yam et al. (2009) Gal-Yam, A., et al. 2009, Nature, 462, 624
- Greiner et al. (2015) Greiner, J., et al. 2015, Nature, 523, 189
- Heger & Woosley (2002) Heger A., Woosley S. E., 2002, ApJ, 567, 532
- Jerkstrand et al. (2016) Jerkstrand, A., Smartt, S. J., & Heger, A. 2016, MNRAS, 455, 3207
- Kasen & Bildsten (2010) Kasen, D., & Bildsten, L. 2010, ApJ, 717, 245
- Knop et al. (1999) Knop R., et al., 1999, IAUC, 7128, 1
- Lazzati et al. (2013) Lazzati, D., Villeneuve, M., López-Cámara, D., Morsony, B. J., & Perna, R. 2013, MNRAS, 436, 1867
- Levan et al. (2014) Levan, A. J., Tanvir, N. R., Starling, R. L. C., et al. 2014, ApJ, 781, 13
- Lucy (1991) Lucy, L. B. 1991, ApJ, 383, 308
- Lunnan et al. (2016) Lunnan R., et al., 2016, ApJ, 831, 144
- MacFadyen & Woosley (1999) MacFadyen, A. I., Woosley, S. E. 1999, ApJ, 524, 262
- Maeda et al. (2008) Maeda, K., et al. 2008, Sci, 319, 1220
- Mazzali et al. (1998) Mazzali, P. A., Cappellaro, E., Danziger, I. J., Turatto, M., & Benetti, S. 1998, ApJ, 499, L49
- Mazzali et al. (2014) Mazzali, P. A., McFadyen, A. I., Woosley, S. E., Pian, E., & Tanaka, M. 2014, MNRAS, 443, 67
- Mazzali et al. (2010) Mazzali, P. A., Maurer, I., Valenti, S., Kotak, R., & Hunter, D. 2010, MNRAS, 408, 87
- Mazzali et al. (2001) Mazzali, P. A., Nomoto, K., Patat, F., & Maeda, K. 2001, ApJ, 559, 1047
- Mazzali et al. (2008) Mazzali, P. A., Sauer, D. N, Pastorello, A., Benetti, S., & Hillebrandt, W. 2008, MNRAS, 386, 1897
- Mazzali et al. (2017) Mazzali, P. A., Sauer, D. N., Pian, E., et al. 2017, MNRAS, 469, 2498
- Mazzali et al. (2016) Mazzali, P. A., Sullivan, M., Pian, E., Greiner, J., & Kann, D. A. 2016, MNRAS, 458, 3455
- Mazzali et al. (2005) Mazzali, P. A., et al. 2005, Sci, 308, 1284
- Metzger et al. (2015) Metzger, B. D., Margalit, B., Kasen, D., & Quataert, E. 2015, MNRAS, 454, 3311
- Moriya et al. (2010) Moriya, T., et al. 2010, ApJ, 717, L83
- Moriya et al. (2019) Moriya, T., Mazzali, P.A., & Tanaka, M. 2019, MNRAS, submitted
- Motohara et al. (2006) Motohara, K., et al. 2006, ApJ, 652, L101
- Nakamura et al. (2001) Nakamura, T., Umeda, H., Iwamoto, K., et al. 2001, ApJ, 555, 880
- Nicholl et al. (2013) Nicholl, M., et al. 2013, Nature, 502, 346
- Nicholl et al. (2015) Nicholl, M., et al. 2015, MNRAS, 452, 3869
- Nicholl et al. (2016) Nicholl, M., et al. 2016, ApJ, 828, L18
- Pastorello et al. (2010) Pastorello, A., et al. 2010, ApJ, 724, L16
- Taubenberger et al. (2009) Taubenberger, S., et al. 2009, MNRAS, 397, 677
- Umeda & Nomoto (2008) Umeda H., Nomoto K., 2008, ApJ, 673, 1014
- Woosley et al. (2002) Woosley, S. E., Heger, A., & Weaver, T. A. 2002, Reviews of Modern Physics, 74, 1015
- Woosley (2010) Woosley, S. E. 2010, ApJ, 719, L204
- Woosley (2016) Woosley, S. E. 2016, ApJ, 824, L10
- Woosley (2017) Woosley, S. E. 2017, ApJ, 836, 244
- Yan et al. (2017) Yan L., et al., 2017, ApJ, 848, 6
- Young et al. (2010) Young D. R., et al., 2010, A&A, 512, A70