Synthetic spectra of energetic core-collapse supernovae and the early spectra of SN 2007bi and SN 1999as
Abstract
SN 2007bi and SN 1999as are among the first superluminous supernovae discovered. SN 2007bi was suggested to be powered by the radioactive decay of a large amount () of . SN 1999as has a similar spectrum to SN 2007bi. One suggested way to synthesize such a large amount of is through energetic core-collapse supernovae from very massive progenitors. Although the synthetic light curves of extremely energetic core-collapse supernovae have been shown to be consistent with SN 2007bi, no synthetic spectra have been reported. Here, we present synthetic spectra of extremely energetic core-collapse supernovae during the photospheric phases. We find that the ejecta density structure above needs to be cut in order to explain the co-existing broad and narrow line absorptions in SN 2007bi and SN 1999as. The density cut is likely caused by the interaction between the supernova ejecta and a dense circumstellar medium. Our results indicate that about 3 of hydrogen-free dense circumstellar media might exist near the progenitors of SN 2007bi and SN 1999as. These massive circumstellar media would significantly affect the light-curve and spectral properties of the supernovae. The precursors that are sometimes observed in superluminous supernovae might be related to the collision of the ejecta with such dense circumstellar media. We also confirm results of previous studies that synthetic spectra from pair-instability supernova models do not match the early spectra of SN 2007bi and SN 1999as.
keywords:
supernovae: general – supernovae: individual: SN 1999as, SN 2007bi – stars: massive – stars: mass-loss1 Introduction
Superluminous supernovae (SLSNe) are intrinsically luminous supernovae (SNe) that have been recognized in the last decade (Gal-Yam 2012, 2018; Howell 2017). They typically reach magnitudes brighter than in optical bands. Broadly speaking, two kinds of SLSNe can be distinguished by their spectra – those with hydrogen lines and those without. SLSNe with hydrogen lines (Type II) typically have narrow emission features that are commonly found in Type IIn SNe (e.g., Smith et al., 2007; Smith et al., 2010), and their huge luminosity is ascribed to the presence of dense circumstellar media (CSM) (e.g., Moriya et al., 2013; Chatzopoulos et al., 2013a). SLSNe without hydrogen lines (Type I) do not show obvious interaction signatures as hydrogen-rich SLSNe do (Quimby et al., 2011, 2018; Howell et al., 2013), and their power sources are not well understood (see Moriya et al. 2018 for a review).
SN 2007bi () was one of the first reported Type I SLSNe. It reached mag in the band (Gal-Yam et al., 2009; Young et al., 2010). It was estimated to require of radioactive to account for the peak luminosity. Although the rise time is not well constrained, the light-curve (LC) decline rate is consistent with the decay rate of , which implies that the LC may be powered by the radioactive decay of . In addition, synthetic nebular spectra were found to be consistent with a large production of in a massive carbon-oxygen core (Gal-Yam et al., 2009). These facts led Gal-Yam et al. (2009) to conclude that SN 2007bi could be a pair-instability SN (PISN). SN 1999as () (Knop et al., 1999; Kasen, 2004) is also shown to have similar spectroscopic properties to SN 2007bi in Gal-Yam et al. (2009). The observations of SN 1999as are summarized in Kasen (2004).
PISNe are theoretically predicted explosions of very massive stars with helium core mass between and (e.g., Heger & Woosley, 2002). The very massive core becomes dynamically unstable owing to the production of electron and positron pairs during the evolution. The unstable core collapses and becomes hot enough to trigger explosive oxygen burning. If the core mass is in the above mass range, explosive oxygen burning can release enough energy to unbind the whole star, which then explodes. This explosion is called a PISN (e.g., Rakavy & Shaviv, 1967; Barkat et al., 1967). Explosive nucleosynthsis can lead to the massive production of radioactive , enough to explain the large luminosity of SLSNe. If the core mass is too high, oxygen burning does not produce enough energy to unbind the whole star, which simply collapses to a black hole (e.g., Ohkubo et al., 2009).
Although PISNe were originally suggested to account for SN 2007bi and some other SLSNe, detailed LC and spectral modelling show that PISNe are likely to have different features from those observed in SLSNe. The LCs of hydrogen-free PISNe that become as bright as SLSNe are predicted to have rise times of more than 100 days (e.g., Kasen et al., 2011; Dessart et al., 2013; Chatzopoulos et al., 2015; Kozyreva et al., 2017), while SLSNe tend to have much shorter rise times (Nicholl et al. 2013, 2015; Inserra et al. 2013; De Cia et al. 2018; Lunnan et al. 2018b, but see also Lunnan et al. 2016). Synthetic spectra of PISNe are found to be much redder than the observed spectra of SLSNe and they do not match the observations (e.g., Mazzali et al. 2019; Dessart et al. 2012; Jerkstrand et al. 2016). These issues can be relaxed if strong mixing in the ejecta occurs in PISNe (Mazzali et al. 2019; Kozyreva & Blinnikov 2015), but such a strong mixing is not found in multidimensional explosion simulations of PISNe (e.g., Joggerst & Whalen, 2011; Chatzopoulos et al., 2013b; Chen et al., 2014). The long rise times and red spectra predicted in luminous PISNe result from the massive cores required to synthesize a large amount of , because the core mass determines the synthesized in PISNe (e.g., Heger & Woosley, 2002). The requirement of a very massive core to synthesize enough to account for SLSN luminosity is a fatal issue for the PISN model. It is hard to reconcile the properties of SN 2007bi with the current standard picture of PISNe. Therefore, different power sources than decay, such as spin-down of a strongly magnetized, rapidly rotating neutron star, a magnetar, have been proposed as a power source for SN 2007bi (e.g., Kasen & Bildsten, 2010; Dessart et al., 2012).
The massive production of () required to explain SN 2007bi, however, does not necessarily require a PISN explosion. Umeda & Nomoto (2008) showed that energetic core-collapse SN explosions can produce a large amount of (up to ) if the explosion energy can be as high as . Using their energetic core-collapse SN model, Moriya et al. (2010) showed that the LC of SN 2007bi can be reproduced by an energetic core-collapse SN explosion of a carbon-oxygen progenitor exploded with of energy. To synthesize of , the PISN mechanism requires a carbon-oxygen core of around 100 (Heger & Woosley, 2002), while energetic core-collapse SNe can produce a similar amount of with core masses less than half of that. The significant reduction in ejecta mass can make the LC rise times significantly shorter. The similarity of the nebular spectrum of SN 2007bi to that of SN 1998bw (Mazzali et al., 2001), a broad-line Type Ic SN associated with the long gamma-ray burst (GRB) 980425 (e.g., Galama et al., 1998), also indicates that SN 2007bi may be related to the core-collapse of a massive star (e.g., Jerkstrand et al., 2017; Nicholl et al., 2018).
The previous study of energetic core-collapse SNe by Moriya et al. (2010) focused on LC modelling, and no spectral modelling was performed. In this paper we report synthetic spectra of energetic core-collapse SN models during the early phases, when the photosphere is still in the ejecta, and compare them with those of SN 2007bi and SN 1999as. The accompanying paper by Mazzali et al. (2019) shows synthetic spectra during the nebular phases from the core-collapse SN model. We also present some PISN spectral models for comparison.
The rest of this paper is organized as follows. We first introduce our numerical setups and observational data in Section 2. We show our synthetic spectra in Section 3 and discuss their implications in Section 4. The conclusions of this paper is summarized in Section 5.
| element | core-collapse originala | core-collapse modelingb | He100c | He110c |
|---|---|---|---|---|
| C | ||||
| O | ||||
| Ne | ||||
| Mg | ||||
| Si | ||||
| S | - | |||
| Ar | - | |||
| Ca | - | |||
| Ti | - | - | ||
| Fe | - | - | ||
| Co | - | - | ||
| Ni | - | - | ||
| aAverage abundance at from the original model in Moriya et al. (2010). | ||||
| bAbundance used in our spectral synthesis for the core-collapse model. | ||||
| c PISN models. | ||||
2 Model setup
2.1 Progenitors
2.1.1 Energetic core-collapse SNe
We adopt the same progenitor and explosion models for SN 2007bi presented in Moriya et al. (2010) in this study. The progenitor has a zero-age main-sequence (ZAMS) mass of , with metallicity . Its evolution was numerically followed until core collapse as a single star by Umeda & Nomoto (2008). The progenitor still has the hydrogen-rich envelope and the helium layer at the time of core collapse. Because SN 2007bi, as well as SN 1999as, is a Type Ic SN, we artificially remove these outer layers and take the 43 carbon-oxygen core as the SN progenitor. The hydrogen- and helium-rich layers may be lost via binary interaction (e.g., Izzard et al., 2004; Zapartas et al., 2017). Alternatively, a carbon-oxygen core of the same mass may be made by strong mixing in less massive stars (e.g., Yoon et al., 2006; Aguilera-Dena et al., 2018).
The explosion is initiated by a thermal bomb, with final explosion energy in Moriya et al. (2010). Our spectral modelling is based on the hydrodynamic structure and the nucleosynthesis resulting from this explosion model. We set the mass cut at 3 to have enough amount of to account for the LC of SN 2007bi (Moriya et al., 2010). Thus, the ejecta mass is 40 . Figure 1 shows the density structure at 1 day after the explosion. The ejecta are homologously expanding at this epoch. The SN 2007bi model in Figure 1 is the original model obtained by Moriya et al. (2010) and we use this original density structure for the modelling of SN 2007bi. We find that the spectrum of SN 1999as is better matched by reducing the ejecta mass to 30 . Therefore, we use a density structure scaled to 30 while keeping the explosion energy in modelling the spectrum of SN 1999as (Figure 1). The density structure is scaled as and , where is explosion energy and is ejecta mass.
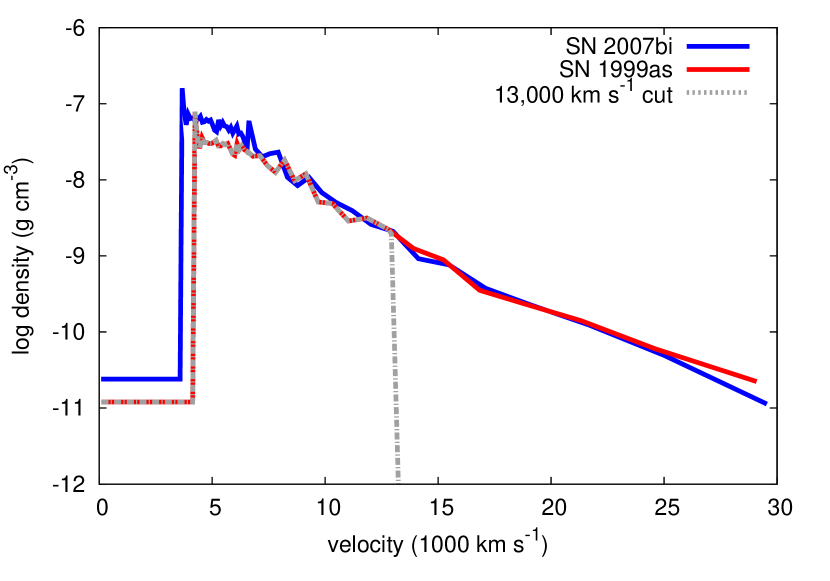
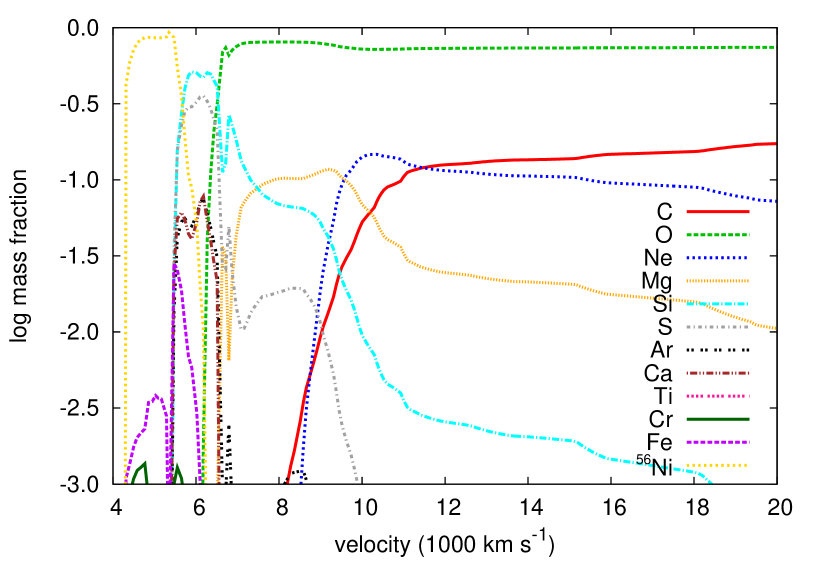
Figure 2 presents the result of the nucleosynthesis calculation by Moriya et al. (2010). The photosphere in our synthetic spectra is located at . Thus, the abundance input for our spectral modelling is based on the average abundance between 7,500 and 10,000 (Table 1). We found that the synthetic spectra with the original abundance result in too strong silicon lines. Therefore, we artificially reduced the silicon abundance by a factor of 10. The oxygen abundance is increased to compensate. This density difference may be caused by the mixing of Si-rich and O-rich layers due to the Rayleigh-Taylor instability. This modified abundance (Table 1) is used in all the synthetic spectra of energetic core-collapse SNe in this paper. Although the ejecta masses of our models for SN 2007bi and SN 1999as are slightly different (40 for SN 2007bi and 30 for SN 1999as), we find that the same abundance above works well for both SNe. We note that the abundance in certain layers where the maximum temperature becomes similar can be similar in energetic massive core collapse SN models (Umeda & Nomoto, 2008).
2.1.2 PISNe
We have also computed synthetic spectra of PISNe to confirm the results of previous studies that show that the early spectrum of SN 2007bi is too blue to be a PISN explosion. We take two PISN explosion models computed by Heger & Woosley (2002), He100 and He110. They are helium stars with metallicity at ZAMS whose initial mass is 100 (He100) and 110 (He110). They experience little mass loss during the evolution and they have masses of, respectively, 95 (He100) and 99 (He110) at the time of explosion. Their explosions produce 6 (He100) and 12 (He110) of , respectively. The LC and spectral properties of these models were previously investigated by Kasen et al. (2011); Jerkstrand et al. (2016). The abundances used in our spectral modelling are listed in Table 1.
2.2 Spectral synthesis
Spectral modelling is performed using the Monte Carlo spectrum synthesis code developed by Mazzali & Lucy (1993); Lucy (1999); Mazzali (2000). The same code has been used for modelling the spectra of several SLSNe (Mazzali et al., 2016; Chen et al., 2016).
The code assumes the existence of a photosphere and it is suitable for modelling early SN spectra, when the photosphere is in the ejecta. Modeling the nebular spectra requires a different approach and they are studied in the accompanying paper (Mazzali et al., 2019). In the spectrum synthesis code we use, blackbody radiation with a given luminosity is emitted from the inner boundary and photon transport in the SN ejecta with a given density structure and composition is solved. We assume the bolometric luminosity estimated by the observations in our spectral modelling ( for both SN 2007bi and SN 1999as). For the PISN models, we use the bolometric luminosity of the models presented in Kasen et al. (2011).
2.3 Observations
There are a few spectra during the photospheric phase of SN 2007bi (Gal-Yam et al., 2009; Young et al., 2010). We use the earliest observed spectrum, taken 47 days after the LC peak in the rest frame, to compare with our synthetic spectra. As the explosion date of SN 2007bi is not well constrained, we assume that this spectrum is at 90 days after the explosion. The LC from the energetic core-collapse SN model with mixing in Moriya et al. (2010) has a rise time of around 50 days, justifying our assumption on the epoch of the spectrum.
SN 1999as was the first observed SLSN. The photometric and spectroscopic observations of SN 1999as are summarized in Kasen (2004). We take the spectrum observed on 16 March 1999, which was shown to have similar properties to the early spectrum of SN 2007bi (Gal-Yam et al., 2009). The explosion date of SN 1999as is not clear. We assume that 16 March 1999 is 85 days after the explosion in the rest frame. A slight difference in the assumed epoch does not affect the overall conclusions in this paper. Some modelling efforts for SN 1999as were previously reported in Hatano et al. (2001); Deng et al. (2001).
3 Synthetic spectra
3.1 Energetic core-collapse SNe
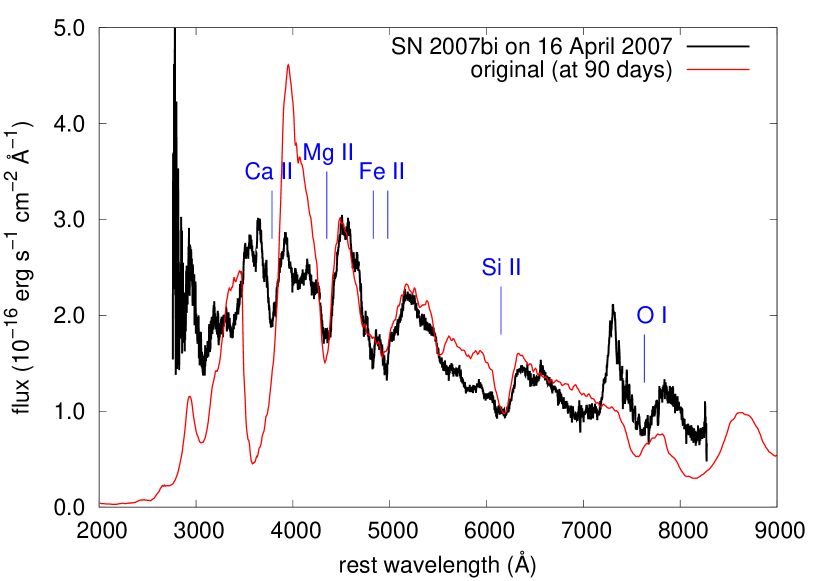
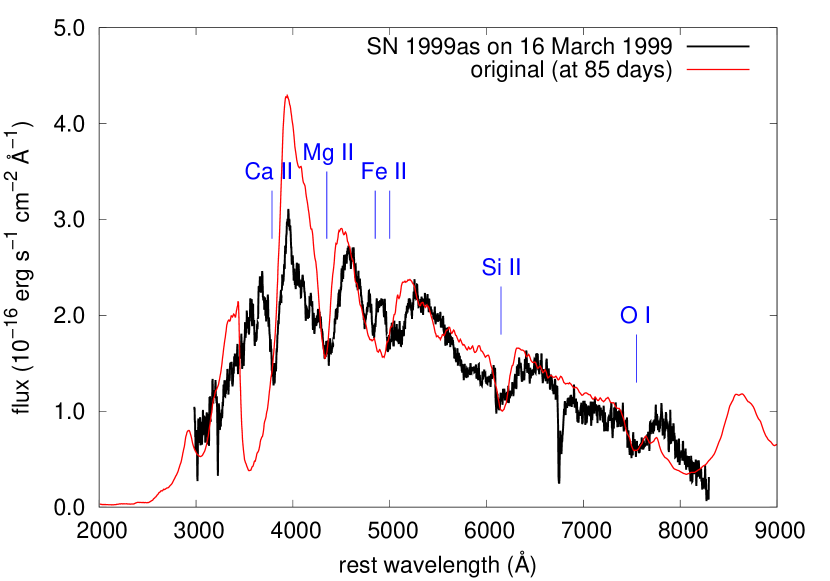
We first show the synthetic spectra based on the original density structure without any modifications from the hydrodynamical result (Figure 3). The synthetic spectrum of SN 2007bi has the photosphere at 7,000 and the photospheric temperature is 8,300 K. The synthetic spectrum for SN 1999as has the photosphere at 7,500 and the photospheric temperature is 8,200 K. The two synthetic spectra are similar.
The synthetic spectra reproduce key features such as the Ca ii, Mg ii, Fe ii, Si ii, and O i lines (Figure 3). However, some lines in the models are broader than observed. A clear example is the Fe ii lines at around Å. At least two distinct Fe ii lines are seen in the observed spectra, while the two lines are merged in the synthetic spectra because they are too broad to be identified individually.
The breadth of the lines is determined by the velocity extent of the line forming region. Steeper density slopes make the line forming regions narrower, and thus line width decreases with steeper density slopes (e.g., Mazzali et al., 2016; Mazzali et al., 2017). The presence of narrow absorption lines in the spectra of SN 2007bi and SN 1999as suggest that the density slope in the SN ejecta is steeper than that in our original model. However, the whole ejecta density slope does not necessarily have to be steeper. Thus, we make the density structure above a certain velocity steeper than the original structure to see if the narrow lines can be reproduced. The most extreme case of a steep density structure is obtained by simply cutting the density structure above a certain velocity. We focus on this extreme case to explore above what velocity the ejecta need to have a very steep density structure, in clear contrast with the original model. Figure 1 shows an example of the density structure adopted in the following spectral modelling. The density structure is assumed to drop suddenly above the specified velocity cut.
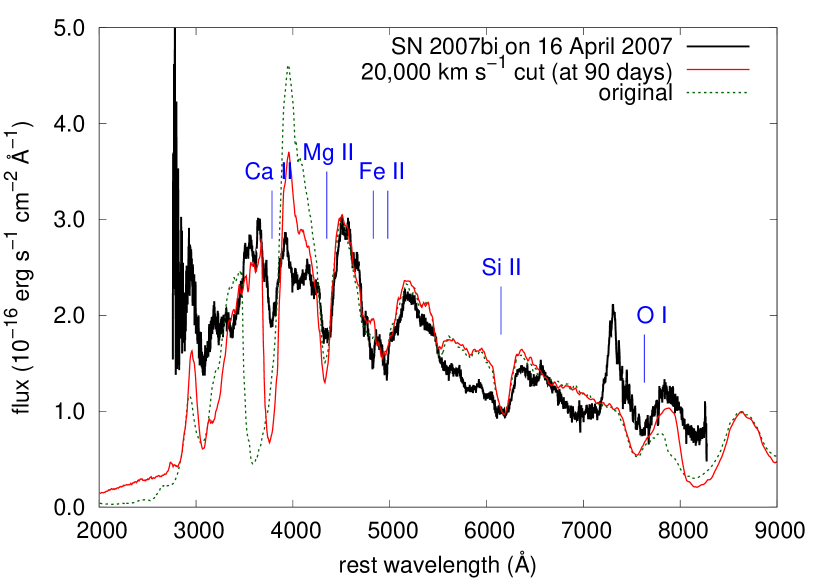
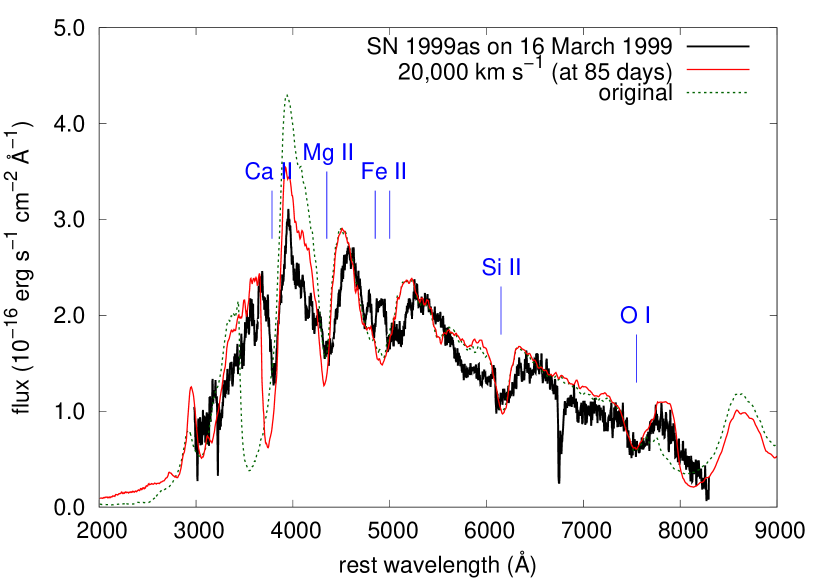
Figure 4 shows the synthetic spectra with a velocity cut at 20,000 . The maximum velocity of the original model reaches near 30,000 . The mass between 20,000 and 30,000 is 0.9 (SN 2007bi) and 0.6 (SN 1999as). We can clearly see the reduction of the Ca ii absorption line width and the weakening of the corresponding emission strength. We can also see that the narrow Fe ii lines at around Å are starting to separate, although they are still not as clearly distinct as observed. The redder side of the spectra is not significantly affected by the velocity cut, but some improvements are found.
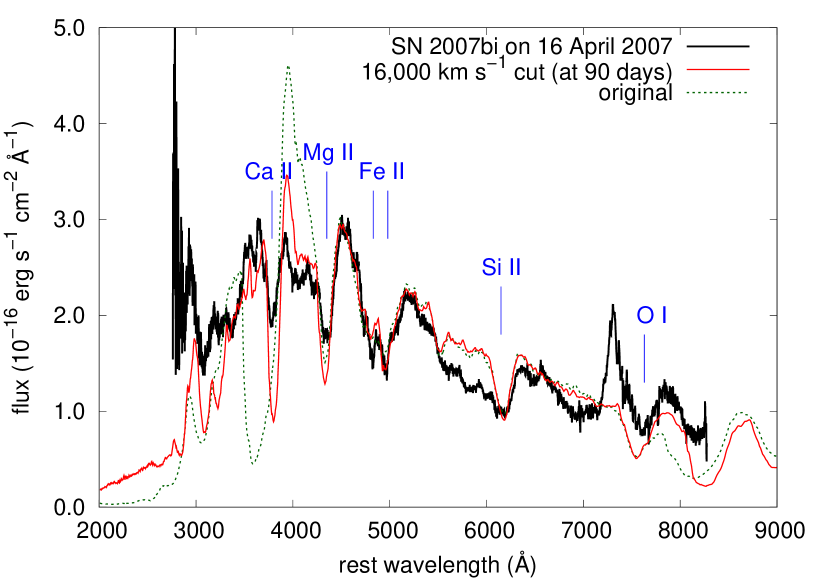
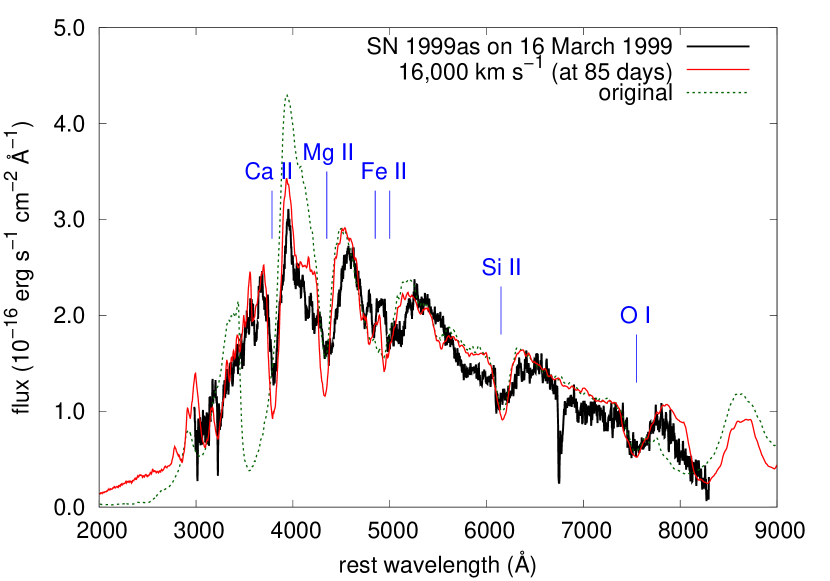
A clear separation in the Fe ii lines is found when we set the velocity cut at 16,000 as presented in Figure 5. The mass contained above 16,000 is 2.8 (SN 2007bi) and 3.2 (SN 1999as) and these masses are removed in these models. The line width of the Ca ii line is now also well matched. The reduction in the Ca ii line width also leads to the appearance of narrow lines of Fe group elements in the bluer part of the synthetic spectra. Overall, the synthetic spectra with the 16,000 cut satisfactorily match the observed spectra.
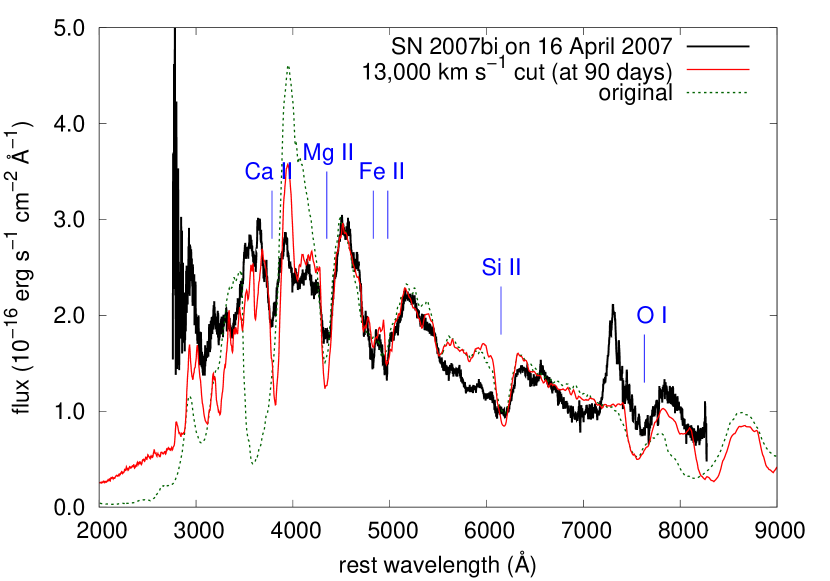
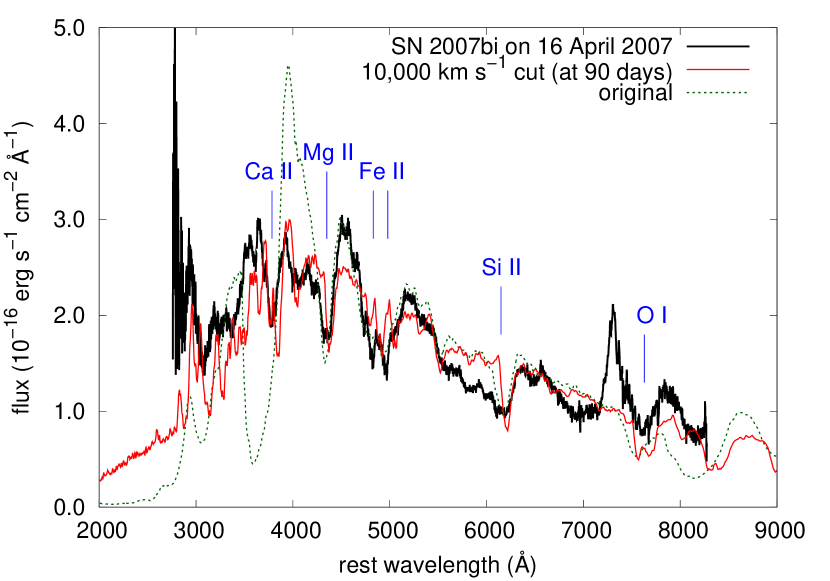
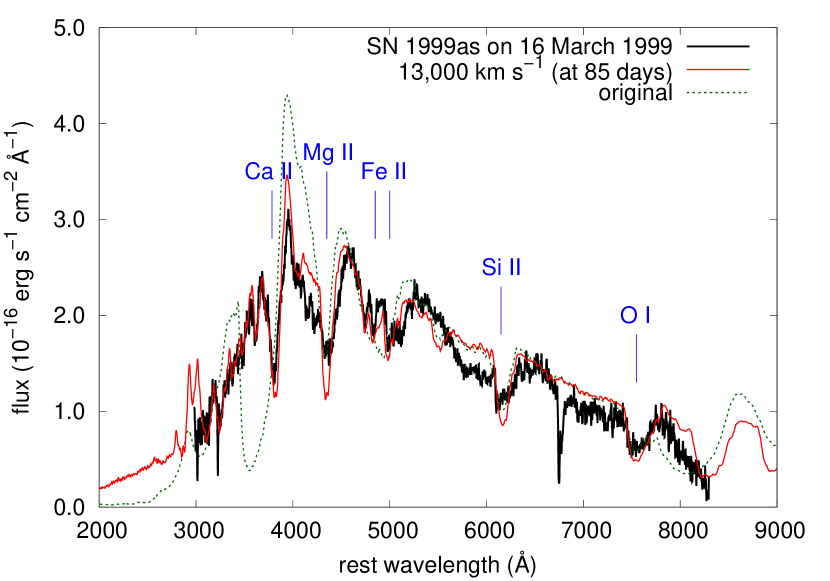
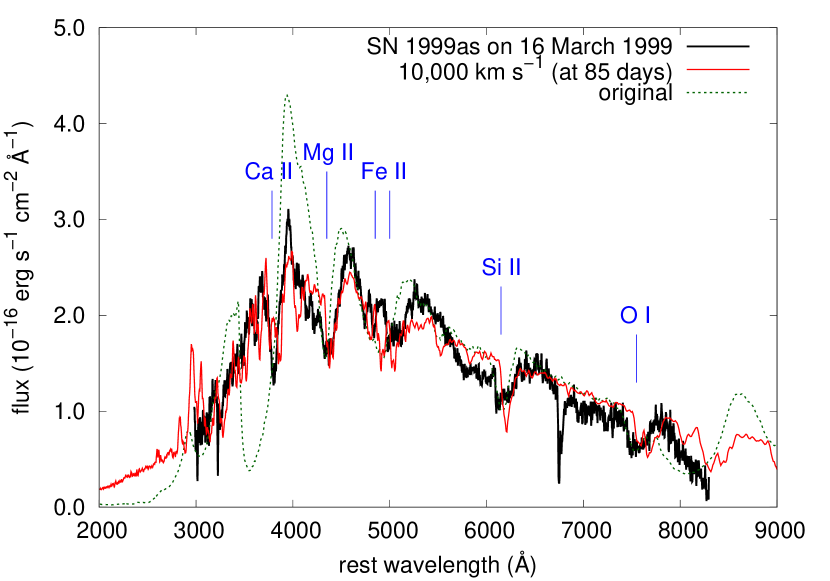
Figure 6 shows the synthetic spectra with velocity cuts at 13,000 (5.1 cut in SN 2007bi and 5.6 cut in SN 1999as) and 10,000 (10.5 cut in SN 2007bi and 10.6 cut in SN 1999as). The models cut at 13,000 reproduce the narrow features in SN 2007bi and SN 1999as, and they are overall as good as the models cut at 16,000 presented in Figure 5. In the models cut at 10,000 the synthetic spectra start to show too many narrow features that are not observed in SN 2007bi and SN 1999as. Thus, the velocity cut should be at a velocity larger than 10,000 .
Given the above results, we conclude that the synthetic spectra from the energetic core-collapse SN model are consistent with the observed spectral features of SN 2007bi and SN 1999as, including both broad and narrow components, if we introduce a velocity cut between 16,000 and 13,000 . We discuss the origin of the velocity cut in Section 4.
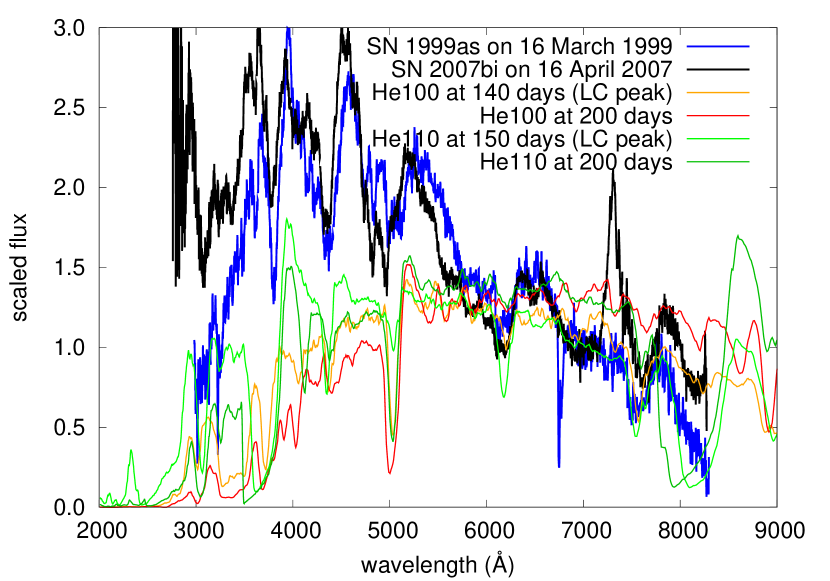
3.2 PISN models
Figure 7 presents our synthetic PISN spectra and their comparison with the spectra of SN 2007bi and SN 1999as. Because the spectra of SN 2007bi and SN 1999as were observed after the LC peak, we show the synthetic spectra at and after the LC peak. The PISN spectra at LC peak are already much redder than SN 2007bi and SN 1999as, confirming the results of previous studies that SN 2007bi, as well as SN 1999as, have too blue spectra to be PISNe (e.g., Dessart et al., 2012).
4 Discussion
We have shown that the energetic core-collapse SN model of Moriya et al. (2010) can reproduce the overall spectral features of SN 2007bi and SN 1999as if a velocity cut at around in the density structure is introduced. With the velocity cut, both broad and narrow spectral lines are reproduced. Such narrow absorptions are sometimes found in SLSN spectra (Liu et al., 2017; Quimby et al., 2018; Gal-Yam, 2018). They can be explained by the existence of a velocity cut in the ejecta.
Such a density cut in the ejecta might be related to the density structure of the progenitor. Alternatively, we speculate that a promising physical origin of the velocity cut is the deceleration of the outermost layers in the SN ejecta by the collision with an external dense CSM. If a dense CSM surrounds the progenitor, the outer layers can be decelerated and a slow, dense and cool shell is formed between the SN ejecta and the dense CSM (e.g., Moriya et al., 2013; Sorokina et al., 2016). In the models of both SN 2007bi and SN 1999as, the mass in the ejecta above 16,000 is about 3 and a similar amount of dense CSM is required to exist to make the velocity cut and account for the narrow spectral lines.
Kasen (2004) previously proposed a similar idea to explain the narrow spectral features observed in SN 1999as. Unlike this paper, Kasen (2004) did not use a hydrodynamical model for the ejecta structure and did not perform LC modelling as we did in our previous study (Moriya et al., 2010). However, his simplified modelling led to the conclusion that a velocity cut at can explain the narrow spectral features observed in SN 1999as, which is in full accord with our conclusion.
The kinetic energy contained in the outermost layers above 16,000 is in both SN 2007bi and SN 1999as models. If the outermost layers are decelerated, this huge amount of energy could be released as radiation and the SN luminosity may have been enhanced by the extra light from interaction at early times. Thus, all the luminosity in SN 2007bi may not necessarily come from decay as proposed by Moriya et al. (2010). Still, the consistency of the late-time spectrum and photometry of SN 2007bi with decay energization cannot be discounted. Tolstov et al. (2017a); Tolstov et al. (2017b) also propose that more luminous SLSNe such as iPTF12dam and Gaia16apd are powered by the interaction between energetic core-collapse SNe and massive dense CSM, although they found more than 10 of hydrogen-free CSM is required to explain these SLSNe. In this case, however, we do not expect to see the absorption line spectrum that is typical of Type Ic SLSNe, making hard for this scenario to reconcile with the observations. The precursor bump observed in SLSNe (e.g., Leloudas et al., 2012; Nicholl & Smartt, 2016) could also be related to such a deceleration of the outer layers (Moriya & Maeda, 2012), making the subsequent narrow spectral features. A Type Ic SN 2010mb had an early luminosity excess which is attributed to the interaction between the SN ejecta and dense CSM (Ben-Ami et al., 2014). Interestingly enough, the estimated CSM mass for SN 2010mb ( ) is similar to those estimated for SN 2007bi and SN 1999as here.
The early interaction between the SN ejecta and dense CSM would result in the formation of the cool dense shell surrounding the SN ejecta. The cool dense shell contains which is about 10% of the original ejecta and the diffusion time in the ejecta does not change much by losing this small amount. Thus, the main part of the LC as presented in Moriya et al. (2010) is not affected much by the existence of the dense CSM. Our original hydrodynamic model does not take the effect of the dense CSM into account and the cool dense shell does not exist in the density structure we use for the spectroscopic modelling. The formation of the cool dense shell prevents the reverse shock to propagate quickly into the ejecta and the hydrodynamic structure below the dense cool shell would not be affected much by the possible CSM interaction we propose (e.g., Moriya et al., 2013). Therefore, our simple density cut would be a reasonable assumption. Still, the dense shell does exist above the photosphere and it may have a certain effect the spectroscopic properties. Because the cool dense shell is unstable, it is likely that the shell is deformed and creates a clumpy structure. The effect of the clumpy structure needs to be investigated (e.g., Chugai & Danziger, 1994), but this is beyond the scope of this paper.
The existence of hydrogen-free dense CSM in Type I SLSNe has been speculated in many studies (Chevalier & Irwin, 2011; Moriya & Maeda, 2012; Ginzburg & Balberg, 2012; Chatzopoulos et al., 2013a; Sorokina et al., 2016; Chen et al., 2016; Tolstov et al., 2017a; Tolstov et al., 2017b). The existence of a CSM shell is also identified in the Type Ic SLSN iPTF16eh (Lunnan et al., 2018a), as well as in three Type Ic SLSNe with late-phase hydrogen emission (Yan et al. 2015, 2017, but see also Moriya et al. 2015). In our energetic core-collapse SN models, the dense CSM may have been formed shortly before the explosion by the pulsational pair-instability (Woosley et al., 2007; Woosley, 2017) because the carbon-oxygen core of our progenitor is massive enough to initiate the instability. Another possible mechanism to form such a massive CSM shortly before the explosion is through the rapid progenitor contraction that is linked to the final progenitor evolution (Aguilera-Dena et al., 2018). The exact mechanism to form a massive CSM remains a mystery, and further studies are needed to identify it.
The carbon-oxygen core mass of around 40 required to reproduce SN 2007bi is close to the maximum core mass predicted to exist. Woosley (2017) shows that carbon-oxygen cores above 40 suffer from the pulsational pair instability and a part of the core is inevitably ejected. For example, a 48 helium star with a carbon-oxygen core of 40 loses 7 from the surface shortly before core collapse, leaving only 41 at the time of core collapse (Woosley, 2017). This combination of core and CSM mass matches well what is needed for our energetic core-collapse SN picture for SN 2007bi. Woosley (2017) shows that the carbon-oxygen core mass is limited to below around 45 at core collapse. Therefore, it may be difficult to explain Type Ic SLSNe requiring ejecta exceeding around 50 as energetic core-collapse explosions.
One remaining question is how to achieve the huge explosion energy () required to synthesize 6 of for SN 2007bi. This amount of energy needs to be provided in a short timescale in the massive core in order to make the temperature high enough to have sufficient synthesis (e.g., Woosley et al., 2002; Umeda & Nomoto, 2008). The neutrino-driven explosion mechanism cannot provide this amount of energy (e.g., Janka, 2012). A candidate energy source is the quick spin down of a strongly magnetized rapidly rotating neutron star (magnetar). Depending on the equation of state of nuclear matter, the magnetar can have an initial rotational energy of as high as (cf. Metzger et al., 2015). A GRB and associated SN in total have an explosion energy of , which indicates that their major power source could be the magnetar spin down (Mazzali et al., 2014). It is possible that SN 2007bi originates from the spin down of a magnetar that happened to acquire more rotational energy through its evolution than those of GRB progenitors.
5 Conclusions
We presented synthetic spectra of massive (), energetic () core-collapse SNe during the photospheric phase. Energetic core-collapse SN explosions are suggested to account for SLSNe with slow LC declines such as SN 2007bi (Moriya et al., 2010). A previous study by Moriya et al. (2010) showed that the LC of SN 2007bi is consistent with the energetic core-collapse SN explosion model. However, no spectroscopic modelling had been performed for this model. We have performed a spectrum synthesis calculations during the photospheric phase and compared the results with SN 2007bi as well as SN 1999as, a SLSN with properties similar to SN 2007bi. In the accompanying paper, Mazzali et al. (2019) investigate the nebular spectral properties of the massive energetic core-collapse SN model.
We have found that the synthetic spectra from the energetic core-collapse SN model match the early spectra of SN 2007bi and SN 1999as if the density structure above is cut. The velocity cut is required in order to have narrow spectral line components in addition to the broad ones observed in these SNe. We have also calculated spectra of PISN models and confirm previous results that these models produce spectra that are too red to match those of SN 2007bi.
A possible origin of the velocity cut is the existence of massive CSM around the progenitor. The mass in the ejecta above the velocity cut () is . If a similar amount of CSM exists around the progenitor, the outer ejecta layers can be decelerated, causing what is seen as a velocity cut in the density structure. Because the outer layers contain , their deceleration can provide a part of the SLSN luminosity, especially at early phases. We speculate that the precursor often observed in SLSNe may be related to the deceleration of such an outer layer. We speculate that the interaction between the dense CSM and SN ejecta may result in the formation of a dense clumpy CSM around the SN ejecta, which may affect the spectroscopic properties.
Acknowledgements
This work was achieved using the grant of NAOJ Visiting Joint Research supported by the Research Coordination Committee, National Astronomical Observatory of Japan (NAOJ), National Institutes of Natural Sciences (NINS). TJM is supported by the Grants-in-Aid for Scientific Research of the Japan Society for the Promotion of Science (16H07413, 17H02864, 18K13585).
References
- Aguilera-Dena et al. (2018) Aguilera-Dena D. R., Langer N., Moriya T. J., Schootemeijer A., 2018, preprint, (arXiv:1804.07317)
- Barkat et al. (1967) Barkat Z., Rakavy G., Sack N., 1967, Physical Review Letters, 18, 379
- Ben-Ami et al. (2014) Ben-Ami S., et al., 2014, ApJ, 785, 37
- Chatzopoulos et al. (2013a) Chatzopoulos E., Wheeler J. C., Vinko J., Horvath Z. L., Nagy A., 2013a, ApJ, 773, 76
- Chatzopoulos et al. (2013b) Chatzopoulos E., Wheeler J. C., Couch S. M., 2013b, ApJ, 776, 129
- Chatzopoulos et al. (2015) Chatzopoulos E., van Rossum D. R., Craig W. J., Whalen D. J., Smidt J., Wiggins B., 2015, ApJ, 799, 18
- Chen et al. (2014) Chen K.-J., Heger A., Woosley S., Almgren A., Whalen D. J., 2014, ApJ, 792, 44
- Chen et al. (2016) Chen T.-W., et al., 2016, preprint, (arXiv:1611.09910)
- Chevalier & Irwin (2011) Chevalier R. A., Irwin C. M., 2011, ApJ, 729, L6
- Chugai & Danziger (1994) Chugai N. N., Danziger I. J., 1994, MNRAS, 268, 173
- De Cia et al. (2018) De Cia A., et al., 2018, ApJ, 860, 100
- Deng et al. (2001) Deng J. S., Hatano K., Nakamura T., Maeda K., Nomoto K., Nugent P., Aldering G., Branch D., 2001, in Inoue H., Kunieda H., eds, Astronomical Society of the Pacific Conference Series Vol. 251, New Century of X-ray Astronomy. p. 238
- Dessart et al. (2012) Dessart L., Hillier D. J., Waldman R., Livne E., Blondin S., 2012, MNRAS, 426, L76
- Dessart et al. (2013) Dessart L., Waldman R., Livne E., Hillier D. J., Blondin S., 2013, MNRAS, 428, 3227
- Gal-Yam (2012) Gal-Yam A., 2012, Science, 337, 927
- Gal-Yam (2018) Gal-Yam A., 2018, preprint, (arXiv:1806.08224)
- Gal-Yam et al. (2009) Gal-Yam A., et al., 2009, Nature, 462, 624
- Galama et al. (1998) Galama T. J., et al., 1998, Nature, 395, 670
- Ginzburg & Balberg (2012) Ginzburg S., Balberg S., 2012, ApJ, 757, 178
- Hatano et al. (2001) Hatano K., Maeda K., Deng J. S., Nomoto K., Branch D., Nugent P., Aldering G., 2001, in Inoue H., Kunieda H., eds, Astronomical Society of the Pacific Conference Series Vol. 251, New Century of X-ray Astronomy. p. 244
- Heger & Woosley (2002) Heger A., Woosley S. E., 2002, ApJ, 567, 532
- Howell (2017) Howell D. A., 2017, Superluminous Supernovae. Springer International Publishing, Cham, pp 1–29, doi:10.1007/978-3-319-20794-0_41-1, http://dx.doi.org/10.1007/978-3-319-20794-0_41-1
- Howell et al. (2013) Howell D. A., et al., 2013, ApJ, 779, 98
- Inserra et al. (2013) Inserra C., et al., 2013, ApJ, 770, 128
- Izzard et al. (2004) Izzard R. G., Ramirez-Ruiz E., Tout C. A., 2004, MNRAS, 348, 1215
- Janka (2012) Janka H.-T., 2012, Annual Review of Nuclear and Particle Science, 62, 407
- Jerkstrand et al. (2016) Jerkstrand A., Smartt S. J., Heger A., 2016, MNRAS, 455, 3207
- Jerkstrand et al. (2017) Jerkstrand A., et al., 2017, ApJ, 835, 13
- Joggerst & Whalen (2011) Joggerst C. C., Whalen D. J., 2011, ApJ, 728, 129
- Kasen (2004) Kasen D. N., 2004, PhD thesis, University of California, Berkeley, California, USA
- Kasen & Bildsten (2010) Kasen D., Bildsten L., 2010, ApJ, 717, 245
- Kasen et al. (2011) Kasen D., Woosley S. E., Heger A., 2011, ApJ, 734, 102
- Knop et al. (1999) Knop R., et al., 1999, IAU Circ., 7128
- Kozyreva & Blinnikov (2015) Kozyreva A., Blinnikov S., 2015, MNRAS, 454, 4357
- Kozyreva et al. (2017) Kozyreva A., et al., 2017, MNRAS, 464, 2854
- Leloudas et al. (2012) Leloudas G., et al., 2012, A&A, 541, A129
- Liu et al. (2017) Liu Y.-Q., Modjaz M., Bianco F. B., 2017, ApJ, 845, 85
- Lucy (1999) Lucy L. B., 1999, A&A, 345, 211
- Lunnan et al. (2016) Lunnan R., et al., 2016, ApJ, 831, 144
- Lunnan et al. (2018a) Lunnan R., et al., 2018a, Nature Astronomy,
- Lunnan et al. (2018b) Lunnan R., et al., 2018b, ApJ, 852, 81
- Mazzali (2000) Mazzali P. A., 2000, A&A, 363, 705
- Mazzali & Lucy (1993) Mazzali P. A., Lucy L. B., 1993, A&A, 279, 447
- Mazzali et al. (2001) Mazzali P. A., Nomoto K., Patat F., Maeda K., 2001, ApJ, 559, 1047
- Mazzali et al. (2014) Mazzali P. A., McFadyen A. I., Woosley S. E., Pian E., Tanaka M., 2014, MNRAS, 443, 67
- Mazzali et al. (2016) Mazzali P. A., Sullivan M., Pian E., Greiner J., Kann D. A., 2016, MNRAS, 458, 3455
- Mazzali et al. (2017) Mazzali P. A., Sauer D. N., Pian E., Deng J., Prentice S., Ben Ami S., Taubenberger S., Nomoto K., 2017, MNRAS, 469, 2498
- Mazzali et al. (2019) Mazzali P. A., Moriya T. J., Tanaka M., Woosley S. E., 2019, MNRAS, submitted
- Metzger et al. (2015) Metzger B. D., Margalit B., Kasen D., Quataert E., 2015, MNRAS, 454, 3311
- Moriya & Maeda (2012) Moriya T. J., Maeda K., 2012, ApJ, 756, L22
- Moriya et al. (2010) Moriya T., Tominaga N., Tanaka M., Maeda K., Nomoto K., 2010, ApJ, 717, L83
- Moriya et al. (2013) Moriya T. J., Blinnikov S. I., Tominaga N., Yoshida N., Tanaka M., Maeda K., Nomoto K., 2013, MNRAS, 428, 1020
- Moriya et al. (2015) Moriya T. J., Liu Z.-W., Mackey J., Chen T.-W., Langer N., 2015, A&A, 584, L5
- Moriya et al. (2018) Moriya T. J., Sorokina E. I., Chevalier R. A., 2018, Space Sci. Rev., 214, 59
- Nicholl & Smartt (2016) Nicholl M., Smartt S. J., 2016, MNRAS, 457, L79
- Nicholl et al. (2013) Nicholl M., et al., 2013, Nature, 502, 346
- Nicholl et al. (2015) Nicholl M., et al., 2015, MNRAS, 452, 3869
- Nicholl et al. (2018) Nicholl M., Berger E., Blanchard P. K., Gomez S., Chornock R., 2018, preprint, (arXiv:1808.00510)
- Ohkubo et al. (2009) Ohkubo T., Nomoto K., Umeda H., Yoshida N., Tsuruta S., 2009, ApJ, 706, 1184
- Quimby et al. (2011) Quimby R. M., et al., 2011, Nature, 474, 487
- Quimby et al. (2018) Quimby R. M., et al., 2018, ApJ, 855, 2
- Rakavy & Shaviv (1967) Rakavy G., Shaviv G., 1967, ApJ, 148, 803
- Smith et al. (2007) Smith N., et al., 2007, ApJ, 666, 1116
- Smith et al. (2010) Smith N., Chornock R., Silverman J. M., Filippenko A. V., Foley R. J., 2010, ApJ, 709, 856
- Sorokina et al. (2016) Sorokina E., Blinnikov S., Nomoto K., Quimby R., Tolstov A., 2016, ApJ, 829, 17
- Tolstov et al. (2017a) Tolstov A., Nomoto K., Blinnikov S., Sorokina E., Quimby R., Baklanov P., 2017a, ApJ, 835, 266
- Tolstov et al. (2017b) Tolstov A., Zhiglo A., Nomoto K., Sorokina E., Kozyreva A., Blinnikov S., 2017b, ApJ, 845, L2
- Umeda & Nomoto (2008) Umeda H., Nomoto K., 2008, ApJ, 673, 1014
- Woosley (2017) Woosley S. E., 2017, ApJ, 836, 244
- Woosley et al. (2002) Woosley S. E., Heger A., Weaver T. A., 2002, Reviews of Modern Physics, 74, 1015
- Woosley et al. (2007) Woosley S. E., Blinnikov S., Heger A., 2007, Nature, 450, 390
- Yan et al. (2015) Yan L., et al., 2015, ApJ, 814, 108
- Yan et al. (2017) Yan L., et al., 2017, preprint, (arXiv:1704.05061)
- Yoon et al. (2006) Yoon S.-C., Langer N., Norman C., 2006, A&A, 460, 199
- Young et al. (2010) Young D. R., et al., 2010, A&A, 512, A70
- Zapartas et al. (2017) Zapartas E., et al., 2017, ApJ, 842, 125